Page MenuHomePhabricator

kafka-logging __consumer_offsets topic traffic increased
Closed, ResolvedPublic

Description

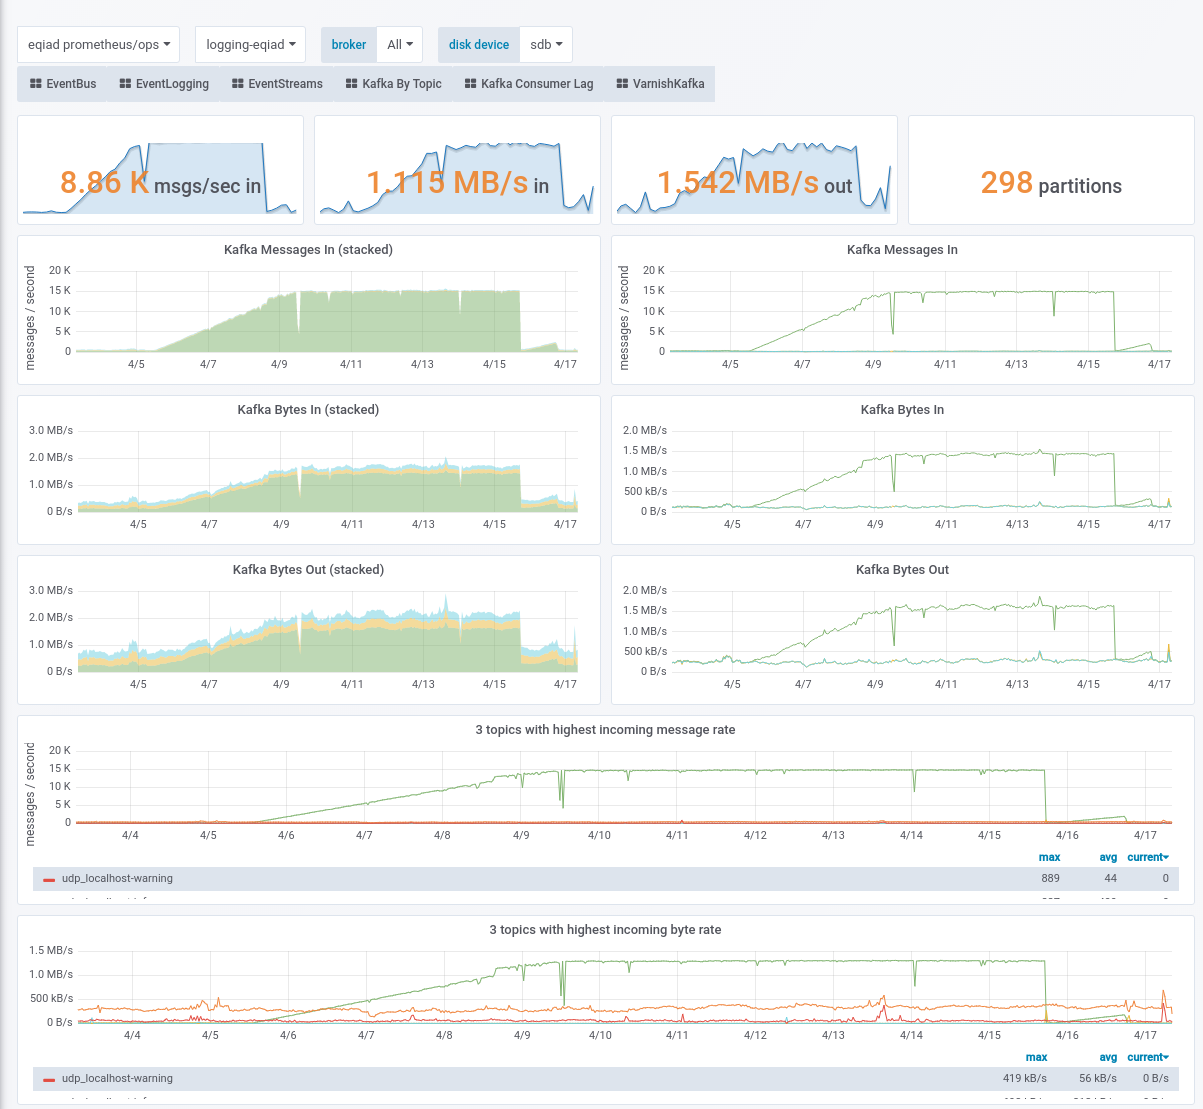
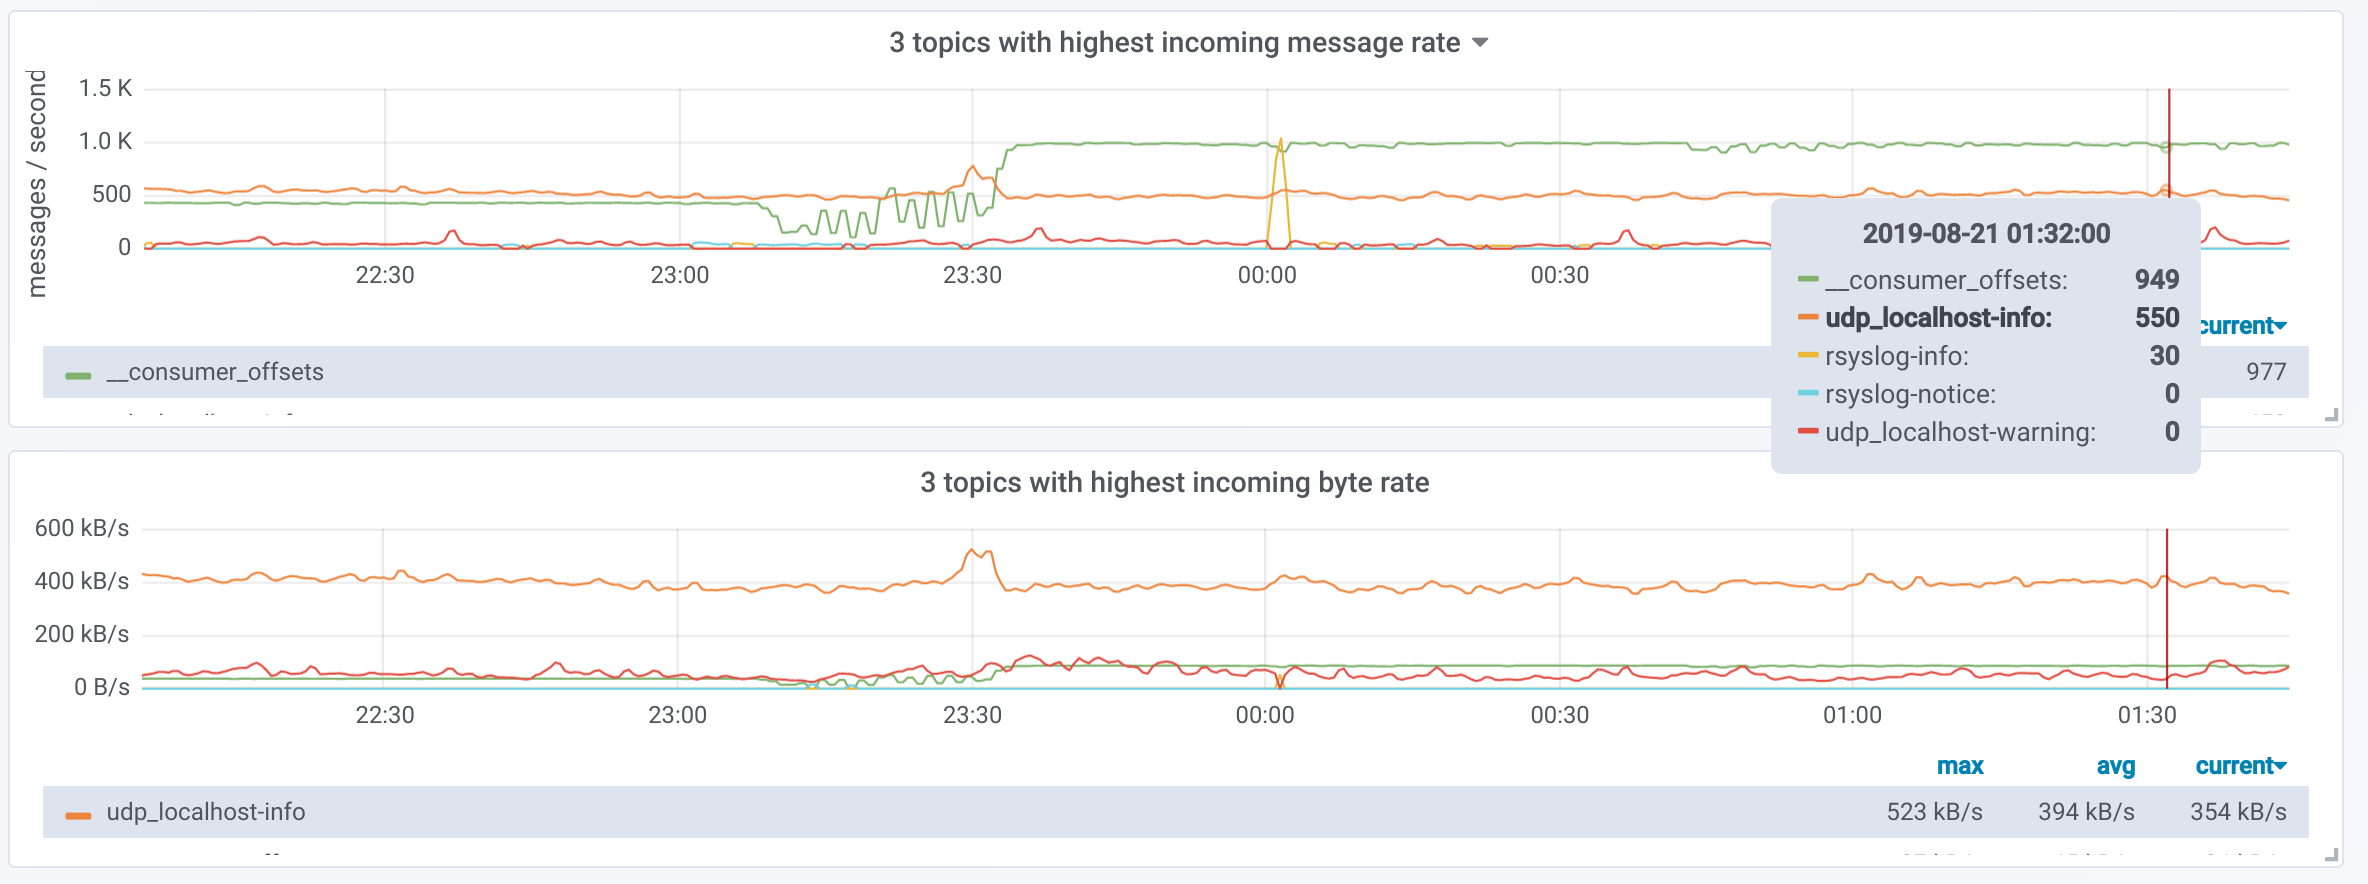
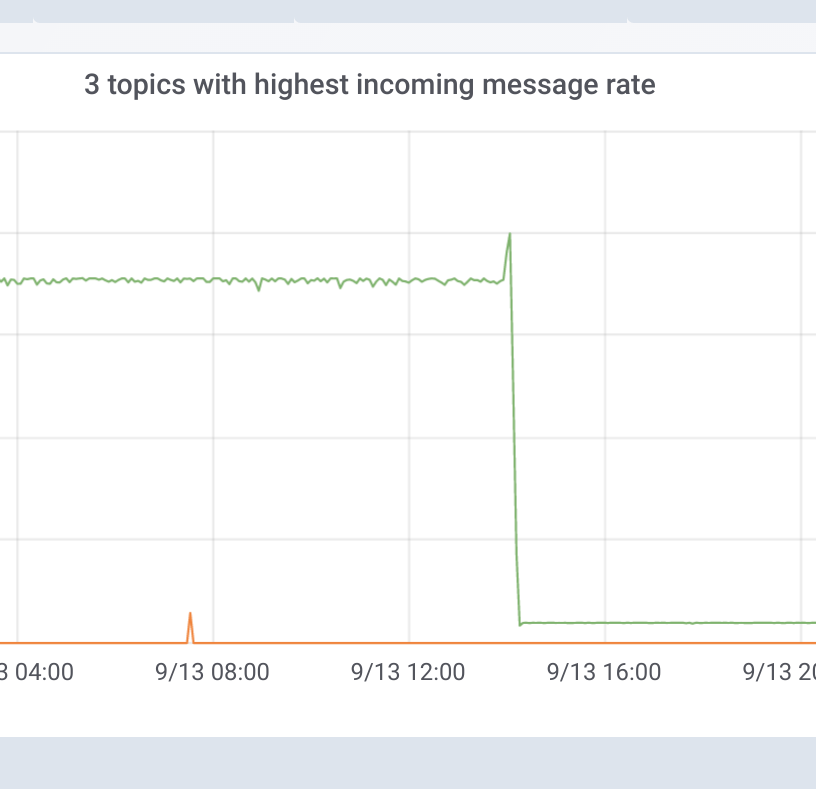
Starting 2019-04-05 it looks like traffic (messages and bytes) to __consumer_offsets to logstash1010 kept increasing and stayed at ~15k msg/s. A logstash frontend restart seems to reset the traffic (happened on april 15th, then again on april 16th), although I don't see the traffic increasing now (screenshot below). link to dashboard (note that it'll take a while to load, the dashboard is heavy on prometheus ATM)

I'm filing this for reference / tracking as I don't know if it causes any problems or even what's the root cause. cc @elukey @Ottomata @herron @colewhite

2019-04-17-102510_1203x1109_scrot.png (1×1 px, 237 KB)

Event Timeline

From https://grafana.wikimedia.org/d/000000484/kafka-consumer-lag?from=now-7d&to=now&orgId=1&var-datasource=eqiad%20prometheus%2Fops&var-cluster=logging-eqiad&var-topic=All&var-consumer_group=All I don't see any consumer group committing like crazy offsets to kafka..

But we have the following in burrow (kafkamon1001 - /etc/burrow/logging-eqiad/burrow.toml):

[consumer.logging-eqiad]
class-name="kafka"
cluster="logging-eqiad"
servers=["logstash1010.eqiad.wmnet:9092","logstash1011.eqiad.wmnet:9092","logstash1012.eqiad.wmnet:9092"]
group-blacklist="^(console-consumer-|python-kafka-consumer-|test_).*$"

I am wondering if it was somebody executing a consumer from somewhere. This is another instance of a problem that we have been seeing occurring over and over, namely consumers not being throttled when requesting data.

Messages in to __consumer_offsets should only be consumer offset commits, so its strange that we don't see that metric also increasing. I guess it'd have to be one of those blacklisted from burrow metrics? Is that metric available in JMX? I think it might be. Perhaps we can graph the total number of offset commits somehow.

Kafka JMX? (Burrow is written in Go IIRC so no luck on that side)

The answer is probably buried into __consumer-offsets itself, but trying to kafkacat it ends up in a lot of garbage being printed. Maybe there is a way to read that stream (as Burrow does) and dump all its data to see who was committing so frequently?

Also note that after the last reset on 16/04 __consumer_offsets now isn't increasing anymore, I'm wondering if it has to do with logstash upgrades (and mismatching versions? thinking out loud)

elukey@logstash1012:~$ kafka-console-consumer --bootstrap-server localhost:9092 --topic __consumer_offsets --formatter "kafka.coordinator.group.GroupMetadataManager\$OffsetsMessageFormatter"
[logstash-codfw,rsyslog-notice,2]::[OffsetMetadata[28922540,NO_METADATA],CommitTime 1556009103234,ExpirationTime 1556613903234]
[logstash-codfw,rsyslog-warning,2]::[OffsetMetadata[4692,NO_METADATA],CommitTime 1556009103234,ExpirationTime 1556613903234]
[logstash-codfw,rsyslog-info,2]::[OffsetMetadata[28557514,NO_METADATA],CommitTime 1556009103234,ExpirationTime 1556613903234]

This is an example tailing from the __consumer_offset topic, but if we start from beginning of time we should be able to find the whole history and analyze it. I am not sure though if the time retention policies have already kicked in..

elukey@logstash1012:~$ kafka-console-consumer --bootstrap-server localhost:9092 --topic __consumer_offsets --formatter "kafka.coordinator.group.GroupMetadataManager\$OffsetsMessageFormatter" --from-beginning --max-messages 10
[console-consumer-67176,__consumer_offsets,22]::[OffsetMetadata[0,NO_METADATA],CommitTime 1556009105093,ExpirationTime 1556613905093]

elukey@logstash1012:~$ date -d @1556009105093
Sat Dec 18 15:24:53 UTC 51277

We are good!

EDIT: just realized that the timestamp has not been converted properly, going to check and fix.

EDIT2: it is in millisecond, the retention time for this data is not a lot.

Mentioned in SAL (#wikimedia-operations) [2019-04-23T09:19:55Z] <elukey> dumping Kafka consumer offsets' history on logstash1012 for T221202

One thing to note is the following:

elukey@logstash1012:~$ kafka-consumer-groups --list --bootstrap-server localhost:9092
Note: This will not show information about old Zookeeper-based consumers.
console-consumer-67176
console-consumer-3654
console-consumer-73745
logstash
logstash-codfw
console-consumer-67964
console-consumer-75962
console-consumer-1707

Most of the console-consumer groups were used by me (triple checked in the logs) except this one afaics:

elukey@logstash1012:~$ kafka-consumer-groups --group console-consumer-75962 --describe  --bootstrap-server localhost:9092
Note: This will not show information about old Zookeeper-based consumers.
Consumer group 'console-consumer-75962' has no active members.

TOPIC              PARTITION  CURRENT-OFFSET  LOG-END-OFFSET  LAG             CONSUMER-ID     HOST            CLIENT-ID
__consumer_offsets 0          0               0               0               -               -               -

There's not indication that it could have been active before so I'd not consider it. I am starting to think that either logstash-codfw or logstash spiked for some time and got back on track when the reset happened on 16/04.

To summarize: what I would do is closing this task and re-open if any increase in traffic is noticed. At that point we'll be able to quickly check what it is going on, and debug further.

fgiunchedi claimed this task.

To summarize: what I would do is closing this task and re-open if any increase in traffic is noticed. At that point we'll be able to quickly check what it is going on, and debug further.

I agree, let's do it!

Reopening since traffic to consumer-offsets has doubled last night after T230847: Logstash missing most messages from mediawiki (Aug 2019) :( most of the messages seem to be handled by logstash1010

2019-08-21-105955_2368x884_scrot.png (884×2 px, 247 KB)

Resolving again as this seems to have gone away on Sept 13th, cause still unclear to me though

2019-09-30-200311_816x790_scrot.png (790×816 px, 44 KB)