Create an updated visualization of pageviews and interactions for inclusion in the Q2-3 2018-19 Audiences Metrics and Insights Presentation.
Notes:
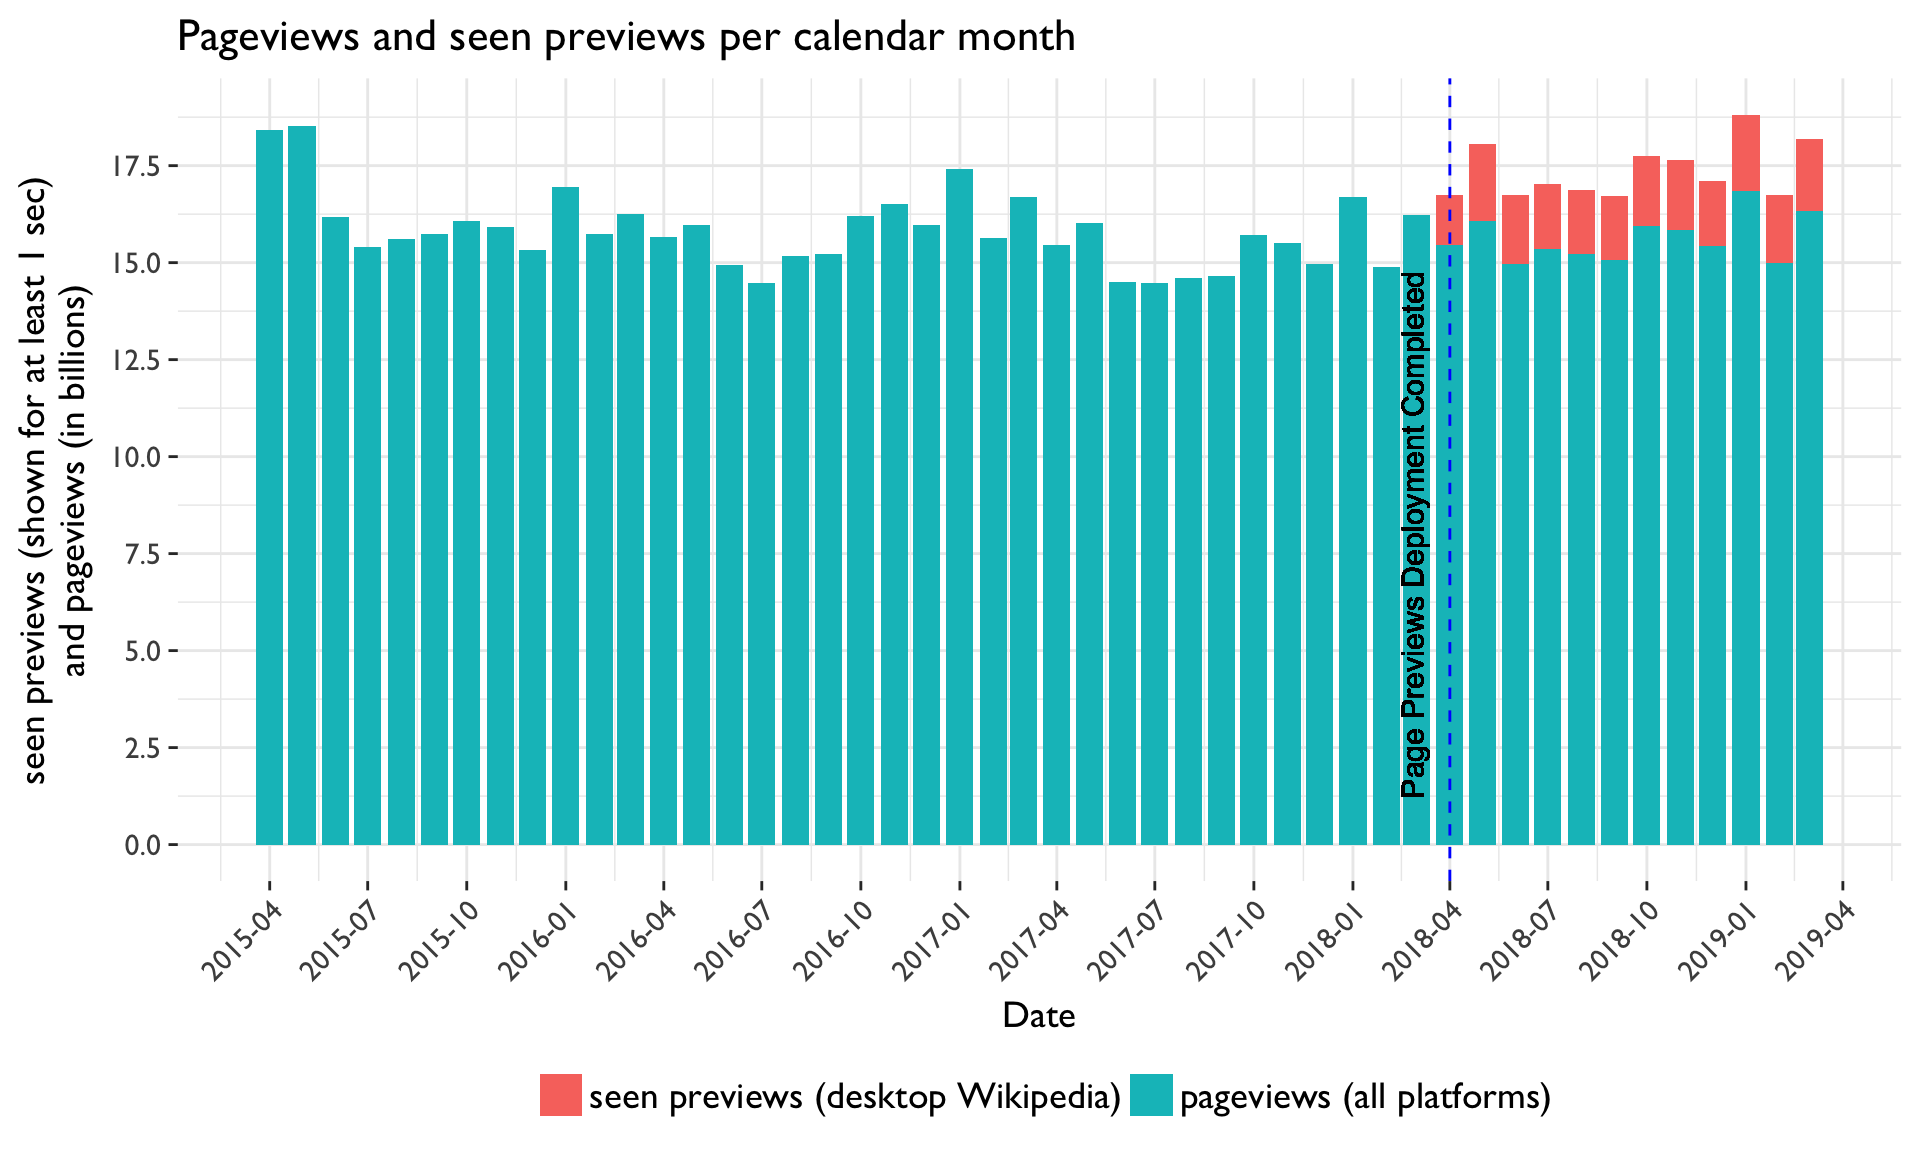
- Show data from the past 4 years through Feb 2019
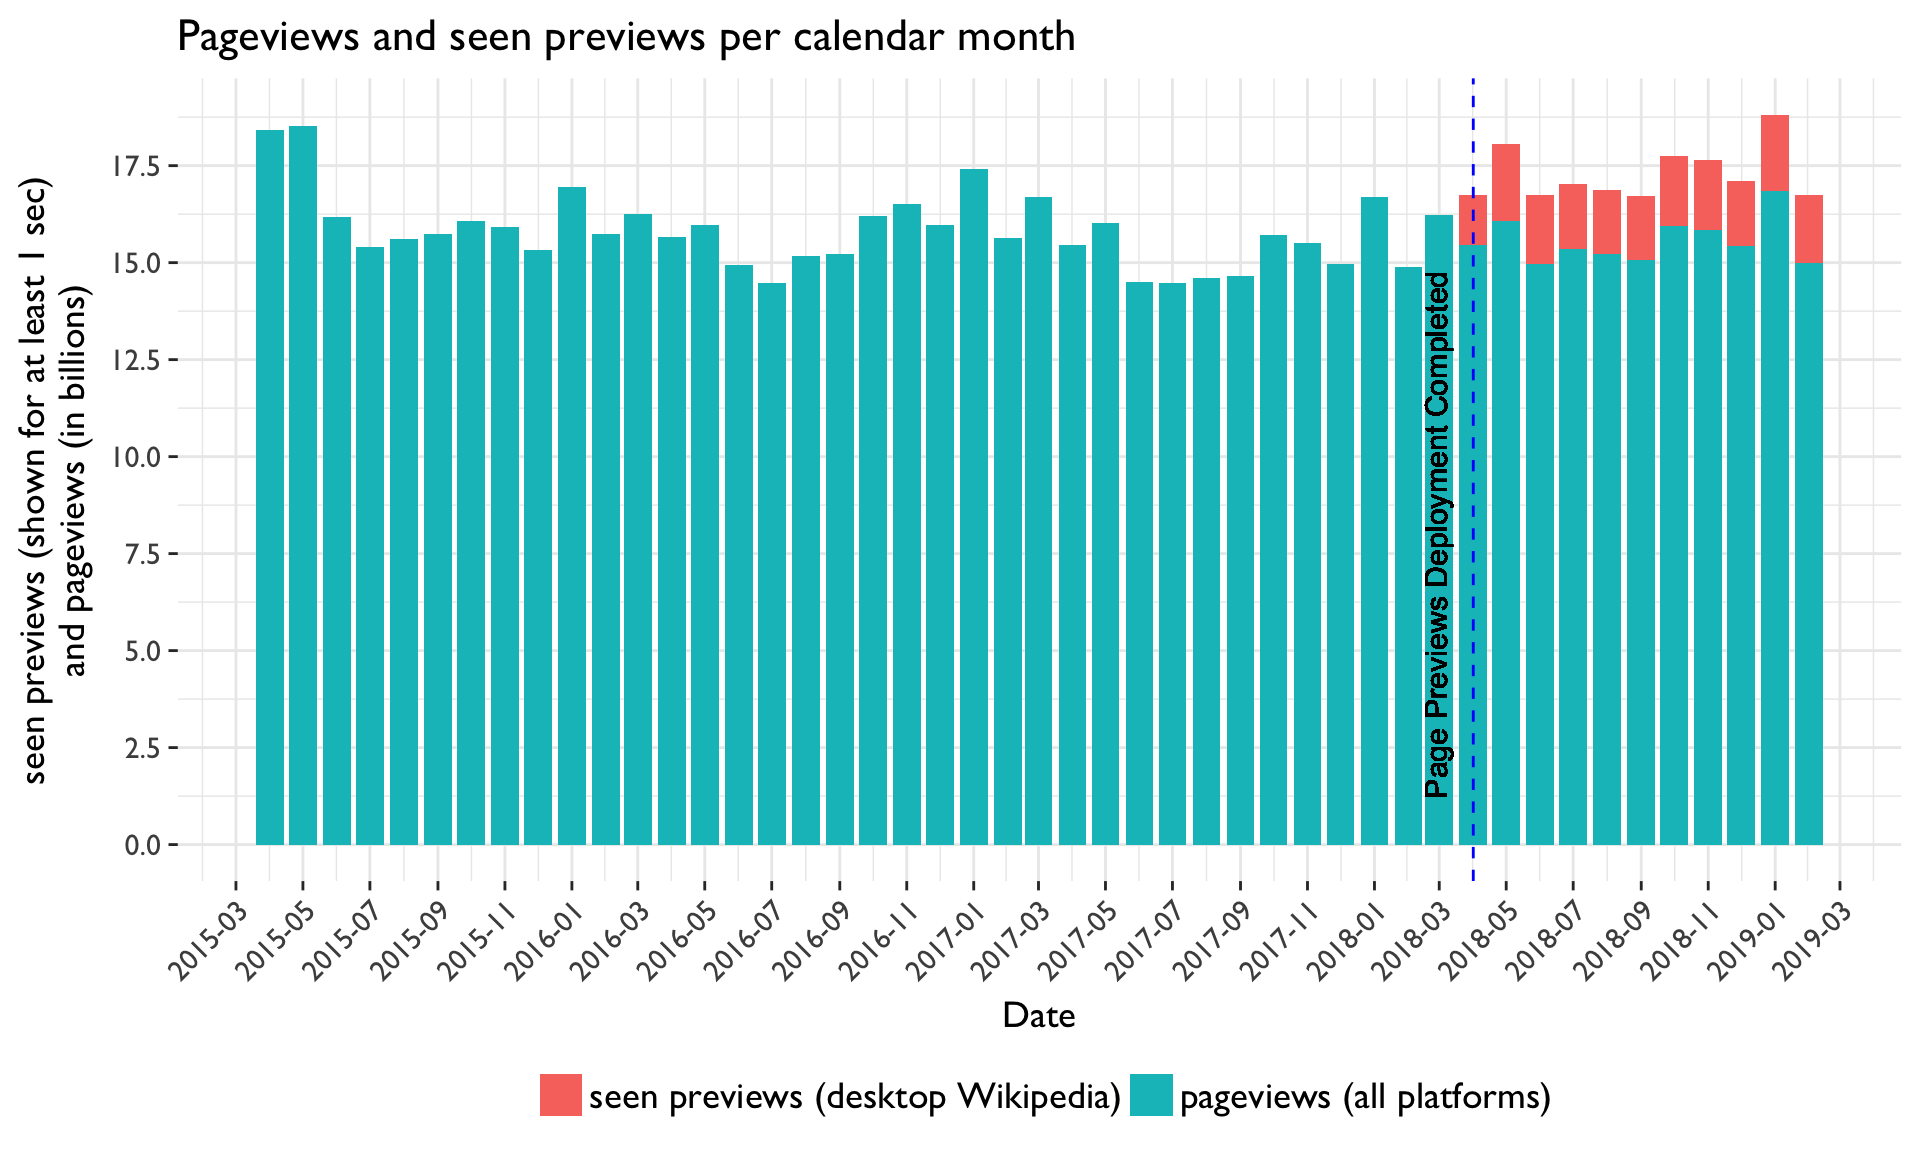
- Use stacked bar chart
Refer to previous presentation for past visualizations and data.