I've noticed a weird amount of request on cp5007 ats-be instance compared to ats-tls. ats-be is reporting ~8k rps while ats-tls is only reporting around ~3k rps. A quick check on the graph "Varnish backend Sessions accepted" shows that is happening for every text node on the text cluster on eqsin. After a quick check with varnishtop, it looks like the culprit are requests against http://varnishcheck/check.
Currently varnish-frontend on cp5008-5012 is generating around ~1.5-1.7k rps requests against http//varnishcheck/check:
timeout 1 varnishncsa -q "ReqUrl ~ check" > check.log
vgutierrez@cp5008:~$ cut -f1 -d' ' check.log |sort |uniq -c |sort -rn
   1778 10.132.0.112
   1727 10.132.0.108
   1684 10.132.0.111
   1573 10.132.0.109
   1560 10.132.0.110
     30 10.132.0.107
This traffic is triggered by the varnish probe configured here:
probe varnish {
	.request =
		"GET /check HTTP/1.1"
		"Host: varnishcheck"
		"User-agent: Varnish backend check"
		"Connection: close";
	.timeout = <%= @vcl_config.fetch('varnish_probe_ms') %>ms;
	.interval = 100ms;
	.window = 5;
	.threshold = 3;
}
As a quick test I've restarted varnish-frontend on cp5008 at 03:35 UTC, that dropped the amount of requests on the backend layer from 8k rps to 6.5krps:
vgutierrez@cp5008:~$ timeout 1 varnishncsa -q "ReqUrl ~ check" > check-after-restart.log
vgutierrez@cp5008:~$ cut -f1 -d' ' check-after-restart.log |sort |uniq -c |sort -rn
1770 10.132.0.112
1667 10.132.0.111
1587 10.132.0.110
1574 10.132.0.109
30 10.132.0.107
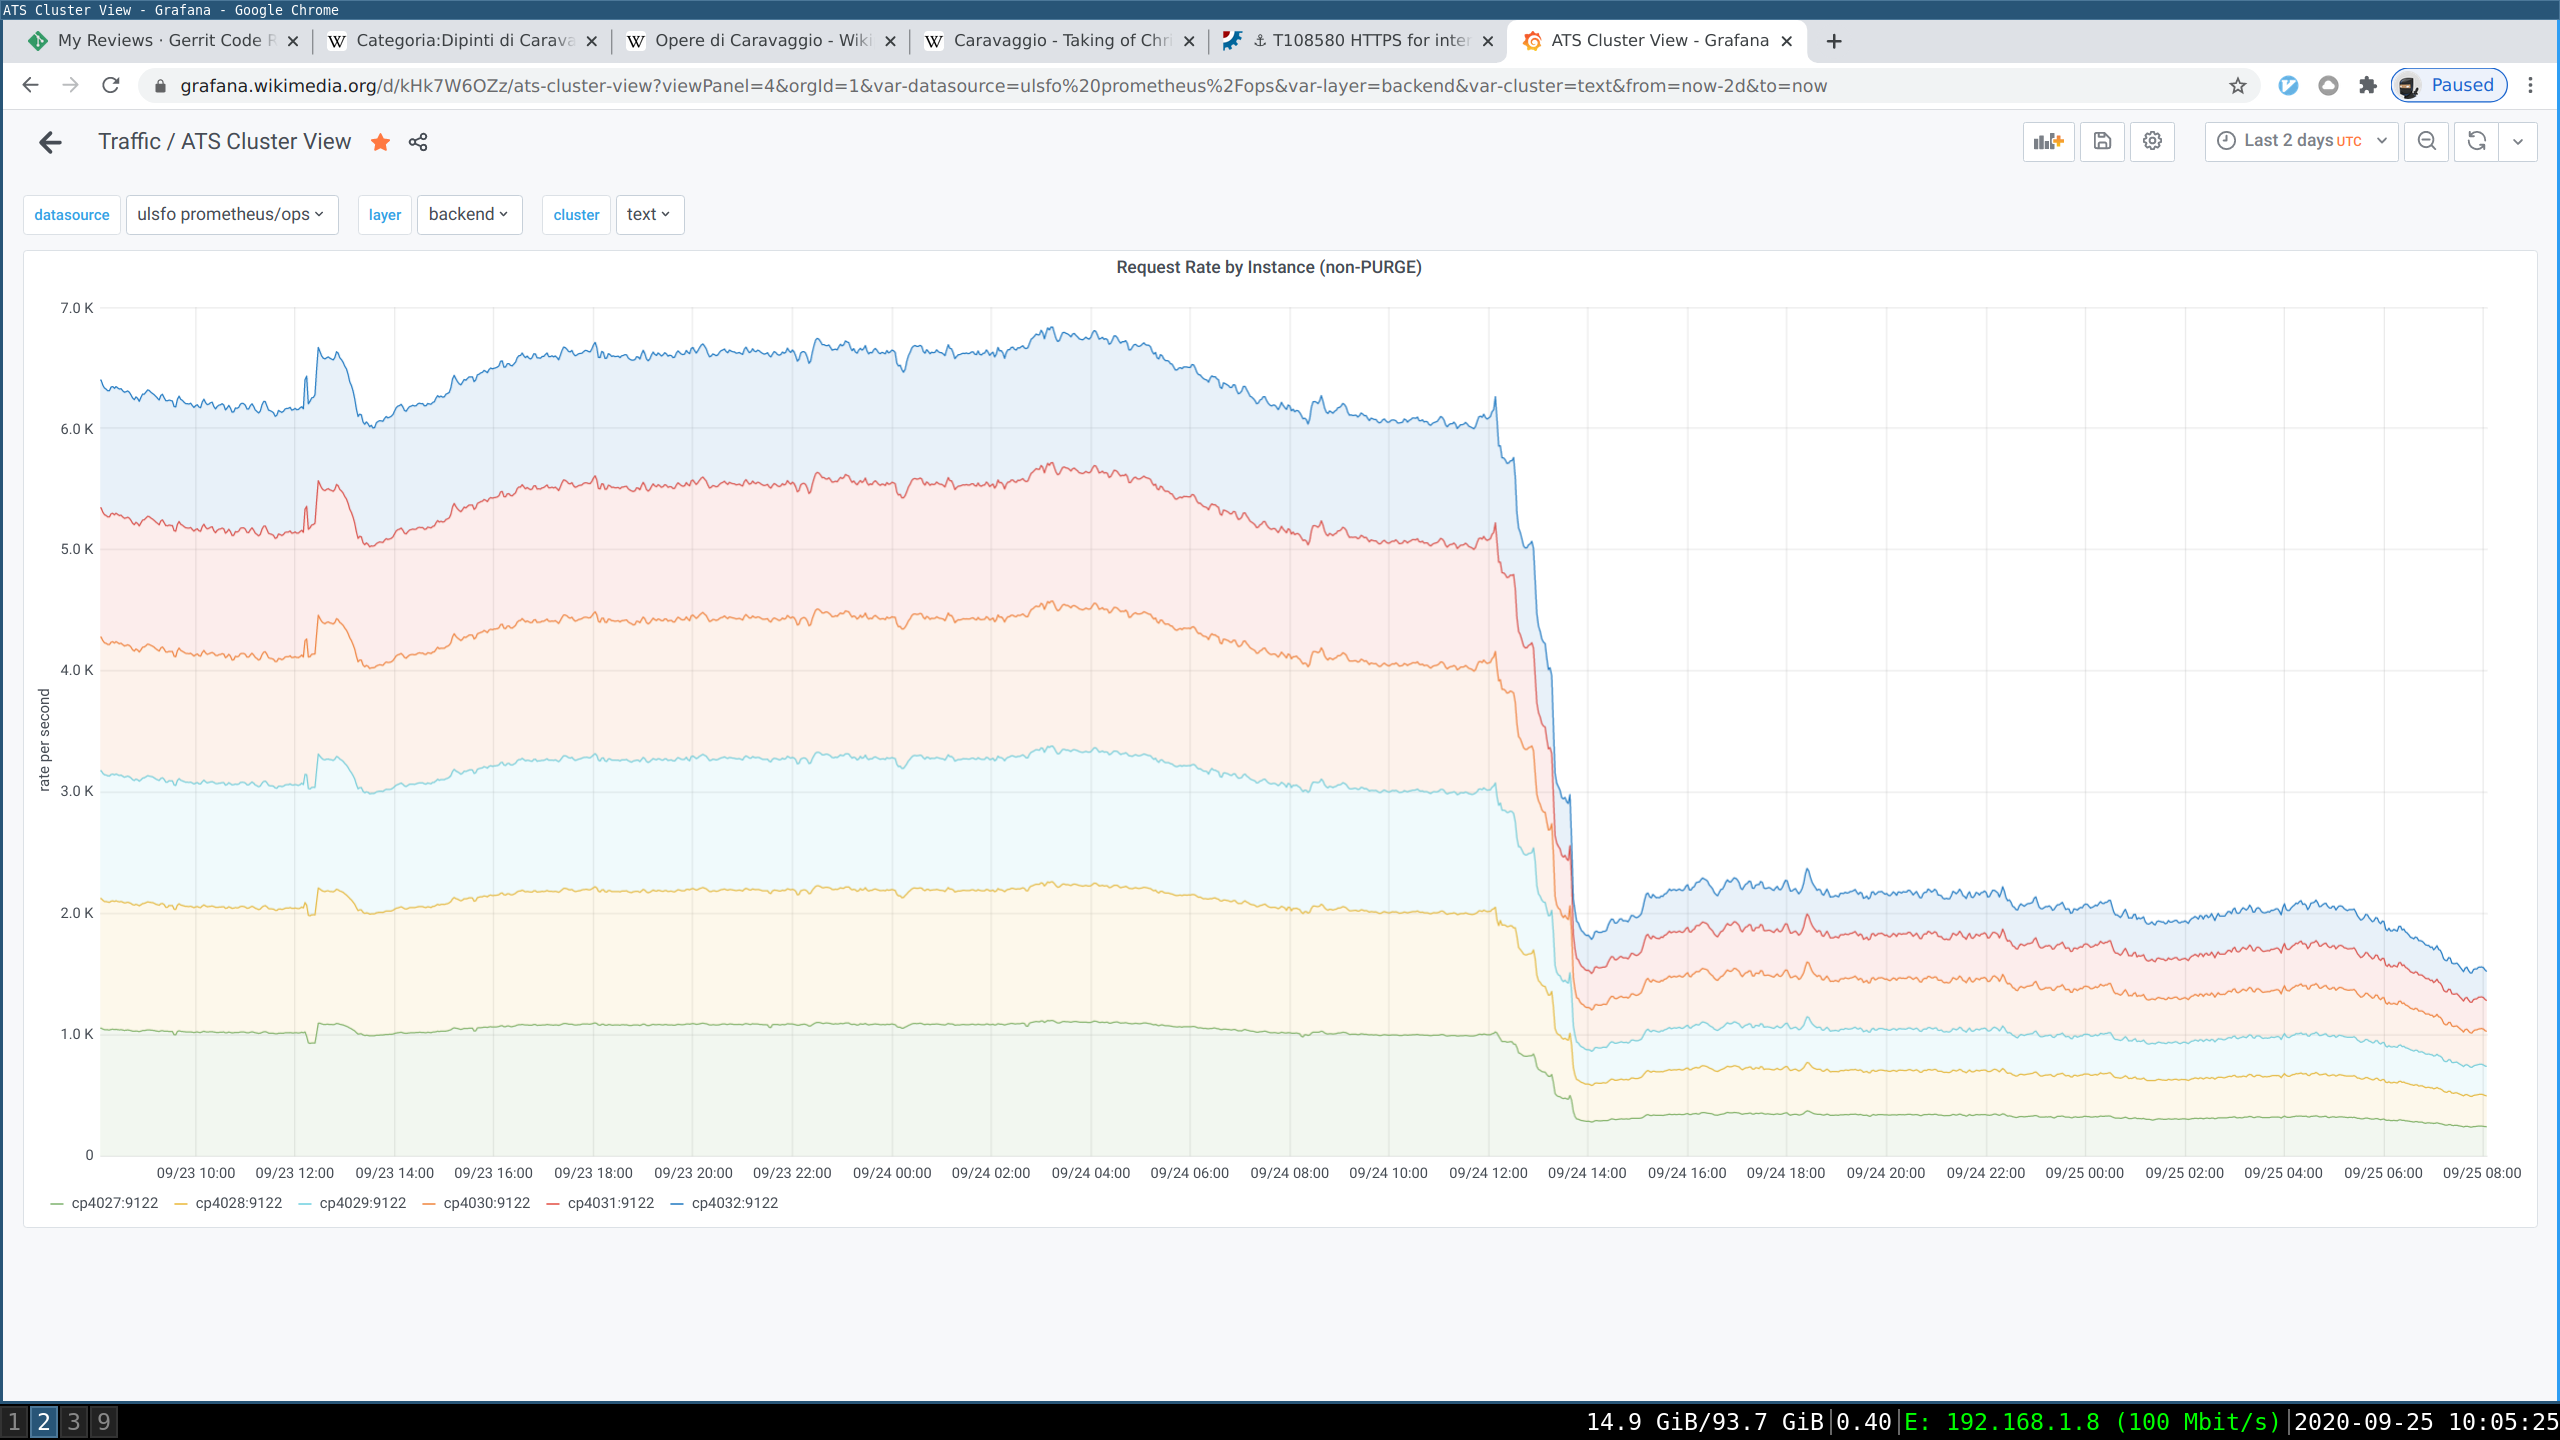
20 10.132.0.108A quick check on grafana shows that the other DCs are also affected by this varnish-fe behaviour on the text cluster