Page MenuHomePhabricator

dbtree slowdown 2020-08-20
Closed, ResolvedPublic

Description

A bit after midnight, dmonitor1001 HTTPS alert for dbtree sent:

[00:10:30] <icinga-wm>	 PROBLEM - HTTPS-dbtree on dbmonitor1001 is CRITICAL: CRITICAL - Socket timeout after 10 seconds https://wikitech.wikimedia.org/wiki/Dbtree.wikimedia.org
[00:19:40] <mutante>	 dbtree works for me. expecting recovery.

But it didn't recover, after several hours, the alerts is ongoing.

Checking what the alerts is exactly (which took a bit to figure out):

[09:45] <jynus> the check does from icinga host: sudo -u nagios /usr/lib/nagios/plugins/check_http -H dbtree.wikimedia.org --ssl --sni -I dbmonitor1001.wikimedia.org -u https://dbtree.wikimedia.org
[09:45] <jynus> and curl tells me it takes just over 10 seconds

Checking graphs for dbmonitor1001, I saw some strange network behaviour around 0h, which led me to check the database db1115. There is clear a pattern change after 0h: https://grafana.wikimedia.org/d/000000273/mysql?orgId=1&var-server=db1115&var-port=9104&from=1597868777860&to=1597911977860

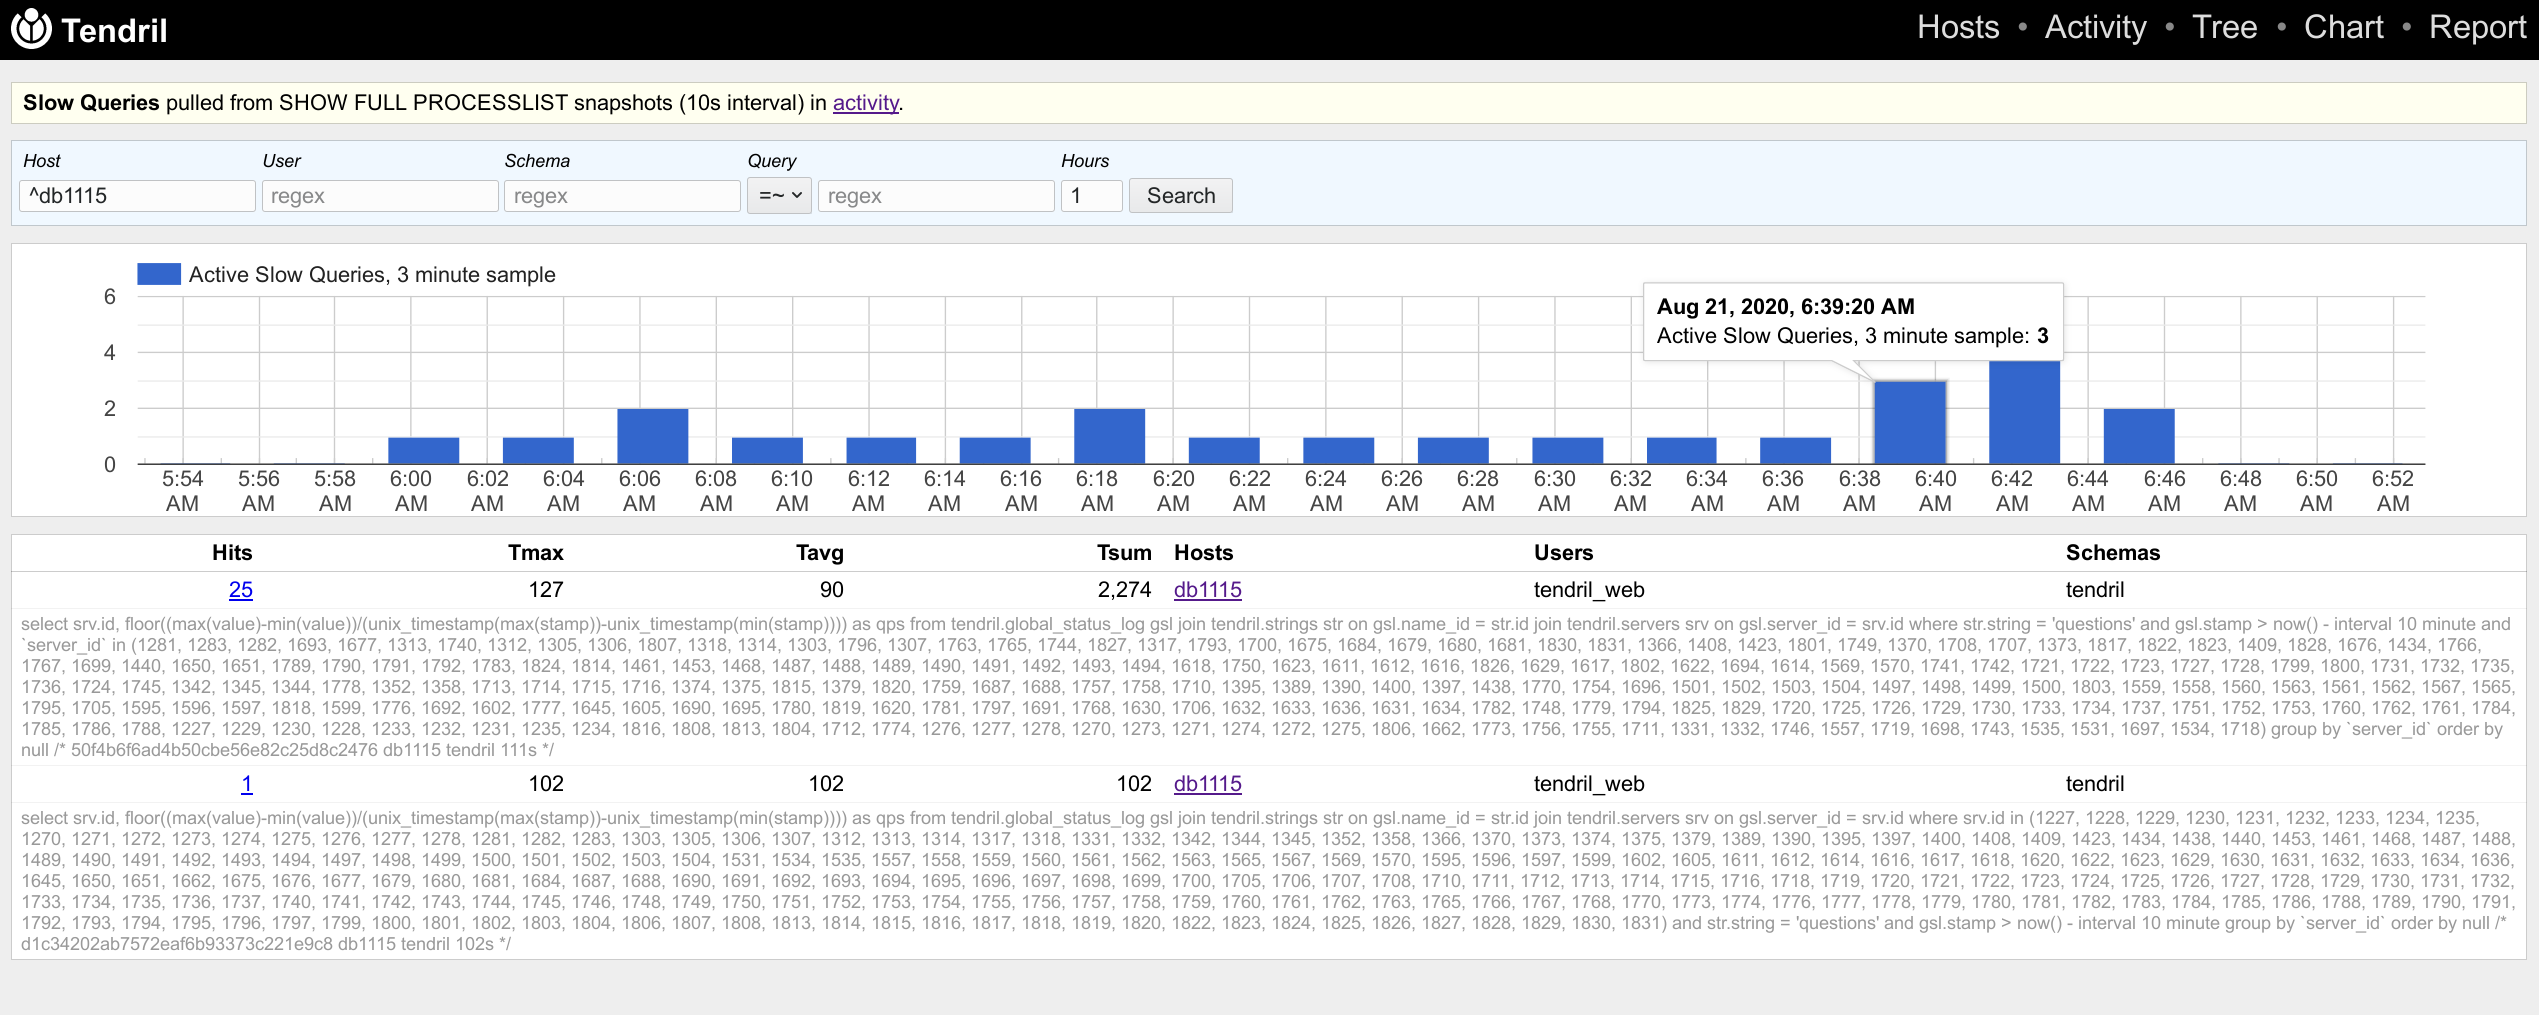
After following a few false clues (cron/event schedulers) I noticed a quert misbehaving on tendril, taking an average of 11 seconds- which is suspiciously similar to the webrequest latency, and starting around the same timeframe:

tendril_slowdown.png (376×1 px, 37 KB)

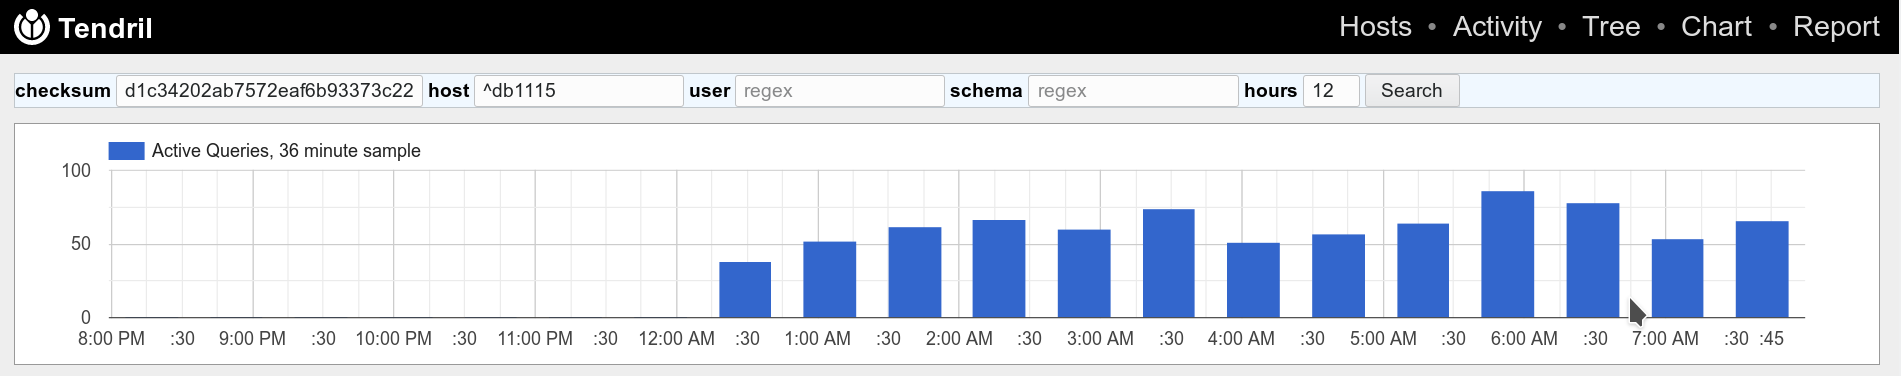
Hits 	Tmax 	Tavg 	Tsum 	Hosts 	Users 	Schemas
880	152	11	10,246	db1115	tendril_web	tendril
select srv.id, floor((max(value)-min(value))/(unix_timestamp(max(stamp))-unix_timestamp(min(stamp)))) as qps from tendril.global_status_log gsl join tendril.strings str on gsl.name_id = str.id join tendril.servers srv on gsl.server_id = srv.id where srv.id in (1227, 1228, 1229, 1230, 1231, 1232, 1233, 1234, 1235, 1270, 1271, 1272, 1273, 1274, 1275, 1276, 1277, 1278, 1281, 1282, 1283, 1303, 1305, 1306, 1307, 1312, 1313, 1314, 1317, 1318, 1342, 1344, 1345, 1352, 1358, 1366, 1370, 1373, 1374, 1375, 1379, 1389, 1390, 1395, 1397, 1400, 1408, 1409, 1423, 1434, 1438, 1440, 1453, 1461, 1468, 1487, 1488, 1489, 1490, 1491, 1492, 1493, 1494, 1497, 1498, 1499, 1500, 1501, 1502, 1503, 1504, 1531, 1534, 1535, 1558, 1559, 1560, 1561, 1562, 1563, 1565, 1567, 1569, 1570, 1595, 1596, 1597, 1599, 1602, 1605, 1611, 1612, 1614, 1616, 1617, 1618, 1620, 1622, 1623, 1629, 1630, 1631, 1632, 1633, 1634, 1636, 1645, 1650, 1651, 1662, 1675, 1676, 1677, 1679, 1680, 1681, 1684, 1687, 1688, 1690, 1691, 1692, 1693, 1694, 1695, 1696, 1697, 1698, 1699, 1700, 1705, 1706, 1707, 1708, 1710, 1711, 1712, 1713, 1714, 1715, 1716, 1718, 1719, 1720, 1721, 1722, 1723, 1724, 1725, 1726, 1727, 1728, 1729, 1730, 1731, 1732, 1733, 1734, 1735, 1736, 1737, 1740, 1741, 1742, 1743, 1744, 1745, 1748, 1749, 1750, 1754, 1755, 1756, 1757, 1758, 1759, 1763, 1765, 1766, 1767, 1768, 1770, 1773, 1774, 1776, 1777, 1778, 1779, 1780, 1781, 1782, 1783, 1789, 1790, 1791, 1792, 1793, 1794, 1795, 1796, 1797, 1799, 1800, 1801, 1802, 1803, 1804, 1806, 1807, 1808, 1813, 1814, 1815, 1816, 1817, 1818, 1819, 1820, 1822, 1823, 1824, 1825, 1826, 1827, 1828, 1829, 1830, 1831) and str.string = 'questions' and gsl.stamp > now() - interval 10 minute group by `server_id` order by null /* d1c34202ab7572eaf6b93373c221e9c8 db1115 tendril 41s */
33	12	6	216	db1115	tendril_web	tendril
select srv.id, floor((max(value)-min(value))/(unix_timestamp(max(stamp))-unix_timestamp(min(stamp)))) as qps from tendril.global_status_log gsl join tendril.strings str on gsl.name_id = str.id join tendril.servers srv on gsl.server_id = srv.id where str.string = 'questions' and gsl.stamp > now() - interval 10 minute and `server_id` in (1281, 1283, 1282, 1693, 1677, 1313, 1740, 1312, 1305, 1306, 1807, 1318, 1314, 1303, 1796, 1307, 1763, 1765, 1744, 1827, 1317, 1793, 1700, 1675, 1684, 1679, 1680, 1681, 1830, 1831, 1366, 1408, 1423, 1801, 1749, 1370, 1708, 1707, 1373, 1817, 1822, 1823, 1409, 1828, 1676, 1434, 1766, 1767, 1699, 1440, 1650, 1651, 1789, 1790, 1791, 1792, 1783, 1824, 1814, 1461, 1453, 1468, 1487, 1488, 1489, 1490, 1491, 1492, 1493, 1494, 1618, 1750, 1623, 1611, 1612, 1616, 1826, 1629, 1617, 1802, 1622, 1694, 1614, 1569, 1570, 1741, 1742, 1721, 1722, 1723, 1727, 1728, 1799, 1800, 1731, 1732, 1735, 1736, 1724, 1745, 1342, 1345, 1344, 1778, 1352, 1358, 1713, 1714, 1715, 1716, 1374, 1375, 1815, 1379, 1820, 1759, 1687, 1688, 1757, 1758, 1710, 1395, 1389, 1390, 1400, 1397, 1438, 1770, 1754, 1696, 1501, 1502, 1503, 1504, 1497, 1498, 1499, 1500, 1803, 1559, 1558, 1560, 1563, 1561, 1562, 1567, 1565, 1795, 1705, 1595, 1596, 1597, 1818, 1599, 1776, 1692, 1602, 1777, 1645, 1605, 1690, 1695, 1780, 1819, 1620, 1781, 1797, 1691, 1768, 1630, 1706, 1632, 1633, 1636, 1631, 1634, 1782, 1748, 1779, 1794, 1825, 1829, 1720, 1725, 1726, 1729, 1730, 1733, 1734, 1737, 1751, 1752, 1753, 1760, 1762, 1761, 1784, 1785, 1786, 1788, 1227, 1229, 1230, 1228, 1233, 1232, 1231, 1235, 1234, 1816, 1808, 1813, 1804, 1712, 1774, 1276, 1277, 1278, 1270, 1273, 1271, 1274, 1272, 1275, 1806, 1662, 1773, 1756, 1755, 1711, 1331, 1332, 1746, 1557, 1719, 1698, 1743, 1535, 1531, 1697, 1534, 1718) group by `server_id` order by null /* 50f4b6f6ad4b50cbe56e82c25d8c2476 db1115 tendril 5s */

Event Timeline

query plan
root@db1115[tendril]> EXPLAIN select srv.id ...
*************************** 1. row ***************************
           id: 1
  select_type: SIMPLE
        table: str
         type: const
possible_keys: PRIMARY,name
          key: name
      key_len: 66
          ref: const
         rows: 1
        Extra: Using index; Using temporary
*************************** 2. row ***************************
           id: 1
  select_type: SIMPLE
        table: srv
         type: index
possible_keys: PRIMARY
          key: m_server_id
      key_len: 5
          ref: NULL
         rows: 242
        Extra: Using where; Using index
*************************** 3. row ***************************
           id: 1
  select_type: SIMPLE
        table: gsl
         type: range
possible_keys: PRIMARY,stamp,server_stamp
          key: PRIMARY
      key_len: 16
          ref: NULL
         rows: 5596
        Extra: Using where; Using index; Using join buffer (flat, BNL join)
execution latency and stats
root@db1115[tendril]> flush status;
Query OK, 0 rows affected (0.02 sec)

root@db1115[tendril]> select srv.id, ...
228 rows in set (11.13 sec)

root@db1115[tendril]> show status like 'Hand%';
+----------------------------+-------+
| Variable_name              | Value |
+----------------------------+-------+
| Handler_commit             | 2     |
| Handler_delete             | 0     |
| Handler_discover           | 0     |
| Handler_external_lock      | 0     |
| Handler_icp_attempts       | 0     |
| Handler_icp_match          | 0     |
| Handler_mrr_init           | 0     |
| Handler_mrr_key_refills    | 0     |
| Handler_mrr_rowid_refills  | 0     |
| Handler_prepare            | 0     |
| Handler_read_first         | 1     |
| Handler_read_key           | 5230  |
| Handler_read_last          | 0     |
| Handler_read_next          | 4787  |
| Handler_read_prev          | 0     |
| Handler_read_retry         | 0     |
| Handler_read_rnd           | 0     |
| Handler_read_rnd_deleted   | 0     |
| Handler_read_rnd_next      | 229   |
| Handler_rollback           | 0     |
| Handler_savepoint          | 0     |
| Handler_savepoint_rollback | 0     |
| Handler_tmp_update         | 4317  |
| Handler_tmp_write          | 228   |
| Handler_update             | 0     |
| Handler_write              | 0     |
+----------------------------+-------+
26 rows in set (0.00 sec)

Mentioned in SAL (#wikimedia-operations) [2020-08-20T08:44:52Z] <jynus> running analyze table on db1115's tendril.global_status_log, may case some stalls on tendril/dbtree T260876

I believe this is what happened, after further investigation:

  1. 2160c63c8bd7f66c73d639 (for T252331) and related was deployed, increasing the purge rate of global_status_log table
  2. 3 months later, after enough rows have been purged, and innodb stats are automatically refreshed, the qps query on the task head changes plan to not use that stamp index, going from 1+ seconds to 10+ seconds in execution time
  3. The query slows down both dbtree (on both dbtree and tendril domain) and well as /hosts and other views, reaching over the 10 second timeout

There is 2 options to fix this:

  • Add an index hint, something that is not possible with the current query abstraction api, and that will have to be added
  • Convince the optimizer that using the stamp index is the preferred metric (histograms?)

None are ideal in terms of effort to cleanness ratio, given current deprecation state of the tool.

Current plan:

+------+-------------+-------+-------+----------------------------+-------------+---------+-------+------+--------------
| id   | select_type | table | type  | possible_keys              | key         | key_len | ref   | rows | Extra        
+------+-------------+-------+-------+----------------------------+-------------+---------+-------+------+--------------
|    1 | SIMPLE      | str   | const | PRIMARY,name               | name        | 66      | const |    1 | Using index; 
|    1 | SIMPLE      | srv   | index | PRIMARY                    | m_server_id | 5       | NULL  |  242 | Using where; 
|    1 | SIMPLE      | gsl   | range | PRIMARY,stamp,server_stamp | PRIMARY     | 16      | NULL  | 4869 | Using where; 
+------+-------------+-------+-------+----------------------------+-------------+---------+-------+------+--------------
3 rows in set (0.04 sec)

+----------------------------+-------+
| Variable_name              | Value |
+----------------------------+-------+
| Handler_commit             | 2     |
| Handler_delete             | 0     |
| Handler_discover           | 0     |
| Handler_external_lock      | 0     |
| Handler_icp_attempts       | 0     |
| Handler_icp_match          | 0     |
| Handler_mrr_init           | 0     |
| Handler_mrr_key_refills    | 0     |
| Handler_mrr_rowid_refills  | 0     |
| Handler_prepare            | 0     |
| Handler_read_first         | 1     |
| Handler_read_key           | 5245  |
| Handler_read_last          | 0     |
| Handler_read_next          | 4802  |
| Handler_read_prev          | 0     |
| Handler_read_retry         | 0     |
| Handler_read_rnd           | 0     |
| Handler_read_rnd_deleted   | 0     |
| Handler_read_rnd_next      | 229   |
| Handler_rollback           | 0     |
| Handler_savepoint          | 0     |
| Handler_savepoint_rollback | 0     |
| Handler_tmp_update         | 4332  |
| Handler_tmp_write          | 228   |
| Handler_update             | 0     |
| Handler_write              | 0     |
+----------------------------+-------+

Faster plan (despite explain showing more rows):

+------+-------------+-------+--------+---------------+---------+---------+-----------------------+---------+-----------
| id   | select_type | table | type   | possible_keys | key     | key_len | ref                   | rows    | Extra     
+------+-------------+-------+--------+---------------+---------+---------+-----------------------+---------+-----------
|    1 | SIMPLE      | str   | const  | PRIMARY,name  | name    | 66      | const                 |       1 | Using inde
|    1 | SIMPLE      | gsl   | range  | stamp         | stamp   | 8       | NULL                  | 1009715 | Using wher
|    1 | SIMPLE      | srv   | eq_ref | PRIMARY       | PRIMARY | 4       | tendril.gsl.server_id |       1 | Using inde
+------+-------------+-------+--------+---------------+---------+---------+-----------------------+---------+-----------
3 rows in set (0.00 sec)

+----------------------------+---------+
| Variable_name              | Value   |
+----------------------------+---------+
| Handler_commit             | 2       |
| Handler_delete             | 0       |
| Handler_discover           | 0       |
| Handler_external_lock      | 0       |
| Handler_icp_attempts       | 0       |
| Handler_icp_match          | 0       |
| Handler_mrr_init           | 0       |
| Handler_mrr_key_refills    | 0       |
| Handler_mrr_rowid_refills  | 0       |
| Handler_prepare            | 0       |
| Handler_read_first         | 0       |
| Handler_read_key           | 9108    |
| Handler_read_last          | 0       |
| Handler_read_next          | 2643223 |
| Handler_read_prev          | 0       |
| Handler_read_retry         | 0       |
| Handler_read_rnd           | 0       |
| Handler_read_rnd_deleted   | 0       |
| Handler_read_rnd_next      | 229     |
| Handler_rollback           | 0       |
| Handler_savepoint          | 0       |
| Handler_savepoint_rollback | 0       |
| Handler_tmp_update         | 4324    |
| Handler_tmp_write          | 228     |
| Handler_update             | 0       |
| Handler_write              | 0       |
+----------------------------+---------+

My guess is MySQL could be right to chose on its own on a faster storage medium/non-tokudb table?

Change 621529 had a related patch set uploaded (by Jcrespo; owner: Jcrespo):
[operations/software/dbtree@master] dbtree: Implement use_index parsing and apply it to QPS query

https://gerrit.wikimedia.org/r/621529

jcrespo triaged this task as Medium priority.Aug 20 2020, 3:00 PM

The above should patch fix the alert, please have a look for obvious security bugs. A similar patch has to be ported to tendril, for both the tree and other views.

Change 621529 merged by Jcrespo:
[operations/software/dbtree@master] dbtree: Implement use_index parsing and apply it to QPS query

https://gerrit.wikimedia.org/r/621529

The above patch "fixed" the alert, or at least it made the web request 10x faster (from 12 seconds to 0.272 s).

Now we need to apply an equivalent patch to tendril, as I can see both the tree and host views slow, too.

Change 621625 had a related patch set uploaded (by Jcrespo; owner: Jcrespo):
[operations/software/tendril@master] Port use_index implementation from dbtree to tendril and apply to tree

https://gerrit.wikimedia.org/r/621625

Manually applying this fix to tendril for /host and /tree too seems to get rid of long running queries on db1115:

Screenshot_20200821_085445.png (1×2 px, 197 KB)

The graphs are slow, but I am not sure if they were always have been like that?

I've just realized that the QPS shows 0 for all hosts, so this is not really a fix as much as we fail the query immediately. Debugging.

Change 621677 had a related patch set uploaded (by Jcrespo; owner: Jcrespo):
[operations/software/dbtree@master] use_index: Fix missing leading whitespace before USE

https://gerrit.wikimedia.org/r/621677

I had a few formatting errors, fixed on the latest upload.

Change 621677 merged by Jcrespo:
[operations/software/dbtree@master] use_index: Fix missing leading whitespace before USE and wrong argument

https://gerrit.wikimedia.org/r/621677

Change 621625 merged by Jcrespo:
[operations/software/tendril@master] Port use_index implementation from dbtree to tendril and apply to tree

https://gerrit.wikimedia.org/r/621625

@Kormat @Marostegui Please check tendril works normally (for some meaning of "normal"), and I will close this once the workaround has been deployed.

jcrespo claimed this task.

Thank you guys for debugging and fixing!