Page MenuHomePhabricator

Many Grafana dashboards had their queries nuked. Currently display "no data".
Closed, ResolvedPublic

Description

This happened at some point in the last 24 hours.

Some of the affected dashboards and panels I've spotted (I'm sure that there are many more):

https://grafana.wikimedia.org/d/000000551/performance-perception-survey?orgId=1
https://grafana.wikimedia.org/d/000000249/edit-stash?orgId=1
https://grafana-rw.wikimedia.org/d/000000208/edit-count?orgId=1&refresh=5m
https://grafana.wikimedia.org/d/000000085/save-timing?viewPanel=11&orgId=1
https://grafana.wikimedia.org/d/000000143/navigation-timing?viewPanel=12&orgId=1
https://grafana.wikimedia.org/d/000000002/api-backend-summary?orgId=1&refresh=5m

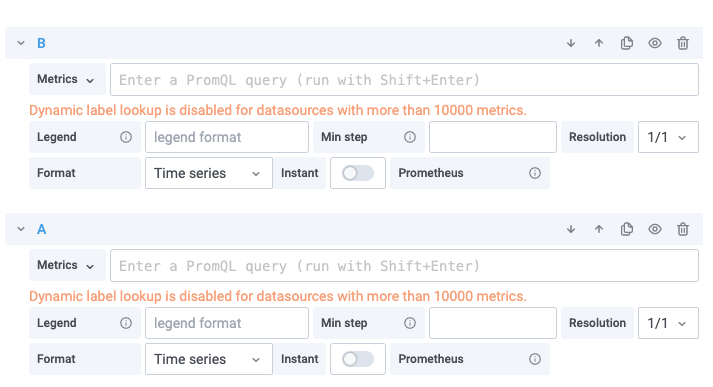
When you edit any of these panels that states "no data", you find that the queries have been emptied (or can't load, who knows):

Screenshot 2020-12-03 at 08.59.17.png (387×713 px, 56 KB)

The history shows that they haven't been touched recently:

Screenshot 2020-12-03 at 09.00.43.png (226×1 px, 33 KB)

Event Timeline

Gilles triaged this task as Unbreak Now! priority.Dec 3 2020, 8:06 AM

Likely this is due to the default datasource changing from Graphite to Thanos in https://gerrit.wikimedia.org/r/c/operations/puppet/+/644802 . I'll revert that change now.

Change 644970 had a related patch set uploaded (by Filippo Giunchedi; owner: Filippo Giunchedi):
[operations/puppet@production] Revert "grafana: set thanos as default datasource"

https://gerrit.wikimedia.org/r/644970

Change 644970 merged by Filippo Giunchedi:
[operations/puppet@production] Revert "grafana: set thanos as default datasource"

https://gerrit.wikimedia.org/r/644970