Page MenuHomePhabricator

Understand (and mitigate) the backup speed differences between backup1002->backup2002 and backup2002->backup1002
Closed, ResolvedPublic

Description

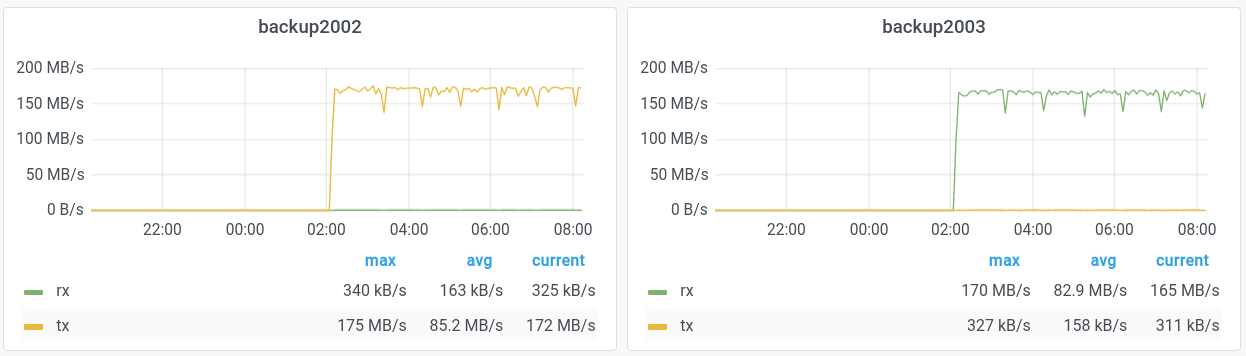
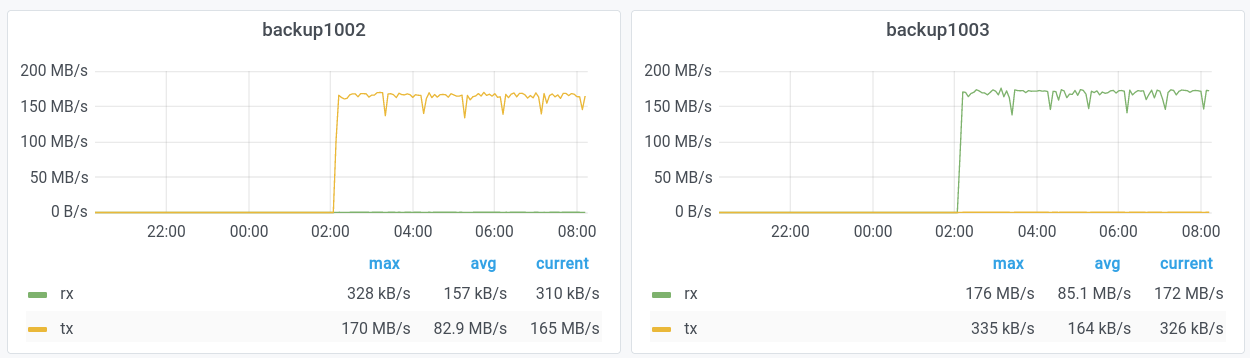
Backups in the codfw -> eqiad complete rather quickly.

305897  Full       5,561    3.078 T  OK       08-Feb-21 17:19 backup2002.codfw.wmnet-Monthly-1st-Wed-EsRwEqiad-mysql-srv-backups-dumps-latest

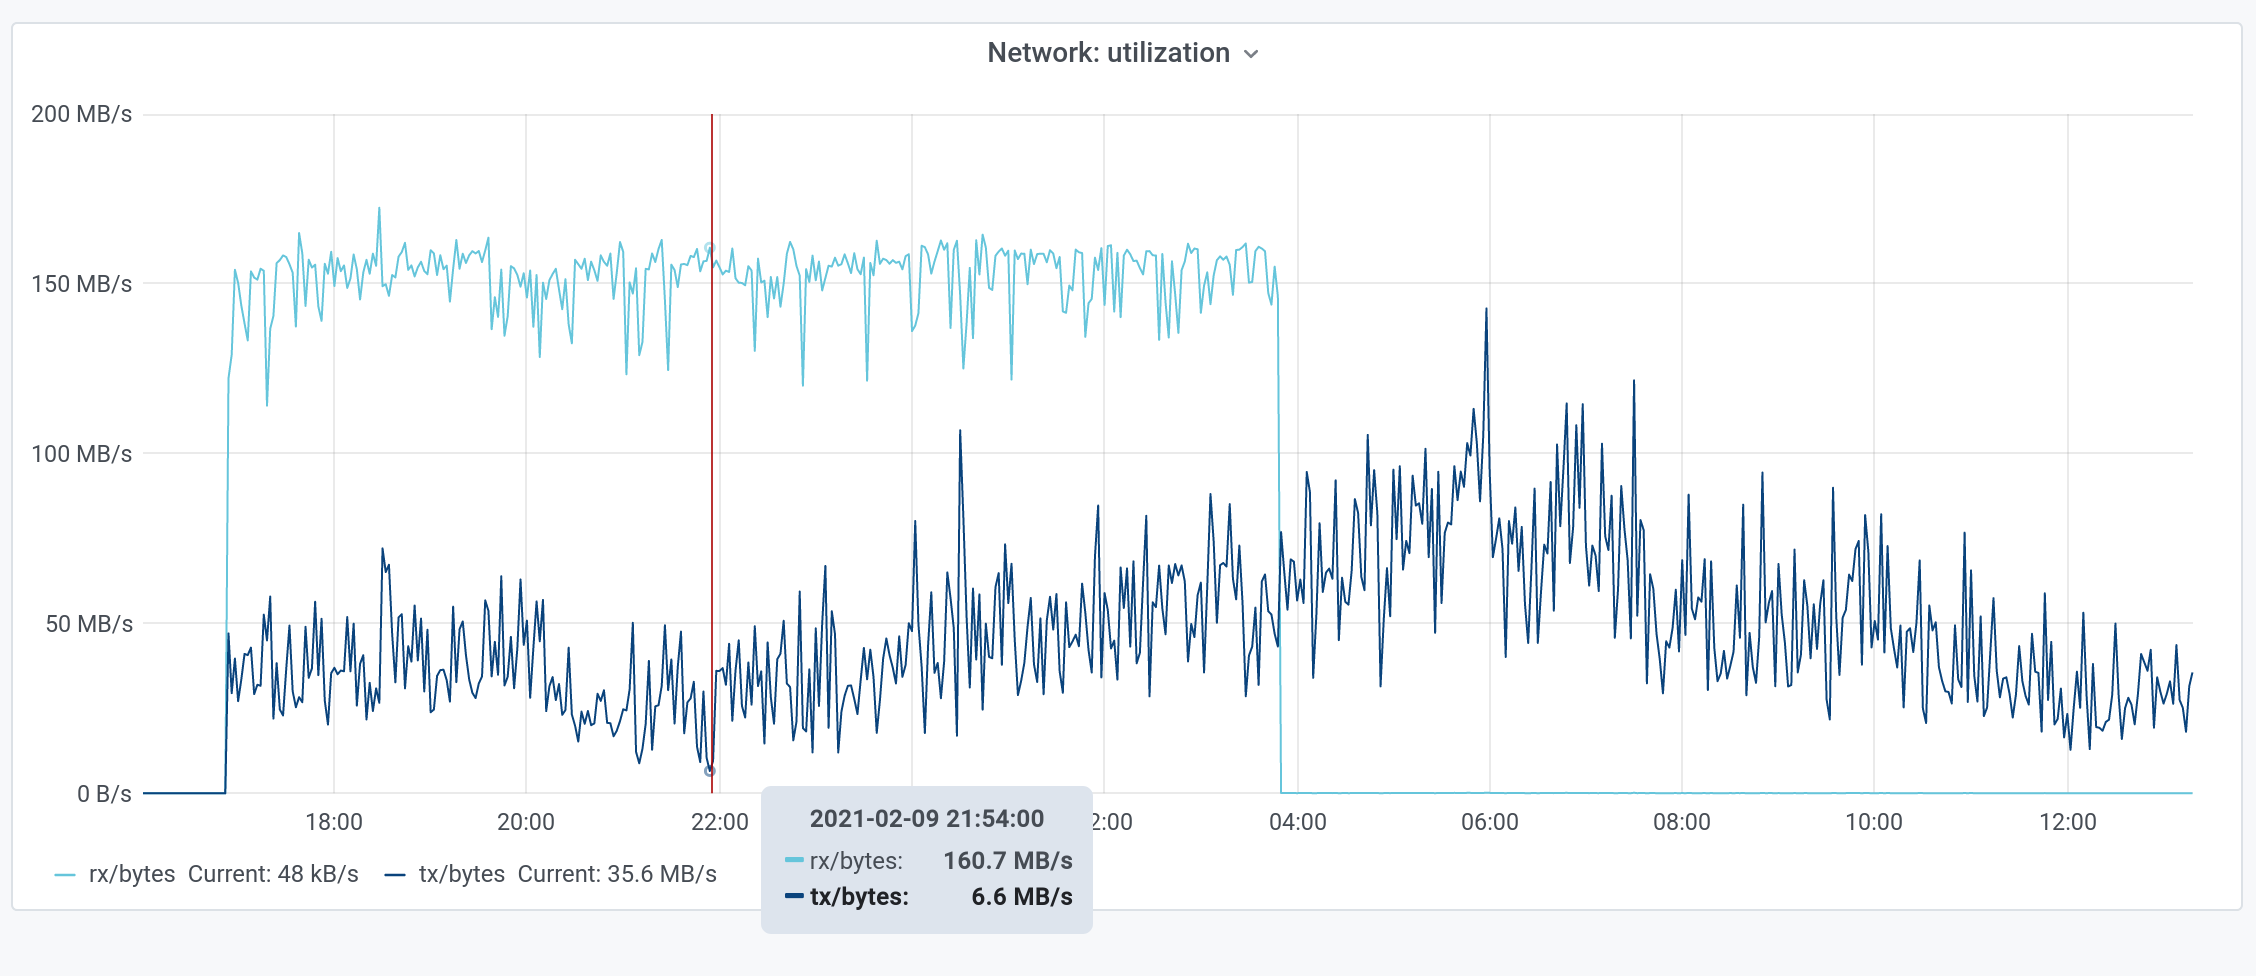
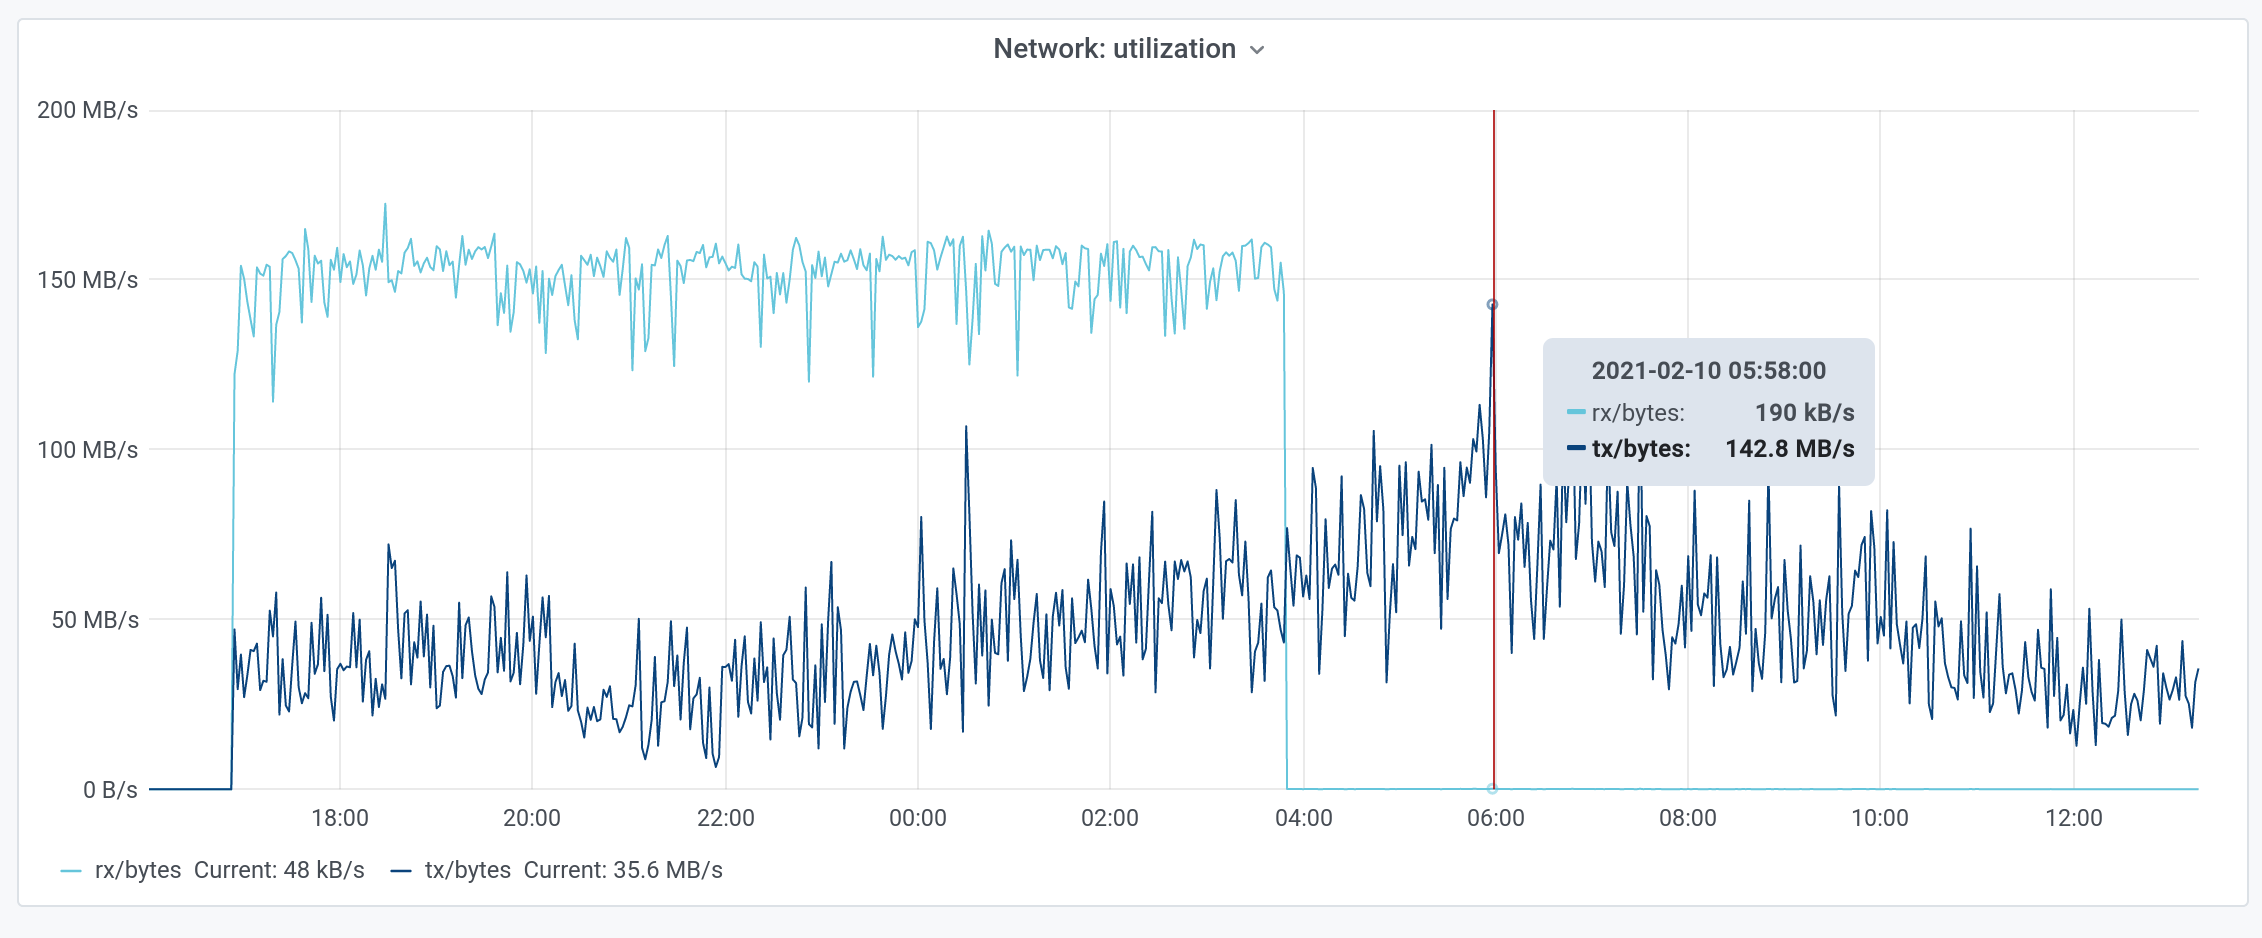
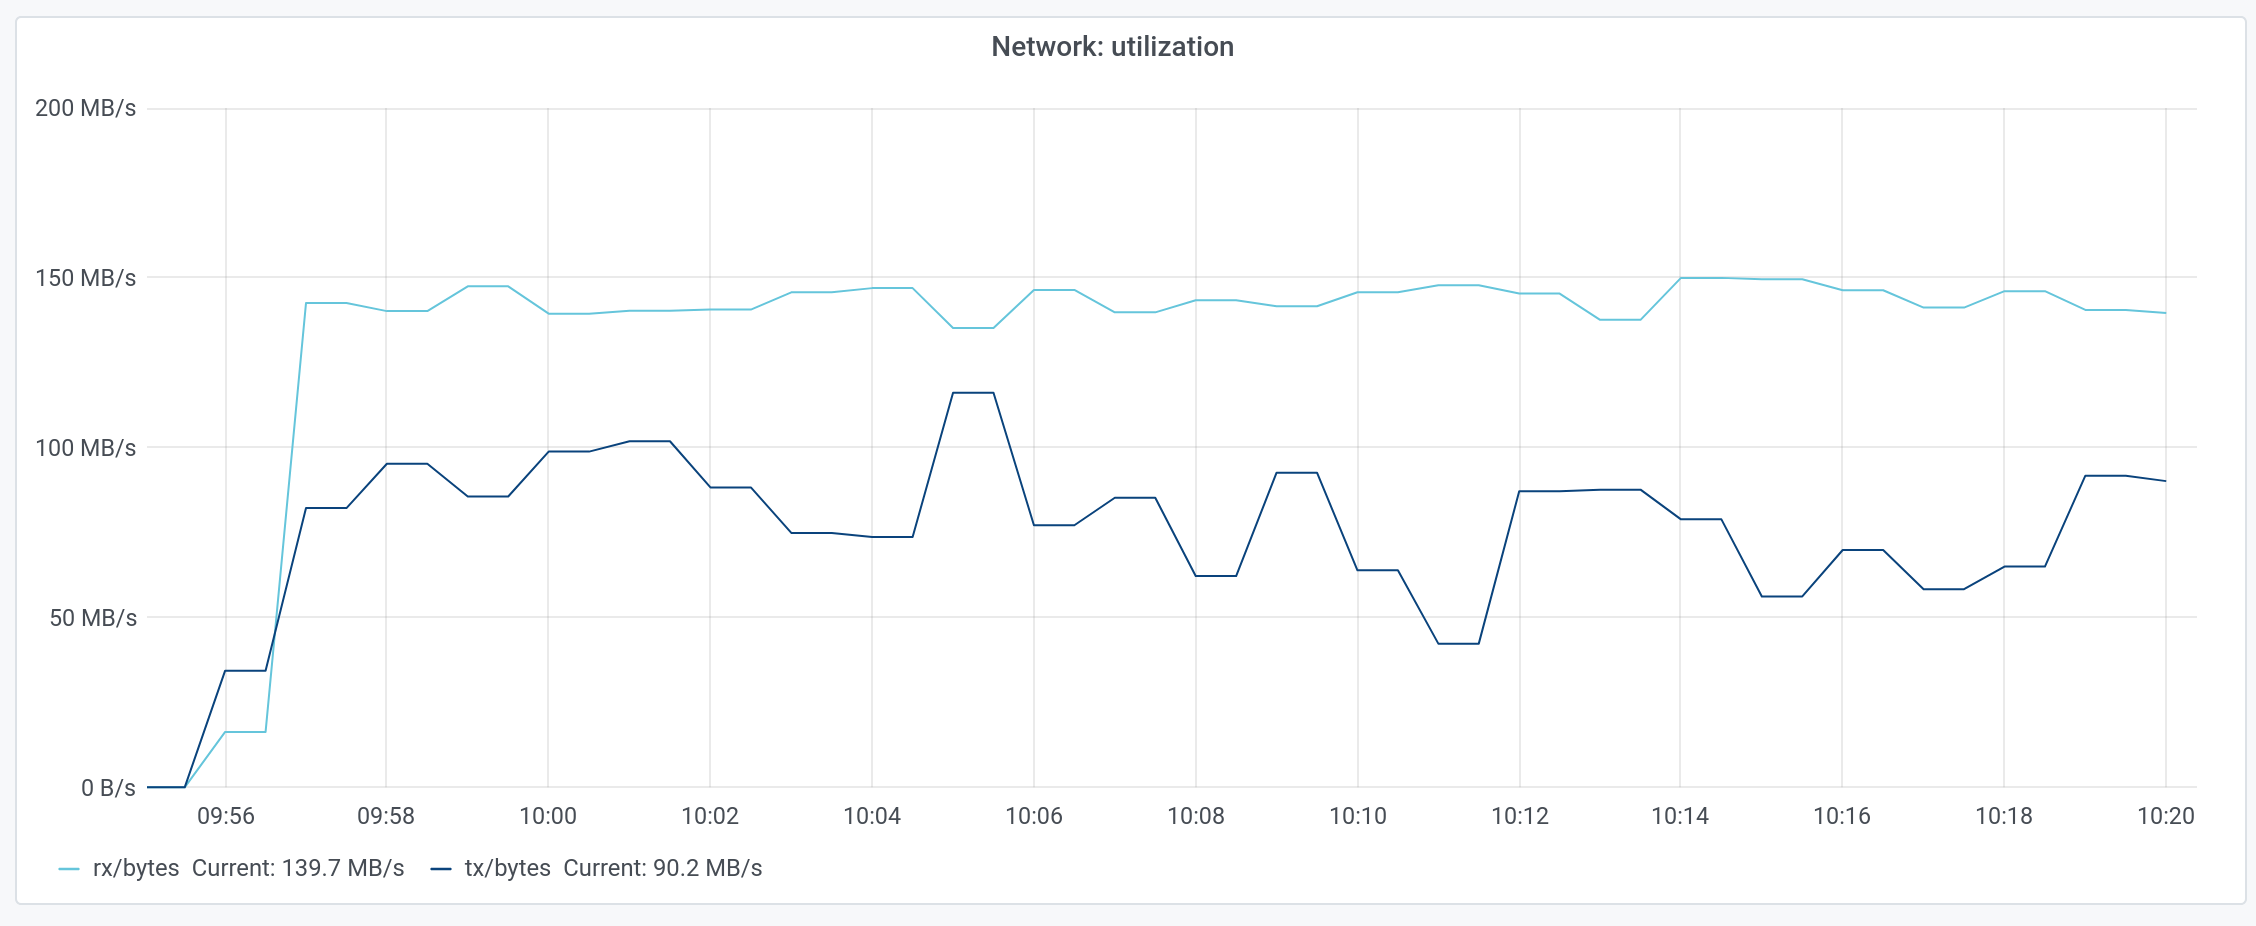
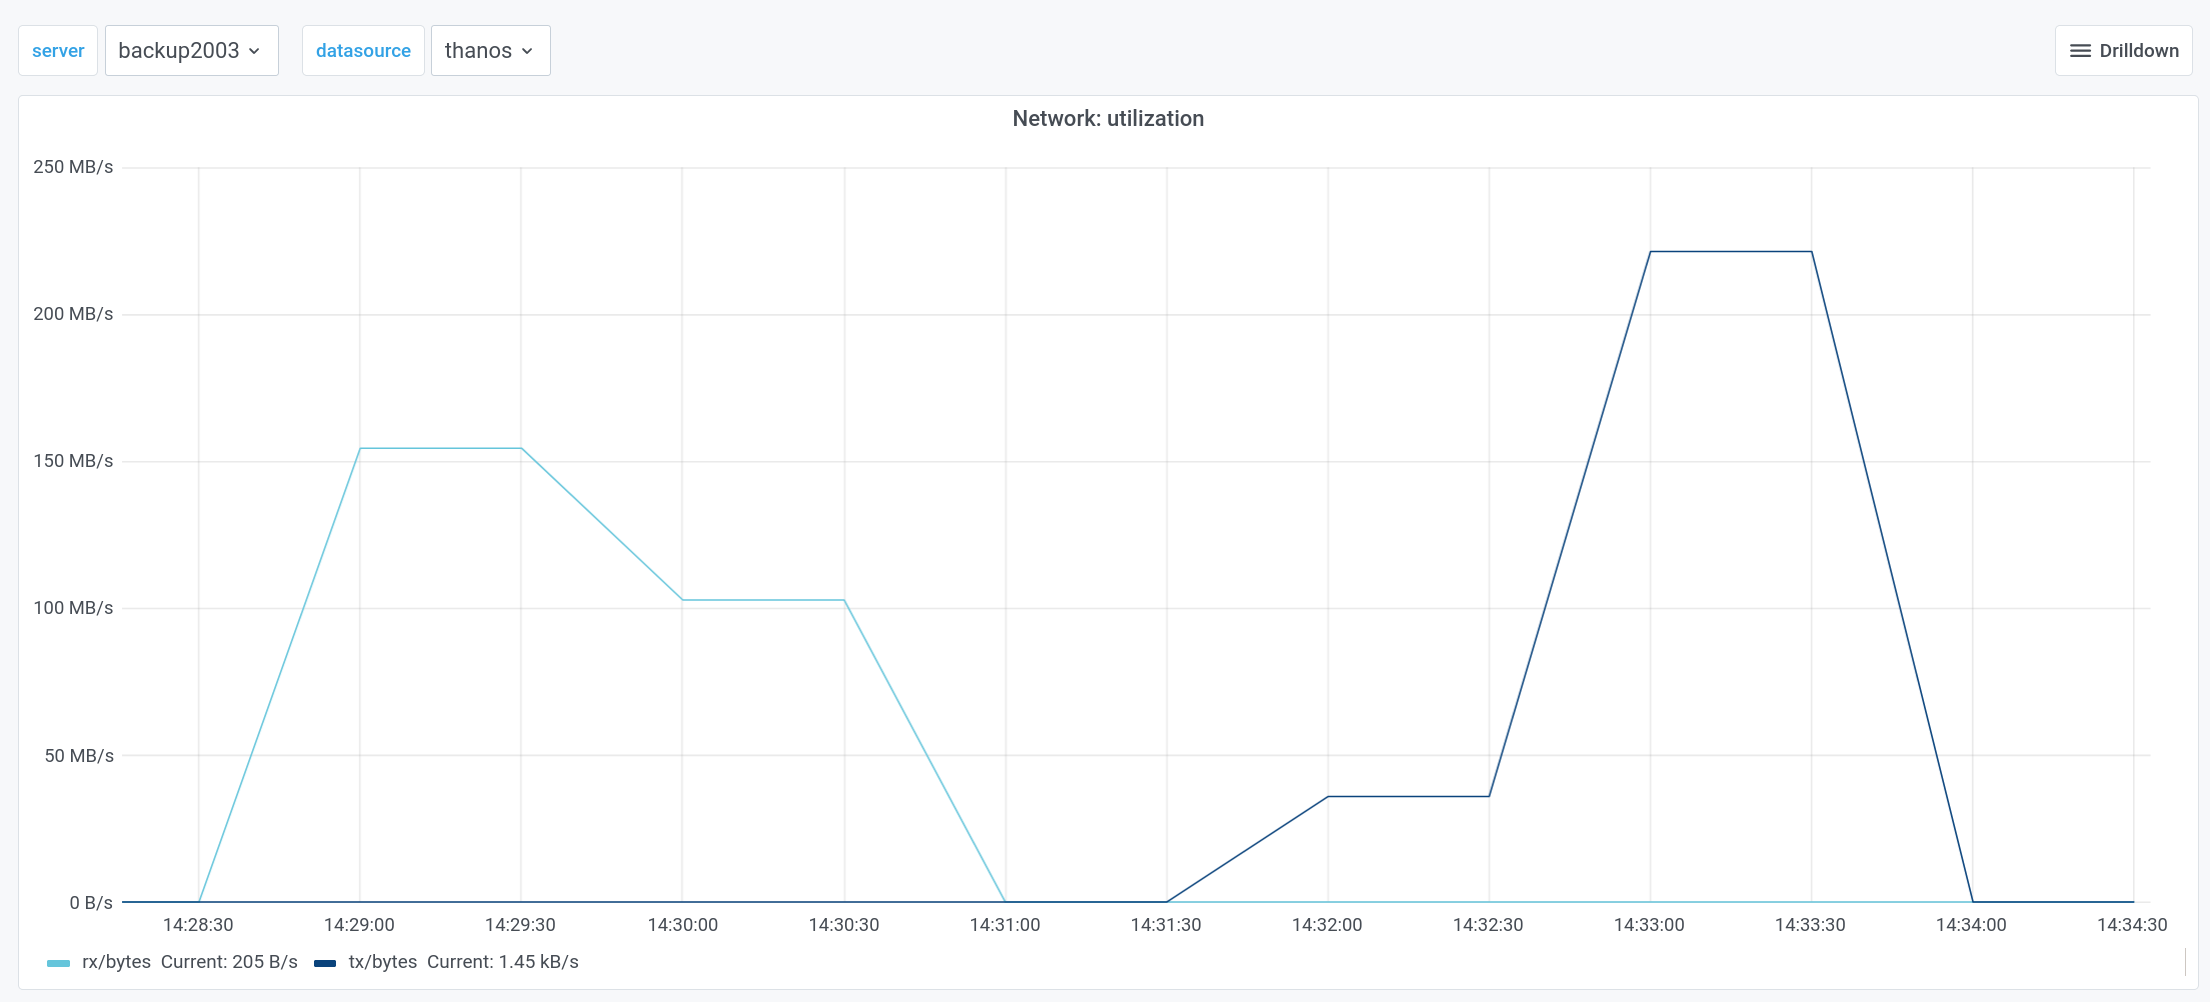
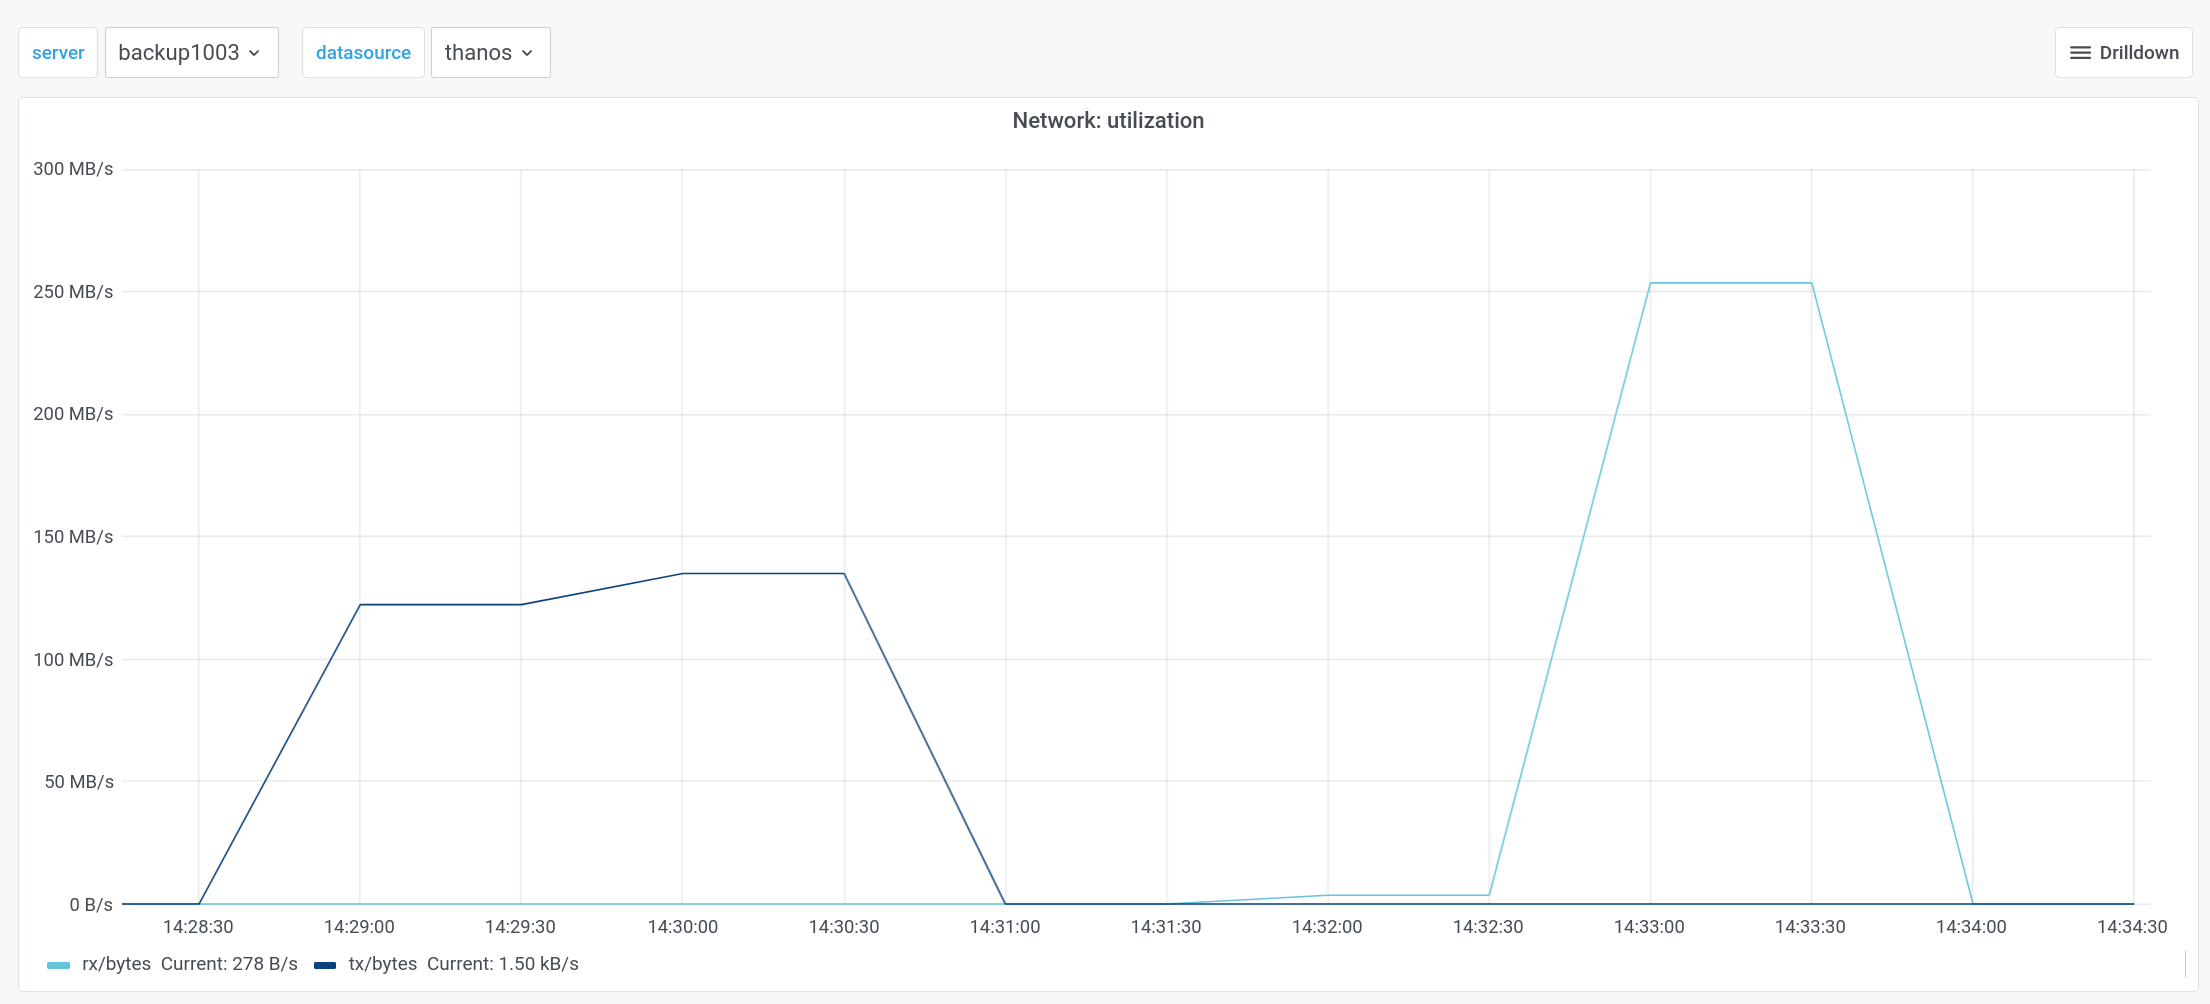
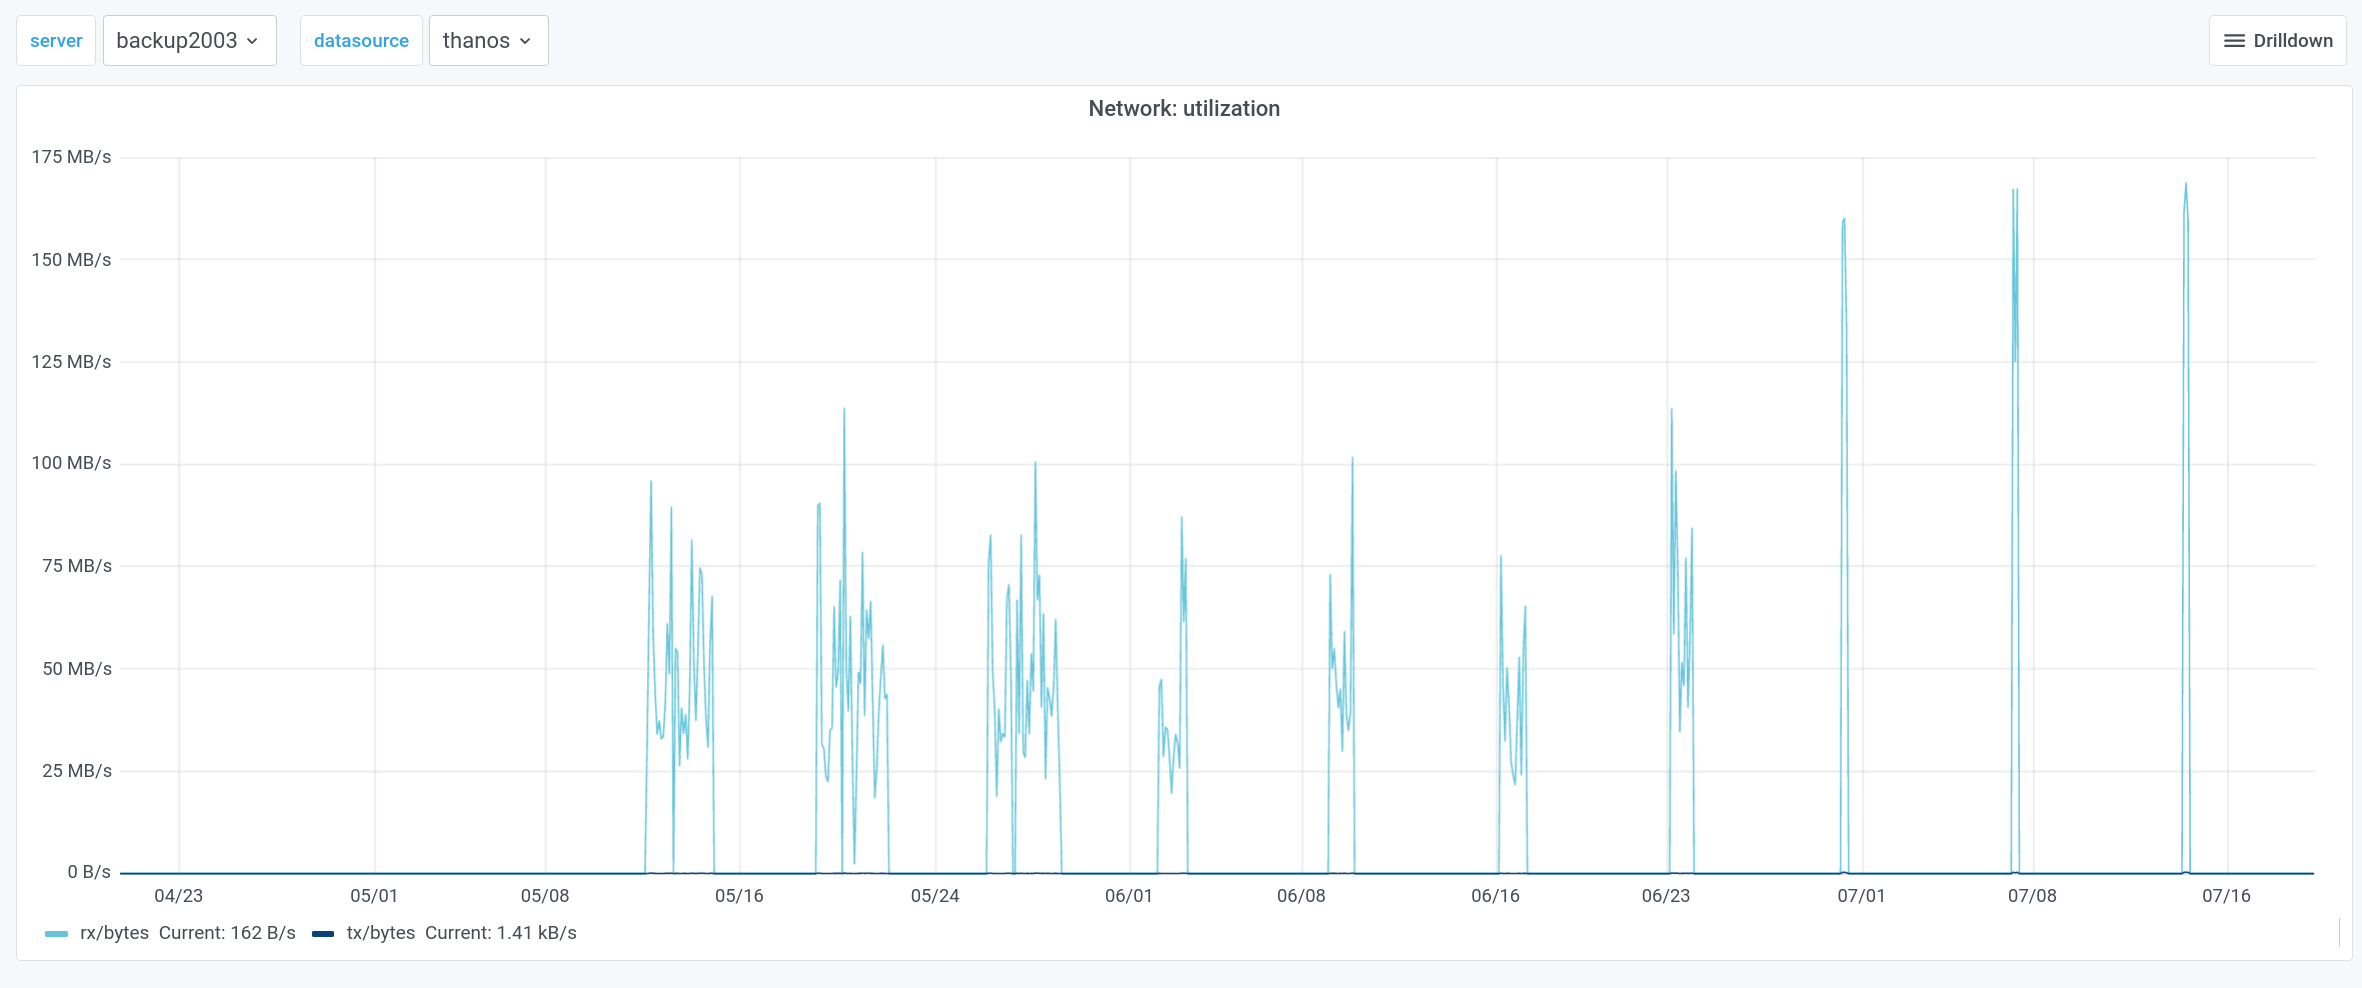
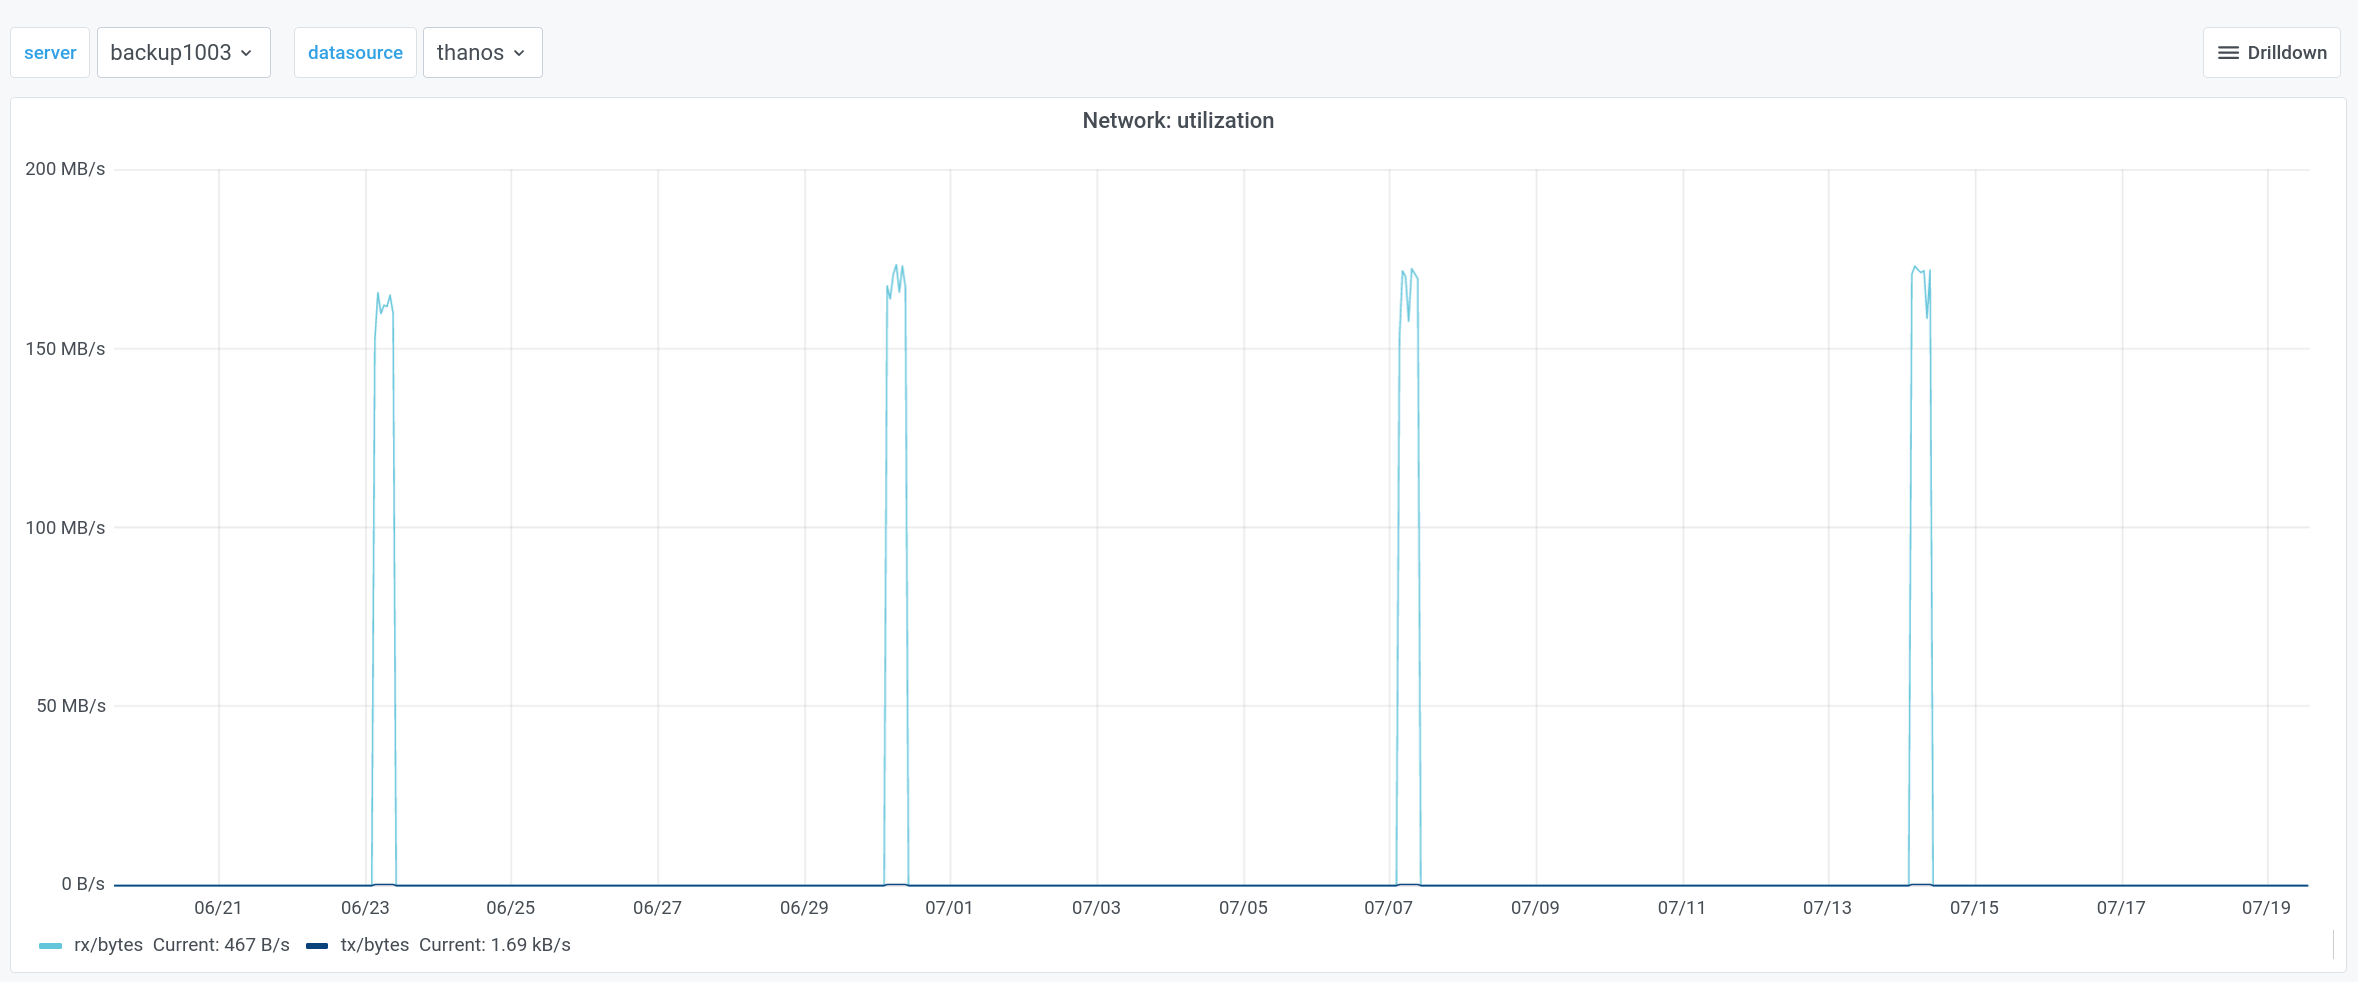
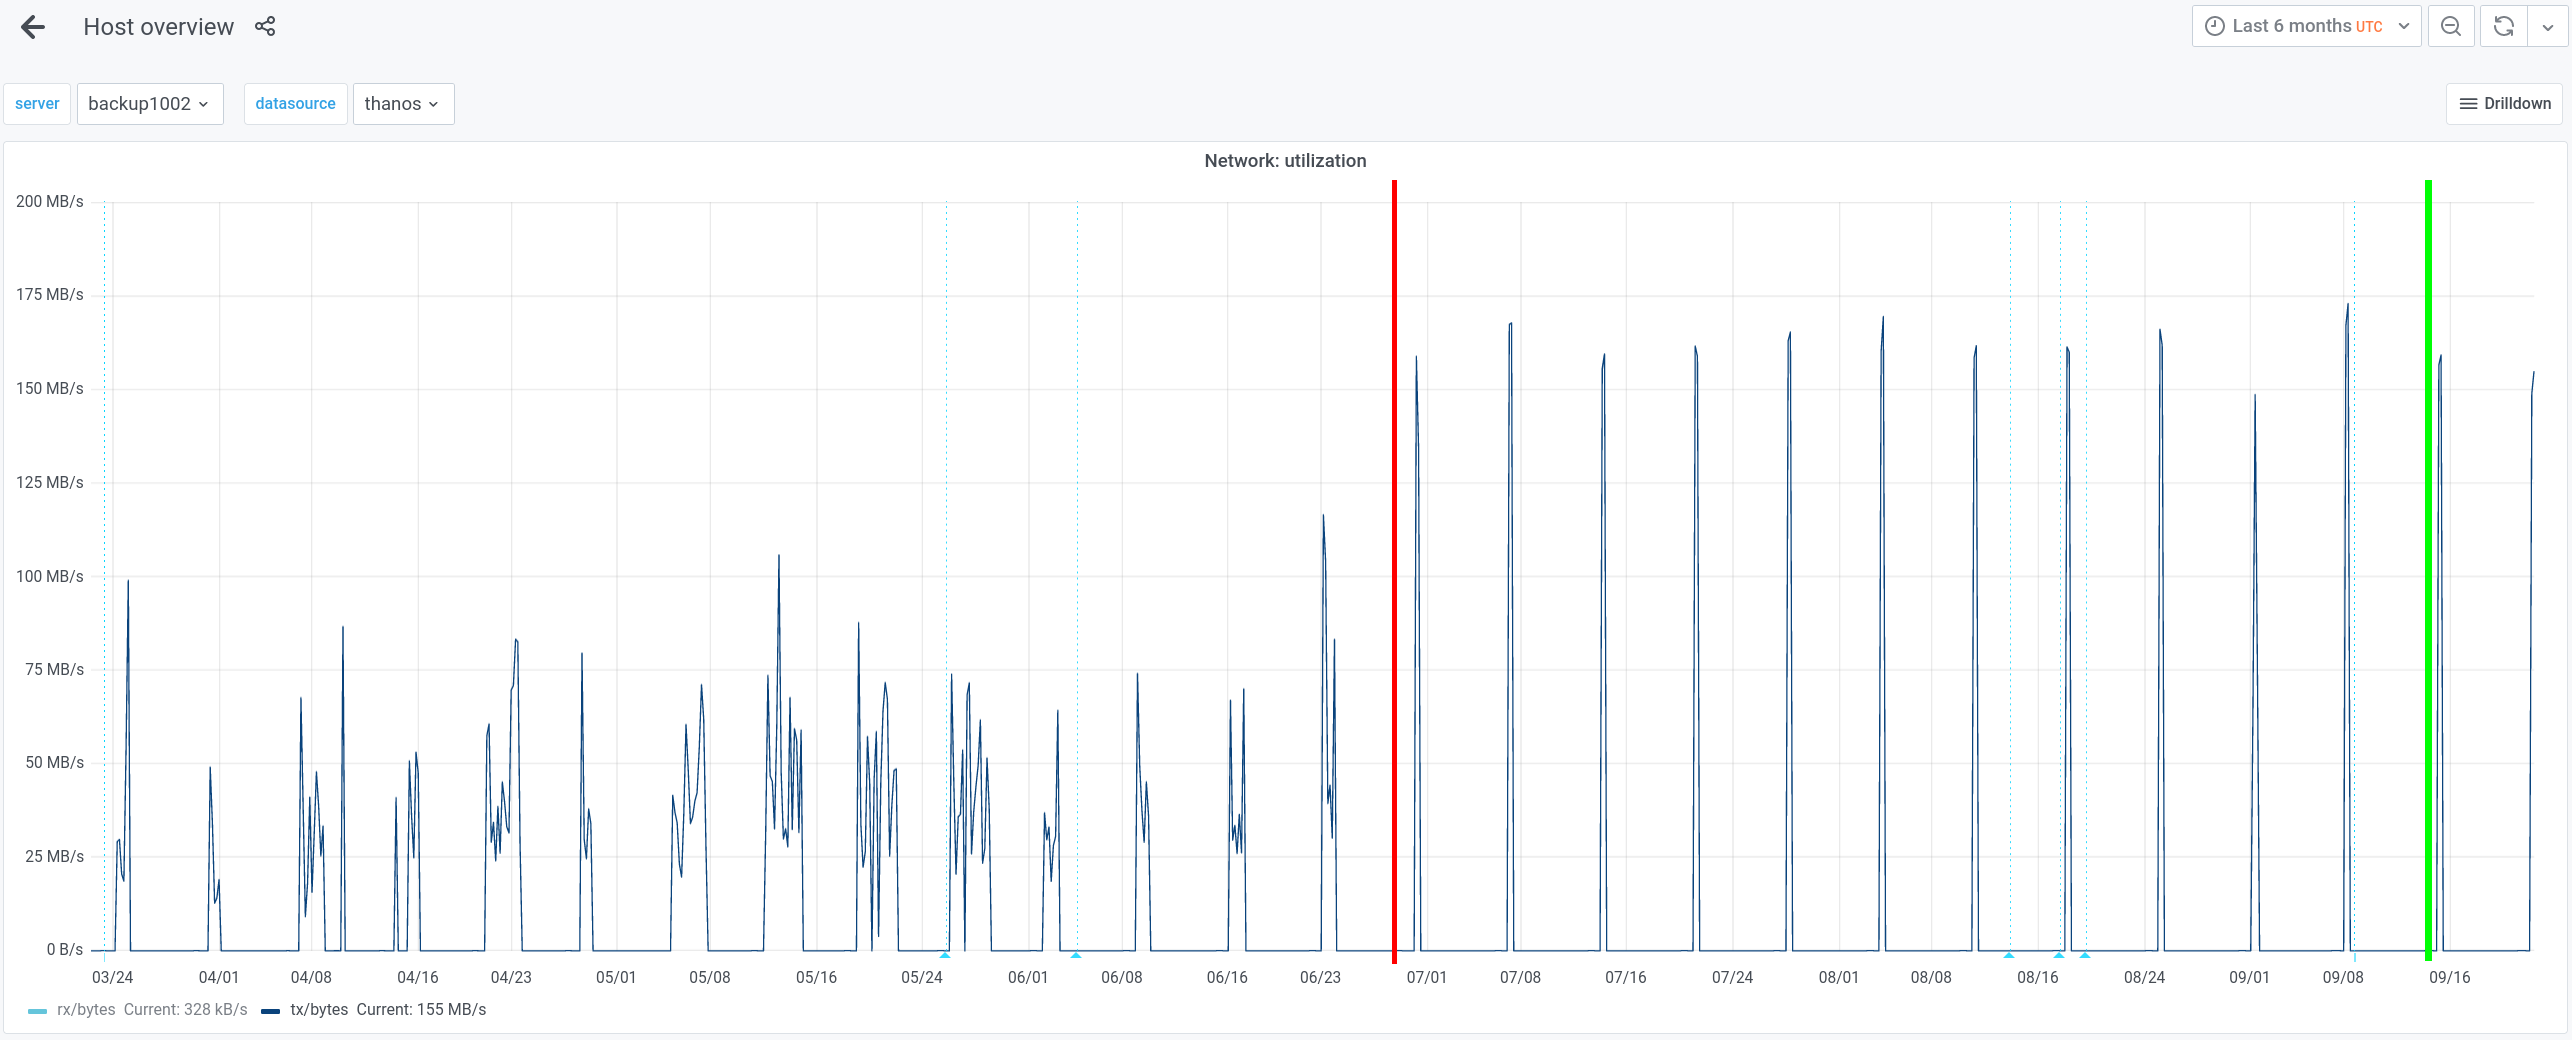
For some reason, eqiad-> codfw backups take 4x-7x longer :-(: https://grafana.wikimedia.org/d/000000377/host-overview?viewPanel=8&orgId=1&from=1612780931730&to=1612809026255&var-server=backup1002&var-datasource=thanos&var-cluster=misc

Screenshot from 2021-02-08 19-31-35.png (940×2 px, 146 KB)

We need to debug this, as while the speed is "enough" (although undesired), to perform regular backups, it could be a major blocker in case of an emergency recovery.

We need to first discover at which layer this is happening, and then debug it further:

  • Software limitation (e.g. bacula)
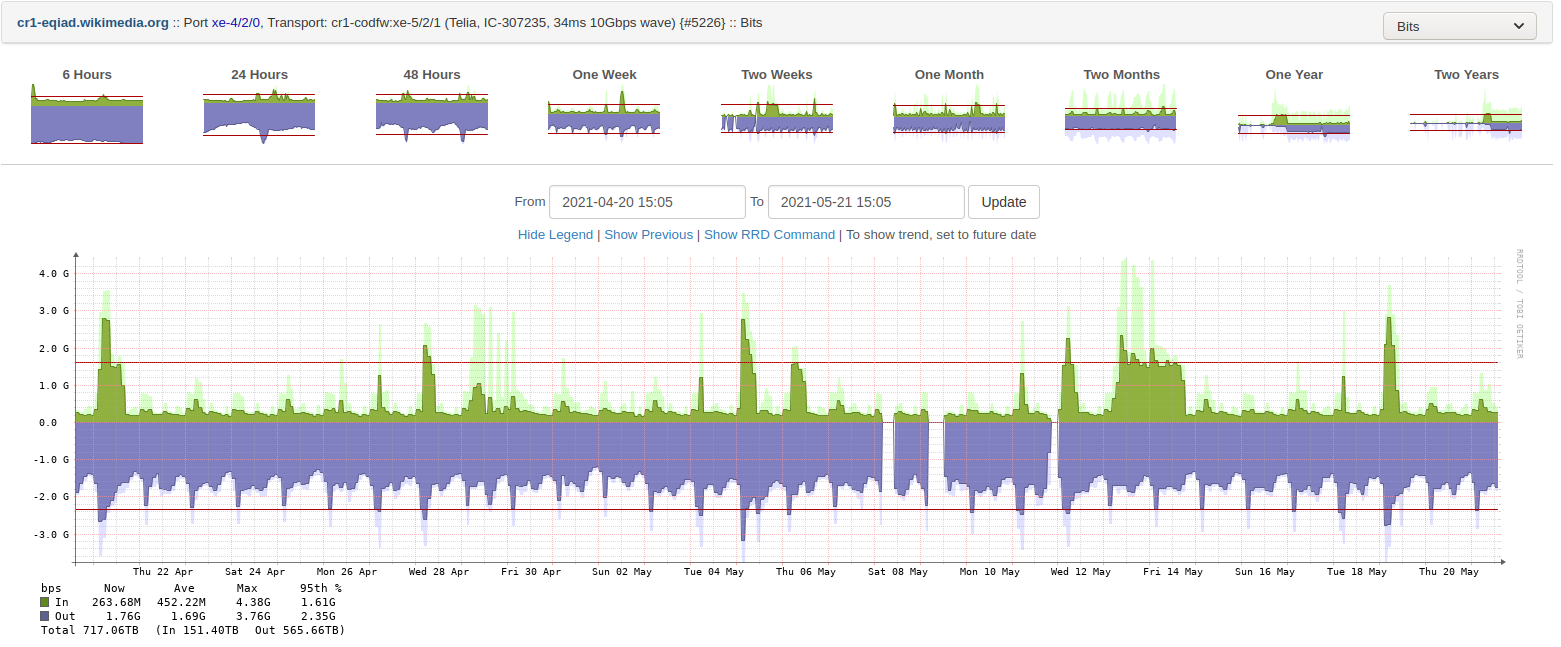
  • Hardware limitation (e.g. hw raid/disks issue)
  • Network limitation (e.g. link instability or bottleneck)

Event Timeline

Something that may or may not be related, but we will want to correct is that backup2002 is resolved on dns to the ipv4 address while backup1002 is resolved to the the ipv6 one. We have to check the system and network configuration. However, given the nature of the connections this is unlikely to be a direct cause, as connection between both servers seems quite stable, with no packet loss and same latency.

Update: firewall only allows ipv4 tcp traffic on the relevant service, so definitely not related, but something to followup later.

jcrespo added a subscriber: ayounsi.

backup2002 -> backup1002 (please note this was while large backups were running in the background)

root@backup2002:~$ iperf3 -c 10.64.32.107
Connecting to host 10.64.32.107, port 5201
[  5] local 10.192.0.190 port 44724 connected to 10.64.32.107 port 5201
[ ID] Interval           Transfer     Bitrate         Retr  Cwnd
[  5]   0.00-1.00   sec   189 MBytes  1.59 Gbits/sec    0   16.0 MBytes       
[  5]   1.00-2.00   sec   249 MBytes  2.09 Gbits/sec    0   16.0 MBytes       
[  5]   2.00-3.00   sec   255 MBytes  2.14 Gbits/sec    0   16.0 MBytes       
[  5]   3.00-4.00   sec   249 MBytes  2.09 Gbits/sec    0   16.0 MBytes       
[  5]   4.00-5.00   sec   251 MBytes  2.11 Gbits/sec    0   16.0 MBytes       
[  5]   5.00-6.00   sec   252 MBytes  2.12 Gbits/sec    0   16.0 MBytes       
[  5]   6.00-7.00   sec   248 MBytes  2.08 Gbits/sec    0   16.0 MBytes       
[  5]   7.00-8.00   sec   256 MBytes  2.15 Gbits/sec    0   16.0 MBytes       
[  5]   8.00-9.00   sec   248 MBytes  2.08 Gbits/sec    0   16.0 MBytes       
[  5]   9.00-10.00  sec   252 MBytes  2.12 Gbits/sec    0   16.0 MBytes       
- - - - - - - - - - - - - - - - - - - - - - - - -
[ ID] Interval           Transfer     Bitrate         Retr
[  5]   0.00-10.00  sec  2.39 GBytes  2.05 Gbits/sec    0             sender
[  5]   0.00-10.04  sec  2.39 GBytes  2.04 Gbits/sec                  receiver

iperf Done.
✔️

Same trace, from server side:

root@backup1002:~$ iperf3 -s
-----------------------------------------------------------
Server listening on 5201
-----------------------------------------------------------
Accepted connection from 10.192.0.190, port 44722
[  5] local 10.64.32.107 port 5201 connected to 10.192.0.190 port 44724
[ ID] Interval           Transfer     Bitrate
[  5]   0.00-1.00   sec   176 MBytes  1.47 Gbits/sec                  
[  5]   1.00-2.00   sec   252 MBytes  2.11 Gbits/sec                  
[  5]   2.00-3.00   sec   250 MBytes  2.10 Gbits/sec                  
[  5]   3.00-4.00   sec   253 MBytes  2.13 Gbits/sec                  
[  5]   4.00-5.00   sec   248 MBytes  2.08 Gbits/sec                  
[  5]   5.00-6.00   sec   255 MBytes  2.14 Gbits/sec                  
[  5]   6.00-7.00   sec   249 MBytes  2.09 Gbits/sec                  
[  5]   7.00-8.00   sec   251 MBytes  2.11 Gbits/sec                  
[  5]   8.00-9.00   sec   252 MBytes  2.12 Gbits/sec                  
[  5]   9.00-10.00  sec   248 MBytes  2.08 Gbits/sec                  
[  5]  10.00-10.04  sec  12.0 MBytes  2.61 Gbits/sec                  
- - - - - - - - - - - - - - - - - - - - - - - - -
[ ID] Interval           Transfer     Bitrate
[  5]   0.00-10.04  sec  2.39 GBytes  2.04 Gbits/sec                  receiver
-----------------------------------------------------------

backup1002 -> backup2002 (again, backups running also in the background)

root@backup1002:~$ iperf3 -c 10.192.0.190
Connecting to host 10.192.0.190, port 5201
[  5] local 10.64.32.107 port 43610 connected to 10.192.0.190 port 5201
[ ID] Interval           Transfer     Bitrate         Retr  Cwnd
[  5]   0.00-1.00   sec  90.1 MBytes   756 Mbits/sec  861   2.63 MBytes       
[  5]   1.00-2.00   sec  83.8 MBytes   703 Mbits/sec    0   2.77 MBytes       
[  5]   2.00-3.00   sec  90.0 MBytes   755 Mbits/sec    0   2.88 MBytes       
[  5]   3.00-4.00   sec  90.0 MBytes   755 Mbits/sec    0   2.96 MBytes       
[  5]   4.00-5.00   sec  96.2 MBytes   807 Mbits/sec    0   3.02 MBytes       
[  5]   5.00-6.00   sec  93.8 MBytes   786 Mbits/sec    0   3.07 MBytes       
[  5]   6.00-7.00   sec  98.8 MBytes   828 Mbits/sec    0   3.09 MBytes       
[  5]   7.00-8.00   sec  85.0 MBytes   713 Mbits/sec  123   2.22 MBytes       
[  5]   8.00-9.00   sec  56.2 MBytes   472 Mbits/sec  281   1.15 MBytes       
[  5]   9.00-10.00  sec  38.8 MBytes   325 Mbits/sec    0   1.23 MBytes       
- - - - - - - - - - - - - - - - - - - - - - - - -
[ ID] Interval           Transfer     Bitrate         Retr
[  5]   0.00-10.00  sec   823 MBytes   690 Mbits/sec  1265             sender
[  5]   0.00-10.04  sec   812 MBytes   679 Mbits/sec                  receiver

iperf Done.
✔️

Same trace, from server side:

iperf3 -s
-----------------------------------------------------------
Server listening on 5201
-----------------------------------------------------------
Accepted connection from 10.64.32.107, port 43608
[  5] local 10.192.0.190 port 5201 connected to 10.64.32.107 port 43610
[ ID] Interval           Transfer     Bitrate
[  5]   0.00-1.00   sec  75.8 MBytes   636 Mbits/sec                  
[  5]   1.00-2.00   sec  86.4 MBytes   725 Mbits/sec                  
[  5]   2.00-3.00   sec  87.5 MBytes   734 Mbits/sec                  
[  5]   3.00-4.00   sec  93.3 MBytes   783 Mbits/sec                  
[  5]   4.00-5.00   sec  92.9 MBytes   779 Mbits/sec                  
[  5]   5.00-6.00   sec  97.2 MBytes   815 Mbits/sec                  
[  5]   6.00-7.00   sec  95.9 MBytes   804 Mbits/sec                  
[  5]   7.00-8.00   sec  87.0 MBytes   730 Mbits/sec                  
[  5]   8.00-9.00   sec  56.9 MBytes   478 Mbits/sec                  
[  5]   9.00-10.00  sec  38.1 MBytes   320 Mbits/sec                  
[  5]  10.00-10.04  sec  1.23 MBytes   252 Mbits/sec                  
- - - - - - - - - - - - - - - - - - - - - - - - -
[ ID] Interval           Transfer     Bitrate
[  5]   0.00-10.04  sec   812 MBytes   679 Mbits/sec                  receiver
-----------------------------------------------------------

@ayounsi Once I finish the current backups, I can run it again in a more idle status (with much less ongoing activity). But if it wasn't because ethtool reports the link speed as 10000 Mb/s on both (and of course, that it makes no sense for it to work in one way but not another!) I would see the 2 results and say we would be on a 1Gbit link :-/. Transfer in one way caps at 1.4 Gbps (ok) but in the other way barely over 0.5 (sure, with low concurrency, but I can assure you I can do 5 Gbits with 1 connection rather easily).

Just to be clear, I don't expect to have the full 10Gs dedicated to me, but it is surprising the difference in direction being so large (4x)! These hosts contain the very large wiki content backups, so such a difference means a lot for the 1-time transfers they need.

I don't think this is a specific issue of the hosts, I can reproduce this on unrelated backup1001 and backup2001, although with a lower difference( 2-3x), although probably due to the time (less congestion):

backup1001 and backup2001
backup1001      backup2001
10.64.48.36 <-> 10.192.48.116

root@backup2001:~$ iperf3 -c 10.64.48.36 -t 120
Connecting to host 10.64.48.36, port 5201
[  5] local 10.192.48.116 port 56210 connected to 10.64.48.36 port 5201
[ ID] Interval           Transfer     Bitrate         Retr  Cwnd
[  5]   0.00-1.00   sec   176 MBytes  1.47 Gbits/sec    0   16.0 MBytes       
[  5]   1.00-2.00   sec   241 MBytes  2.02 Gbits/sec    0   16.0 MBytes       
[  5]   2.00-3.00   sec   242 MBytes  2.04 Gbits/sec    0   16.0 MBytes       
[  5]   3.00-4.00   sec   239 MBytes  2.00 Gbits/sec    0   16.0 MBytes       
[  5]   4.00-5.00   sec   239 MBytes  2.00 Gbits/sec    0   16.0 MBytes       
[  5]   5.00-6.00   sec   239 MBytes  2.00 Gbits/sec    0   16.0 MBytes       
[  5]   6.00-7.00   sec   240 MBytes  2.01 Gbits/sec    0   16.0 MBytes       
[  5]   7.00-8.00   sec   242 MBytes  2.03 Gbits/sec    0   16.0 MBytes       
[  5]   8.00-9.00   sec   240 MBytes  2.01 Gbits/sec    0   16.0 MBytes       
[  5]   9.00-10.00  sec   240 MBytes  2.01 Gbits/sec    0   16.0 MBytes       
[  5]  10.00-11.00  sec   239 MBytes  2.00 Gbits/sec    0   16.0 MBytes       
[  5]  11.00-12.00  sec   240 MBytes  2.01 Gbits/sec    0   16.0 MBytes       
[  5]  12.00-13.00  sec   241 MBytes  2.02 Gbits/sec    0   16.0 MBytes       
[  5]  13.00-14.00  sec   240 MBytes  2.01 Gbits/sec    0   16.0 MBytes       
[  5]  14.00-15.00  sec   241 MBytes  2.02 Gbits/sec    0   16.0 MBytes       
[  5]  15.00-16.00  sec   239 MBytes  2.00 Gbits/sec    0   16.0 MBytes       
[  5]  16.00-17.00  sec   240 MBytes  2.01 Gbits/sec    0   16.0 MBytes       
[  5]  17.00-18.00  sec   239 MBytes  2.00 Gbits/sec    0   16.0 MBytes       
[  5]  18.00-19.00  sec   241 MBytes  2.02 Gbits/sec    0   16.0 MBytes       
[  5]  19.00-20.00  sec   242 MBytes  2.03 Gbits/sec    0   16.0 MBytes       
[  5]  20.00-21.00  sec   239 MBytes  2.00 Gbits/sec    0   16.0 MBytes       
[  5]  21.00-22.00  sec   240 MBytes  2.01 Gbits/sec    0   16.0 MBytes       
[  5]  22.00-23.00  sec   239 MBytes  2.00 Gbits/sec    0   16.0 MBytes       
[  5]  23.00-24.00  sec   239 MBytes  2.00 Gbits/sec    0   16.0 MBytes       
[  5]  24.00-25.00  sec   244 MBytes  2.04 Gbits/sec    0   16.0 MBytes       
[  5]  25.00-26.00  sec   239 MBytes  2.00 Gbits/sec    0   16.0 MBytes       
[  5]  26.00-27.00  sec   240 MBytes  2.01 Gbits/sec    0   16.0 MBytes       
[  5]  27.00-28.00  sec   239 MBytes  2.00 Gbits/sec    0   16.0 MBytes       
[  5]  28.00-29.00  sec   239 MBytes  2.00 Gbits/sec    0   16.0 MBytes       
[  5]  29.00-30.00  sec   241 MBytes  2.02 Gbits/sec    0   16.0 MBytes       
[  5]  30.00-31.00  sec   241 MBytes  2.02 Gbits/sec    0   16.0 MBytes       
[  5]  31.00-32.00  sec   240 MBytes  2.01 Gbits/sec    0   16.0 MBytes       
[  5]  32.00-33.00  sec   239 MBytes  2.00 Gbits/sec    0   16.0 MBytes       
[  5]  33.00-34.00  sec   240 MBytes  2.01 Gbits/sec    0   16.0 MBytes       
[  5]  34.00-35.00  sec   239 MBytes  2.00 Gbits/sec    0   16.0 MBytes       
[  5]  35.00-36.00  sec   241 MBytes  2.02 Gbits/sec    0   16.0 MBytes       
[  5]  36.00-37.00  sec   240 MBytes  2.01 Gbits/sec    0   16.0 MBytes       
[  5]  37.00-38.00  sec   239 MBytes  2.00 Gbits/sec    0   16.0 MBytes       
[  5]  38.00-39.00  sec   240 MBytes  2.01 Gbits/sec    0   16.0 MBytes       
[  5]  39.00-40.00  sec   239 MBytes  2.00 Gbits/sec    0   16.0 MBytes       
[  5]  40.00-41.00  sec   239 MBytes  2.00 Gbits/sec    0   16.0 MBytes       
[  5]  41.00-42.00  sec   244 MBytes  2.04 Gbits/sec    0   16.0 MBytes       
[  5]  42.00-43.00  sec   239 MBytes  2.00 Gbits/sec    0   16.0 MBytes       
[  5]  43.00-44.00  sec   239 MBytes  2.00 Gbits/sec    0   16.0 MBytes       
[  5]  44.00-45.00  sec   239 MBytes  2.00 Gbits/sec    0   16.0 MBytes       
[  5]  45.00-46.00  sec   240 MBytes  2.01 Gbits/sec    0   16.0 MBytes       
[  5]  46.00-47.00  sec   244 MBytes  2.04 Gbits/sec    0   16.0 MBytes       
[  5]  47.00-48.00  sec   239 MBytes  2.00 Gbits/sec    0   16.0 MBytes       
[  5]  48.00-49.00  sec   240 MBytes  2.01 Gbits/sec    0   16.0 MBytes       
[  5]  49.00-50.00  sec   239 MBytes  2.00 Gbits/sec    0   16.0 MBytes       
[  5]  50.00-51.00  sec   239 MBytes  2.00 Gbits/sec    0   16.0 MBytes       
[  5]  51.00-52.00  sec   241 MBytes  2.02 Gbits/sec    0   16.0 MBytes       
[  5]  52.00-53.00  sec   240 MBytes  2.01 Gbits/sec    0   16.0 MBytes       
[  5]  53.00-54.00  sec   240 MBytes  2.01 Gbits/sec    0   16.0 MBytes       
[  5]  54.00-55.00  sec   239 MBytes  2.00 Gbits/sec    0   16.0 MBytes       
[  5]  55.00-56.00  sec   240 MBytes  2.01 Gbits/sec    0   16.0 MBytes       
[  5]  56.00-57.00  sec   240 MBytes  2.01 Gbits/sec    0   16.0 MBytes       
[  5]  57.00-58.00  sec   239 MBytes  2.00 Gbits/sec    0   16.0 MBytes       
[  5]  58.00-59.00  sec   244 MBytes  2.04 Gbits/sec    0   16.0 MBytes       
[  5]  59.00-60.00  sec   239 MBytes  2.00 Gbits/sec    0   16.0 MBytes       
[  5]  60.00-61.00  sec   240 MBytes  2.01 Gbits/sec    0   16.0 MBytes       
[  5]  61.00-62.00  sec   240 MBytes  2.01 Gbits/sec    0   16.0 MBytes       
[  5]  62.00-63.00  sec   241 MBytes  2.02 Gbits/sec    0   16.0 MBytes       
[  5]  63.00-64.00  sec   241 MBytes  2.02 Gbits/sec    0   16.0 MBytes       
[  5]  64.00-65.00  sec   239 MBytes  2.00 Gbits/sec    0   16.0 MBytes       
[  5]  65.00-66.00  sec   239 MBytes  2.00 Gbits/sec    0   16.0 MBytes       
[  5]  66.00-67.00  sec   240 MBytes  2.01 Gbits/sec    0   16.0 MBytes       
[  5]  67.00-68.00  sec   244 MBytes  2.04 Gbits/sec    0   16.0 MBytes       
[  5]  68.00-69.00  sec   240 MBytes  2.01 Gbits/sec    0   16.0 MBytes       
[  5]  69.00-70.00  sec   239 MBytes  2.00 Gbits/sec    0   16.0 MBytes       
[  5]  70.00-71.00  sec   239 MBytes  2.00 Gbits/sec    0   16.0 MBytes       
[  5]  71.00-72.00  sec   242 MBytes  2.03 Gbits/sec    0   16.0 MBytes       
[  5]  72.00-73.00  sec   241 MBytes  2.02 Gbits/sec    0   16.0 MBytes       
[  5]  73.00-74.00  sec   239 MBytes  2.00 Gbits/sec    0   16.0 MBytes       
[  5]  74.00-75.00  sec   240 MBytes  2.01 Gbits/sec    0   16.0 MBytes       
[  5]  75.00-76.00  sec   239 MBytes  2.00 Gbits/sec    0   16.0 MBytes       
[  5]  76.00-77.00  sec   242 MBytes  2.03 Gbits/sec    0   16.0 MBytes       
[  5]  77.00-78.00  sec   241 MBytes  2.02 Gbits/sec    0   16.0 MBytes       
[  5]  78.00-79.00  sec   239 MBytes  2.00 Gbits/sec    0   16.0 MBytes       
[  5]  79.00-80.00  sec   240 MBytes  2.01 Gbits/sec    0   16.0 MBytes       
[  5]  80.00-81.00  sec   241 MBytes  2.02 Gbits/sec    0   16.0 MBytes       
[  5]  81.00-82.00  sec   240 MBytes  2.01 Gbits/sec    0   16.0 MBytes       
[  5]  82.00-83.00  sec   240 MBytes  2.01 Gbits/sec    0   16.0 MBytes       
[  5]  83.00-84.00  sec   239 MBytes  2.00 Gbits/sec    0   16.0 MBytes       
[  5]  84.00-85.00  sec   239 MBytes  2.00 Gbits/sec    0   16.0 MBytes       
[  5]  85.00-86.00  sec   239 MBytes  2.00 Gbits/sec    0   16.0 MBytes       
[  5]  86.00-87.00  sec   242 MBytes  2.03 Gbits/sec    0   16.0 MBytes       
[  5]  87.00-88.00  sec   239 MBytes  2.00 Gbits/sec    0   16.0 MBytes       
[  5]  88.00-89.00  sec   240 MBytes  2.01 Gbits/sec    0   16.0 MBytes       
[  5]  89.00-90.00  sec   239 MBytes  2.00 Gbits/sec    0   16.0 MBytes       
[  5]  90.00-91.00  sec   239 MBytes  2.00 Gbits/sec    0   16.0 MBytes       
[  5]  91.00-92.00  sec   239 MBytes  2.00 Gbits/sec    0   16.0 MBytes       
[  5]  92.00-93.00  sec   239 MBytes  2.00 Gbits/sec    0   16.0 MBytes       
[  5]  93.00-94.00  sec   241 MBytes  2.02 Gbits/sec    0   16.0 MBytes       
[  5]  94.00-95.00  sec   241 MBytes  2.02 Gbits/sec    0   16.0 MBytes       
[  5]  95.00-96.00  sec   241 MBytes  2.02 Gbits/sec    0   16.0 MBytes       
[  5]  96.00-97.00  sec   239 MBytes  2.00 Gbits/sec    0   16.0 MBytes       
[  5]  97.00-98.00  sec   240 MBytes  2.01 Gbits/sec    0   16.0 MBytes       
[  5]  98.00-99.00  sec   239 MBytes  2.00 Gbits/sec    0   16.0 MBytes       
[  5]  99.00-100.00 sec   239 MBytes  2.00 Gbits/sec    0   16.0 MBytes       
[  5] 100.00-101.00 sec   239 MBytes  2.00 Gbits/sec    0   16.0 MBytes       
[  5] 101.00-102.00 sec   239 MBytes  2.00 Gbits/sec    0   16.0 MBytes       
[  5] 102.00-103.00 sec   239 MBytes  2.00 Gbits/sec    0   16.0 MBytes       
[  5] 103.00-104.00 sec   239 MBytes  2.00 Gbits/sec    0   16.0 MBytes       
[  5] 104.00-105.00 sec   239 MBytes  2.00 Gbits/sec    0   16.0 MBytes       
[  5] 105.00-106.00 sec   240 MBytes  2.01 Gbits/sec    0   16.0 MBytes       
[  5] 106.00-107.00 sec   241 MBytes  2.02 Gbits/sec    0   16.0 MBytes       
[  5] 107.00-108.00 sec   241 MBytes  2.02 Gbits/sec    0   16.0 MBytes       
[  5] 108.00-109.00 sec   239 MBytes  2.00 Gbits/sec    0   16.0 MBytes       
[  5] 109.00-110.00 sec   240 MBytes  2.01 Gbits/sec    0   16.0 MBytes       
[  5] 110.00-111.00 sec   239 MBytes  2.00 Gbits/sec    0   16.0 MBytes       
[  5] 111.00-112.00 sec   239 MBytes  2.00 Gbits/sec    0   16.0 MBytes       
[  5] 112.00-113.00 sec   239 MBytes  2.00 Gbits/sec    0   16.0 MBytes       
[  5] 113.00-114.00 sec   239 MBytes  2.00 Gbits/sec    0   16.0 MBytes       
[  5] 114.00-115.00 sec   241 MBytes  2.02 Gbits/sec    0   16.0 MBytes       
[  5] 115.00-116.00 sec   241 MBytes  2.02 Gbits/sec    0   16.0 MBytes       
[  5] 116.00-117.00 sec   241 MBytes  2.02 Gbits/sec    0   16.0 MBytes       
[  5] 117.00-118.00 sec   239 MBytes  2.00 Gbits/sec    0   16.0 MBytes       
[  5] 118.00-119.00 sec   239 MBytes  2.00 Gbits/sec    0   16.0 MBytes       
[  5] 119.00-120.00 sec   239 MBytes  2.00 Gbits/sec    0   16.0 MBytes       
- - - - - - - - - - - - - - - - - - - - - - - - -
[ ID] Interval           Transfer     Bitrate         Retr
[  5]   0.00-120.00 sec  28.1 GBytes  2.01 Gbits/sec    0             sender
[  5]   0.00-120.04 sec  28.0 GBytes  2.01 Gbits/sec                  receiver

iperf Done.
✔️

root@backup1001:~$ iperf3 -c 10.192.48.116 -t 120
Connecting to host 10.192.48.116, port 5201
[  5] local 10.64.48.36 port 51102 connected to 10.192.48.116 port 5201
[ ID] Interval           Transfer     Bitrate         Retr  Cwnd
[  5]   0.00-1.00   sec   112 MBytes   937 Mbits/sec  575   3.92 MBytes       
[  5]   1.00-2.00   sec   111 MBytes   933 Mbits/sec  139   2.88 MBytes       
[  5]   2.00-3.00   sec  87.5 MBytes   734 Mbits/sec    0   3.03 MBytes       
[  5]   3.00-4.00   sec  92.5 MBytes   776 Mbits/sec    0   3.16 MBytes       
[  5]   4.00-5.00   sec  95.0 MBytes   797 Mbits/sec    0   3.25 MBytes       
[  5]   5.00-6.00   sec  97.5 MBytes   818 Mbits/sec    0   3.33 MBytes       
[  5]   6.00-7.00   sec   100 MBytes   839 Mbits/sec    0   3.38 MBytes       
[  5]   7.00-8.00   sec   100 MBytes   839 Mbits/sec    0   3.42 MBytes       
[  5]   8.00-9.00   sec   102 MBytes   860 Mbits/sec    0   3.44 MBytes       
[  5]   9.00-10.00  sec   104 MBytes   870 Mbits/sec    0   3.46 MBytes       
[  5]  10.00-11.00  sec   102 MBytes   860 Mbits/sec    0   3.46 MBytes       
[  5]  11.00-12.00  sec   104 MBytes   870 Mbits/sec    0   3.46 MBytes       
[  5]  12.00-13.00  sec   102 MBytes   860 Mbits/sec    0   3.46 MBytes       
[  5]  13.00-14.00  sec   102 MBytes   860 Mbits/sec    0   3.46 MBytes       
[  5]  14.00-15.00  sec  97.5 MBytes   818 Mbits/sec   67   2.46 MBytes       
[  5]  15.00-16.00  sec  76.2 MBytes   640 Mbits/sec    0   2.69 MBytes       
[  5]  16.00-17.00  sec  71.2 MBytes   598 Mbits/sec   27   2.02 MBytes       
[  5]  17.00-18.00  sec  61.2 MBytes   514 Mbits/sec    0   2.13 MBytes       
[  5]  18.00-19.00  sec  63.8 MBytes   535 Mbits/sec    0   2.21 MBytes       
[  5]  19.00-20.00  sec  66.2 MBytes   556 Mbits/sec    0   2.28 MBytes       
[  5]  20.00-21.00  sec  68.8 MBytes   577 Mbits/sec    0   2.32 MBytes       
[  5]  21.00-22.00  sec  68.8 MBytes   577 Mbits/sec    0   2.35 MBytes       
[  5]  22.00-23.00  sec  68.8 MBytes   577 Mbits/sec    0   2.37 MBytes       
[  5]  23.00-24.00  sec  70.0 MBytes   587 Mbits/sec    0   2.38 MBytes       
[  5]  24.00-25.00  sec  70.0 MBytes   587 Mbits/sec    0   2.38 MBytes       
[  5]  25.00-26.00  sec  70.0 MBytes   587 Mbits/sec    0   2.38 MBytes       
[  5]  26.00-27.00  sec  68.8 MBytes   577 Mbits/sec    0   2.38 MBytes       
[  5]  27.00-28.00  sec  71.2 MBytes   598 Mbits/sec    0   2.38 MBytes       
[  5]  28.00-29.00  sec  71.2 MBytes   598 Mbits/sec    0   2.40 MBytes       
[  5]  29.00-30.00  sec  71.2 MBytes   598 Mbits/sec    0   2.42 MBytes       
[  5]  30.00-31.00  sec  72.5 MBytes   608 Mbits/sec    0   2.46 MBytes       
[  5]  31.00-32.00  sec  70.0 MBytes   587 Mbits/sec   13   1.78 MBytes       
[  5]  32.00-33.00  sec  55.0 MBytes   461 Mbits/sec    0   1.96 MBytes       
[  5]  33.00-34.00  sec  60.0 MBytes   503 Mbits/sec    0   2.11 MBytes       
[  5]  34.00-35.00  sec  65.0 MBytes   545 Mbits/sec    0   2.23 MBytes       
[  5]  35.00-36.00  sec  66.2 MBytes   556 Mbits/sec    0   2.32 MBytes       
[  5]  36.00-37.00  sec  70.0 MBytes   587 Mbits/sec    0   2.39 MBytes       
[  5]  37.00-38.00  sec  71.2 MBytes   598 Mbits/sec    0   2.44 MBytes       
[  5]  38.00-39.00  sec  72.5 MBytes   608 Mbits/sec    0   2.47 MBytes       
[  5]  39.00-40.00  sec  73.8 MBytes   619 Mbits/sec    0   2.49 MBytes       
[  5]  40.00-41.00  sec  73.8 MBytes   619 Mbits/sec    0   2.50 MBytes       
[  5]  41.00-42.00  sec  73.8 MBytes   619 Mbits/sec    0   2.50 MBytes       
[  5]  42.00-43.00  sec  75.0 MBytes   629 Mbits/sec    0   2.50 MBytes       
[  5]  43.00-44.00  sec  73.8 MBytes   619 Mbits/sec    0   2.50 MBytes       
[  5]  44.00-45.00  sec  75.0 MBytes   629 Mbits/sec    0   2.51 MBytes       
[  5]  45.00-46.00  sec  73.8 MBytes   619 Mbits/sec    0   2.52 MBytes       
[  5]  46.00-47.00  sec  75.0 MBytes   629 Mbits/sec    0   2.54 MBytes       
[  5]  47.00-48.00  sec  76.2 MBytes   640 Mbits/sec    0   2.58 MBytes       
[  5]  48.00-49.00  sec  76.2 MBytes   640 Mbits/sec    0   2.63 MBytes       
[  5]  49.00-50.00  sec  78.8 MBytes   661 Mbits/sec    0   2.70 MBytes       
[  5]  50.00-51.00  sec  81.2 MBytes   682 Mbits/sec    0   2.79 MBytes       
[  5]  51.00-52.00  sec  85.0 MBytes   713 Mbits/sec    0   2.91 MBytes       
[  5]  52.00-53.00  sec  87.5 MBytes   734 Mbits/sec    0   3.07 MBytes       
[  5]  53.00-54.00  sec  93.8 MBytes   786 Mbits/sec    0   3.25 MBytes       
[  5]  54.00-55.00  sec   100 MBytes   839 Mbits/sec    0   3.47 MBytes       
[  5]  55.00-56.00  sec   108 MBytes   902 Mbits/sec    0   3.74 MBytes       
[  5]  56.00-57.00  sec   115 MBytes   965 Mbits/sec    0   4.04 MBytes       
[  5]  57.00-58.00  sec   125 MBytes  1.05 Gbits/sec    0   4.39 MBytes       
[  5]  58.00-59.00  sec   136 MBytes  1.14 Gbits/sec    0   4.80 MBytes       
[  5]  59.00-60.00  sec   150 MBytes  1.26 Gbits/sec    0   5.25 MBytes       
[  5]  60.00-61.00  sec   162 MBytes  1.36 Gbits/sec    0   5.76 MBytes       
[  5]  61.00-62.00  sec   181 MBytes  1.52 Gbits/sec    0   6.33 MBytes       
[  5]  62.00-63.00  sec   200 MBytes  1.68 Gbits/sec    0   6.97 MBytes       
[  5]  63.00-64.00  sec   219 MBytes  1.84 Gbits/sec    0   7.68 MBytes       
[  5]  64.00-65.00  sec   238 MBytes  1.99 Gbits/sec    0   8.00 MBytes       
[  5]  65.00-66.00  sec   239 MBytes  2.00 Gbits/sec    0   8.00 MBytes       
[  5]  66.00-67.00  sec   204 MBytes  1.71 Gbits/sec  121   3.97 MBytes       
[  5]  67.00-68.00  sec   118 MBytes   986 Mbits/sec  181   2.91 MBytes       
[  5]  68.00-69.00  sec  88.8 MBytes   745 Mbits/sec    0   3.07 MBytes       
[  5]  69.00-70.00  sec  93.8 MBytes   786 Mbits/sec    0   3.20 MBytes       
[  5]  70.00-71.00  sec  96.2 MBytes   807 Mbits/sec    0   3.30 MBytes       
[  5]  71.00-72.00  sec  98.8 MBytes   828 Mbits/sec    0   3.38 MBytes       
[  5]  72.00-73.00  sec   101 MBytes   849 Mbits/sec    0   3.44 MBytes       
[  5]  73.00-74.00  sec   102 MBytes   860 Mbits/sec    0   3.48 MBytes       
[  5]  74.00-75.00  sec   104 MBytes   870 Mbits/sec    0   3.50 MBytes       
[  5]  75.00-76.00  sec   106 MBytes   891 Mbits/sec    0   3.52 MBytes       
[  5]  76.00-77.00  sec   104 MBytes   870 Mbits/sec    0   3.52 MBytes       
[  5]  77.00-78.00  sec   105 MBytes   881 Mbits/sec    0   3.52 MBytes       
[  5]  78.00-79.00  sec   105 MBytes   881 Mbits/sec    0   3.52 MBytes       
[  5]  79.00-80.00  sec   105 MBytes   881 Mbits/sec    0   3.52 MBytes       
[  5]  80.00-81.00  sec   104 MBytes   870 Mbits/sec    0   3.53 MBytes       
[  5]  81.00-82.00  sec   105 MBytes   881 Mbits/sec    0   3.55 MBytes       
[  5]  82.00-83.00  sec  93.8 MBytes   786 Mbits/sec   56   2.58 MBytes       
[  5]  83.00-84.00  sec  80.0 MBytes   671 Mbits/sec    0   2.81 MBytes       
[  5]  84.00-85.00  sec  86.2 MBytes   724 Mbits/sec    0   2.99 MBytes       
[  5]  85.00-86.00  sec  90.0 MBytes   755 Mbits/sec    0   3.15 MBytes       
[  5]  86.00-87.00  sec  96.2 MBytes   807 Mbits/sec    0   3.27 MBytes       
[  5]  87.00-88.00  sec   100 MBytes   839 Mbits/sec    0   3.37 MBytes       
[  5]  88.00-89.00  sec   100 MBytes   839 Mbits/sec    0   3.44 MBytes       
[  5]  89.00-90.00  sec   104 MBytes   870 Mbits/sec    0   3.49 MBytes       
[  5]  90.00-91.00  sec   104 MBytes   870 Mbits/sec    0   3.53 MBytes       
[  5]  91.00-92.00  sec  78.8 MBytes   661 Mbits/sec   21   2.60 MBytes       
[  5]  92.00-93.00  sec  78.8 MBytes   661 Mbits/sec    0   2.72 MBytes       
[  5]  93.00-94.00  sec  82.5 MBytes   692 Mbits/sec    0   2.81 MBytes       
[  5]  94.00-95.00  sec  85.0 MBytes   713 Mbits/sec    0   2.88 MBytes       
[  5]  95.00-96.00  sec  86.2 MBytes   724 Mbits/sec    0   2.93 MBytes       
[  5]  96.00-97.00  sec  87.5 MBytes   734 Mbits/sec    0   2.97 MBytes       
[  5]  97.00-98.00  sec  87.5 MBytes   734 Mbits/sec    0   2.99 MBytes       
[  5]  98.00-99.00  sec  88.8 MBytes   744 Mbits/sec    0   3.00 MBytes       
[  5]  99.00-100.00 sec  90.0 MBytes   755 Mbits/sec    0   3.00 MBytes       
[  5] 100.00-101.00 sec  88.8 MBytes   744 Mbits/sec    0   3.00 MBytes       
[  5] 101.00-102.00 sec  90.0 MBytes   755 Mbits/sec    0   3.00 MBytes       
[  5] 102.00-103.00 sec  88.8 MBytes   745 Mbits/sec    0   3.00 MBytes       
[  5] 103.00-104.00 sec  88.8 MBytes   744 Mbits/sec    0   3.01 MBytes       
[  5] 104.00-105.00 sec  90.0 MBytes   755 Mbits/sec    0   3.04 MBytes       
[  5] 105.00-106.00 sec  91.2 MBytes   765 Mbits/sec    0   3.07 MBytes       
[  5] 106.00-107.00 sec  92.5 MBytes   776 Mbits/sec    0   3.12 MBytes       
[  5] 107.00-108.00 sec  93.8 MBytes   786 Mbits/sec    0   3.19 MBytes       
[  5] 108.00-109.00 sec  96.2 MBytes   807 Mbits/sec    0   3.29 MBytes       
[  5] 109.00-110.00 sec  98.8 MBytes   828 Mbits/sec    0   3.41 MBytes       
[  5] 110.00-111.00 sec   102 MBytes   860 Mbits/sec    0   3.56 MBytes       
[  5] 111.00-112.00 sec   109 MBytes   912 Mbits/sec    0   3.74 MBytes       
[  5] 112.00-113.00 sec   115 MBytes   964 Mbits/sec    0   3.96 MBytes       
[  5] 113.00-114.00 sec  97.5 MBytes   818 Mbits/sec  131   3.00 MBytes       
[  5] 114.00-115.00 sec  92.5 MBytes   776 Mbits/sec    0   3.23 MBytes       
[  5] 115.00-116.00 sec  97.5 MBytes   818 Mbits/sec    0   3.42 MBytes       
[  5] 116.00-117.00 sec   105 MBytes   881 Mbits/sec    0   3.59 MBytes       
[  5] 117.00-118.00 sec   108 MBytes   902 Mbits/sec    0   3.72 MBytes       
[  5] 118.00-119.00 sec   112 MBytes   944 Mbits/sec    0   3.82 MBytes       
[  5] 119.00-120.00 sec   115 MBytes   965 Mbits/sec    0   3.90 MBytes       
- - - - - - - - - - - - - - - - - - - - - - - - -
[ ID] Interval           Transfer     Bitrate         Retr
[  5]   0.00-120.00 sec  11.4 GBytes   813 Mbits/sec  1331             sender
[  5]   0.00-120.04 sec  11.3 GBytes   812 Mbits/sec                  receiver

iperf Done.
✔️

https://grafana.wikimedia.org/d/000000377/host-overview?viewPanel=8&orgId=1&from=1612949170878&to=1612949774336&var-server=backup1001&var-datasource=thanos&var-cluster=misc

I've setup higher MTU on backup1002 and backup2001 as per @ayounsi suggestion, and will do a backup test now:

root@backup1002:~$ ip link show | grep mtu
1: lo: <LOOPBACK,UP,LOWER_UP> mtu 65536 qdisc noqueue state UNKNOWN mode DEFAULT group default qlen 1000
2: ens2f0np0: <BROADCAST,MULTICAST,UP,LOWER_UP> mtu 1500 qdisc mq state UP mode DEFAULT group default qlen 1000
3: ens2f1np1: <BROADCAST,MULTICAST> mtu 1500 qdisc noop state DOWN mode DEFAULT group default qlen 1000
✔️ root@backup1002:~$ ping -M do -s 8972 backup2002.codfw.wmnet
PING backup2002.codfw.wmnet (10.192.0.190) 8972(9000) bytes of data.
ping: local error: Message too long, mtu=1500
^C
--- backup2002.codfw.wmnet ping statistics ---
2 packets transmitted, 0 received, +2 errors, 100% packet loss, time 17ms

❌ root@backup1002:~$ ip link show | grep mtu
1: lo: <LOOPBACK,UP,LOWER_UP> mtu 65536 qdisc noqueue state UNKNOWN mode DEFAULT group default qlen 1000
2: ens2f0np0: <BROADCAST,MULTICAST,UP,LOWER_UP> mtu 1500 qdisc mq state UP mode DEFAULT group default qlen 1000
3: ens2f1np1: <BROADCAST,MULTICAST> mtu 1500 qdisc noop state DOWN mode DEFAULT group default qlen 1000
✔️ root@backup1002:~$ ip link set ens2f0np0 mtu 9000
✔️ root@backup1002:~$ ping -M do -s 8972 backup2002.codfw.wmnet
PING backup2002.codfw.wmnet (10.192.0.190) 8972(9000) bytes of data.
8980 bytes from backup2002.codfw.wmnet (10.192.0.190): icmp_seq=1 ttl=62 time=31.8 ms
8980 bytes from backup2002.codfw.wmnet (10.192.0.190): icmp_seq=2 ttl=62 time=31.8 ms
8980 bytes from backup2002.codfw.wmnet (10.192.0.190): icmp_seq=3 ttl=62 time=31.8 ms
8980 bytes from backup2002.codfw.wmnet (10.192.0.190): icmp_seq=4 ttl=62 time=31.8 ms
8980 bytes from backup2002.codfw.wmnet (10.192.0.190): icmp_seq=5 ttl=62 time=31.8 ms
8980 bytes from backup2002.codfw.wmnet (10.192.0.190): icmp_seq=6 ttl=62 time=31.8 ms
^C
--- backup2002.codfw.wmnet ping statistics ---
6 packets transmitted, 6 received, 0% packet loss, time 14ms
rtt min/avg/max/mdev = 31.775/31.799/31.824/0.015 ms

It is very early to say, but if it has any impact at all, so far it looks negative (codfw->eqiad effective bandwidth is sustained below the levels we had before and eqiad->codfw still has sub-1Gbit/s performance on the 10G link).

Screenshot from 2021-02-12 11-21-10.png (926×2 px, 92 KB)

As discussed over IRC a while ago, this is mostly due to the network being more used in the eqiad->codfw direction.

Are the backup long TCP sessions or many small ones?
It would be interesting to:
1/test BBR and
2/ Capture (with tcpdump) and analyse (with Wireshark) the TCP sessions

Are the backup long TCP sessions or many small ones?

I would have to prove myself wrong with actual sniffing, but as far as I understand, it is single TCP/IP connections (as they negotiate TLS once), once per "backup job" between the client and the storage. Unless, of course, the connection drops and it has to renegotiate it.

So I would discard at first TCP/IP connection overhead, but I would send you hard data proving it before discarding it completely.

This is not very urgent, but I am generating backups from eqiad to codfw at 173Mbps, which takes a while (vs the more reasonable 1.3Gbps in the reverse direction). Assuming this is just a bandwidth limitation, would there it be a way to understand the breakdown of what the available bandwidth is used for (not expecting a detailed service breakdown, just sets of source and destination hosts, or per port breakdowns), to understand if we are using our bandwidth efficiently? E.g. if we were using a chunk of the bandwidth available for non-realtime communication, maybe I could ask the service owner to disable temporarily a feature while backups run, as my bandwidth needs only come in bursts?

Bonus question, is there an option for some traffic shaping / QoS to remediate the above automatically?

faidon triaged this task as High priority.May 20 2021, 3:23 PM
faidon added subscribers: joanna_borun, faidon.

Given a) this was linked during budgeting in the context of of our cross-DC bandwidth and for a substantial amount of cost b) off{site,line} backups is one of our priorities, I'm setting the priority of this task to High and asking our netops folks to have a look, Cc @joanna_borun.

One of the things I raised to my manager is that this limitation means that, in the event of a cross-dc recovery is needed, under certain circumstances (eqiad -> codfw transmission) the recovery could take up to close to a week for the largest sections (es1, es2, es3), and that worries me. Is not that we get slightly worse performance, we get as low as 40MB/s bandwidth currently. Not a huge issue for backups, but it could be for an emergency recovery.

I've been looking into this issue a litte, and propose to do some tests Monday/Tuesday AM (Europe) for some comparative analysis.

A few notes:

  1. Two separate 10G transport links:
    • We have two transport links between eqiad and codfw, one from Telia the other from Lumen.
    • We run these active/active by setting equal OSPF costs.
    • So for any given flow between these sites it's difficult to say which link it has used.

Due to this I would like to test the performance, using iperf3, between backup1002 and backup2002, first over one link, and then the other. To perform this it will be required to adjust the OSPF cost on the relevant links in Netbox:

https://netbox.wikimedia.org/circuits/circuits/103/
https://netbox.wikimedia.org/circuits/circuits/28/

I would propose to increase the cost to 500 first on the Lumen circuit, to force traffic via Telia, test both ways across that, and then reverse the change, setting cost back to 340 on Lumen and setting Zayo to 500.

  1. UDP iPerf

I've found running iPerf3 in UDP mode useful in the past. This kind of test allows you to send traffic at a given rate, and assess how much of that traffic made it to the other side. This is different than the TCP mode which tries to send ever increasing levels of traffic as long as ACKs are being received from the far-end.

This can be useful for a few reasons:

  • TCP congestion control, be it Nangle, BBR or any other algorithm, is not a factor in the result.
  • It allows you to validate the sending system is capable of generating and transmitting X number of pps.
  • If end-to-end packet loss exists it can allow the link causing the loss to be isolated, we can look at graphs/usage on each link in the path to find where the packets are being dropped.

iPerf command would be something like the below, I'd propose to generate a 2G stream as a good compromise between sending enough to make the test worthwhile, and not saturating links / affecting production traffic:

iperf3 -u -b2G -i 10 -t 60 -Z -l 1460 -c x.x.x.x
  1. TCP iPerf

Bacula is using TCP afaik, so ultimately the TCP performance is what matters. I'd propose to do another iPerf3 test, using TCP this time, and take a tcpdump capture on each side during the test. To minimize the size of the resulting PCAP file I'd propose to only run it for 5 seconds:

iperf3 -Z -t5 -c x.x.x.x

Further analysis of the captured PCAP files / TCP may hopefully shed some light on the issue.

  1. Netfilter rules on backup machines.

The backup1002 and backup2002 boxes have iptables rules which do not permit the iPerf traffic as things stand. I assume these were adjusted to permit the traffic in the tests posted above?

@jcrespo, if you are ok with the proposed tests can you advise a newbie on what the best way to make these temporary adjustments is?

  1. QoS suggestion

QoS is a valuable tool in the network engineer's bag of tricks. There are very good reasons to configure it in many situations. But I am unsure if this qualifies as one.

I tend to explain QoS, at least on fixed-line packet switched networks, as a way to control what traffic your routers should DROP. This is the correct way to think about it I believe. Often times the best solution for an organization is to not drop packets, and to that end provision more bandwidth if traffic is getting dropped, rather than introducing complicated policies about what to drop.

Irregardless in this case I do not believe it would have much affect. Consider the bandwidth on the two 10G wave services between these sites for the past month:

image.png (603×1 px, 391 KB)

image.png (647×1 px, 206 KB)

In both cases the links are in moderate usage. They never approach saturation. QoS would thus not affect anything in terms of scheduling traffic to be transmitted on those links. At any given moment there is enough capacity on the links for the router to transmit all the packets it has ready to send. So it will never need to drop anything, and make a decision on what to prioritize.

  1. NUMA considerations.

This is not, I believe, an issue at all. But as I rabbit-holed on it a little I'll mention it here. I probably focused on this too much due to previous experience with NFV solutions.

I had considered was there any difference in the hardware configuration on the two backup hosts, which might result in some difference in performance. Specifically I looked at what NUMA core / CPU socket the network cards and storage controllers were connected to on each system. The results showed that in both cases the storage and network card is not connected to the same CPU socket:

cmooney@backup1002:~$ sudo lspci -vvv | egrep -A10 Ethernet\|MegaRAID | egrep Ethernet\ control\|NUMA\|MegaRAID
3b:00.0 Ethernet controller: Broadcom Limited BCM57412 NetXtreme-E 10Gb RDMA Ethernet Controller (rev 01)
	NUMA node: 0
3b:00.1 Ethernet controller: Broadcom Limited BCM57412 NetXtreme-E 10Gb RDMA Ethernet Controller (rev 01)
	NUMA node: 0
af:00.0 RAID bus controller: LSI Logic / Symbios Logic MegaRAID Tri-Mode SAS3508 (rev 01)
	NUMA node: 1

Given that both backup hosts have the same the configuration it is clearly not responsible for the difference in performance. But you can see that the NIC and the RAID controller are on NUMA node 0/1 respectively. Further reading indicates that any bottleneck, resulting from traversing the NUMA bridge / QPI, would only occur at much much higher data rates so I don't think it's playing a role here. Just mentioning it as something I looked at and ruled out.

@ayounsi interested if you had any other thoughts or comments, changes to the plan that might be better etc.

Thank you very much for your comments.

Due to this I would like to test the performance, using iperf3, between backup1002 and backup2002

The reason why I have discarded one-time-issues, like faulty hw, is because currently I am seeing the same issue when introducing backup1003 and backup2003 to the tests, and a similar problem was detected in the past on dbprov*[123] hosts, and backup*001 hosts. Obviously it could be something common, such as configuration- but I have almost discarded it being associated with a specific host or rack. The old ipref results for me point that the issue is somewhere around the network layer (in a very generic network meaning- doesn't necessarily mean it is the routers or the physical transports- could be driver, configuration, etc.)- mostly discarding a pure application or hw disk/cpu resources issue.

For the record these backup* hosts are "slow ones" regarding disk performance (reads and writes), so I would never expect high IO throughput anyway- however despite being slower than our "fast" SSD hosts, the apparent network speed difference is more impactful because they host larger datasets, and backups are one of the few services (if not the only one) that transmits larger datasets cross-dc (even if not continuously).

In both cases the links are in moderate usage. They never approach saturation.

That is super-useful, because that means the provider link was not the issue, so it must be somewhere else.

@cmooney Thanks for the help. Having even another pair of eyes looking will help a lot because even if it is something silly like "the network card has negotiated 1Gb link instead of 10Gb". Let's talk next week to coordinate the tests. I have important backups ongoing, and because they take so much time, I prefer if they could finish before starting tweaking options. Once they finish, we will be able to do any kind of tweaking and testing, open ports and so on, even disruptive tests (as long as they don't delete existing files on the hosts :-P). Will ping you on Tuesday.

Ok @jcrespo sounds like a plan. And thanks for the extra info, indeed it does seem to rule out a host or application-specific problem.

In terms of the WAN links I wouldn't rule them out 100%. They are not saturated, so that's not the problem, but it is still possible one or both have some kind of issue or constraint along the carrier's path. The UDP iPerf test should reveal this if that is the case.

Let's pick it up again Tuesday.

In terms of the WAN links I wouldn't rule them out 100%.

Yes, sorry, my bad. What I meant is that when I first talk to Arzhel, he mentioned there was limited bandwith cross-DC (compared to within-DC, where we fully controlled the available resources), and that it was not easy/cheap to upgrade that. I took away from that conversation (mistakenly- because how I understood it) that there was only so much bandwidth we could use, and that was the cause of this. I think I mixed this issue and other ongoing conversations for offsite backups. But from your words I understand that saturation is not, at least theoretically, an active issue, but of course the transports could also have some limitation/noise/degradation/etc. Sorry for not being specific- networking is not my strong suit.

You may be upon something. UDP transmission speed seems equivalent in both ways:

(there was the following warning in the client, in case it was relevant):

warning: UDP block size 1460 exceeds TCP MSS 1448, may result in fragmentation / drops

eqiad -> codfw (backup1003 -> backup2003)

iperf3 -u -b2G -i 10 -t 60 -Z -l 1460 -c 10.192.32.35
-------
iperf3 -s
-----------------------------------------------------------
Server listening on 5201
-----------------------------------------------------------
Accepted connection from 10.64.16.107, port 54406
[  5] local 10.192.32.35 port 5201 connected to 10.64.16.107 port 59469
[ ID] Interval           Transfer     Bitrate         Jitter    Lost/Total Datagrams
[  5]   0.00-1.00   sec   208 MBytes  1.74 Gbits/sec  0.001 ms  9295/158690 (5.9%)  
[  5]   1.00-2.00   sec   226 MBytes  1.90 Gbits/sec  0.006 ms  8495/171150 (5%)  
[  5]   2.00-3.00   sec   229 MBytes  1.92 Gbits/sec  0.001 ms  6973/171402 (4.1%)  
[  5]   3.00-4.00   sec   222 MBytes  1.86 Gbits/sec  0.002 ms  11749/171301 (6.9%)  
[  5]   4.00-5.00   sec   225 MBytes  1.89 Gbits/sec  0.001 ms  9504/171040 (5.6%)  
[  5]   5.00-6.00   sec   223 MBytes  1.87 Gbits/sec  0.005 ms  11325/171435 (6.6%)  
[  5]   6.00-7.00   sec   227 MBytes  1.91 Gbits/sec  0.009 ms  7771/170911 (4.5%)  
[  5]   7.00-8.00   sec   230 MBytes  1.93 Gbits/sec  0.002 ms  6455/171631 (3.8%)  
[  5]   8.00-9.00   sec   221 MBytes  1.85 Gbits/sec  0.002 ms  12678/171131 (7.4%)  
[  5]   9.00-10.00  sec   230 MBytes  1.93 Gbits/sec  0.003 ms  5943/171211 (3.5%)  
[  5]  10.00-11.00  sec   228 MBytes  1.91 Gbits/sec  0.001 ms  7845/171350 (4.6%)  
[  5]  11.00-12.00  sec   234 MBytes  1.96 Gbits/sec  0.003 ms  2861/170956 (1.7%)  
[  5]  12.00-13.00  sec   230 MBytes  1.93 Gbits/sec  0.003 ms  5936/171336 (3.5%)  
[  5]  13.00-14.00  sec   223 MBytes  1.87 Gbits/sec  0.002 ms  11032/171300 (6.4%)  
[  5]  14.00-15.00  sec   229 MBytes  1.93 Gbits/sec  0.003 ms  5461/170281 (3.2%)  
[  5]  15.00-16.00  sec   227 MBytes  1.91 Gbits/sec  0.008 ms  8897/172144 (5.2%)  
[  5]  16.00-17.00  sec   226 MBytes  1.90 Gbits/sec  0.005 ms  8994/171266 (5.3%)  
[  5]  17.00-18.00  sec   225 MBytes  1.89 Gbits/sec  0.001 ms  9409/171331 (5.5%)  
[  5]  18.00-19.00  sec   224 MBytes  1.88 Gbits/sec  0.002 ms  9974/171116 (5.8%)  
[  5]  19.00-20.00  sec   227 MBytes  1.90 Gbits/sec  0.001 ms  8440/171320 (4.9%)  
[  5]  20.00-21.00  sec   228 MBytes  1.91 Gbits/sec  0.006 ms  7742/171255 (4.5%)  
[  5]  21.00-22.00  sec   227 MBytes  1.90 Gbits/sec  0.004 ms  8281/171114 (4.8%)  
[  5]  22.00-23.00  sec   227 MBytes  1.90 Gbits/sec  0.003 ms  8588/171264 (5%)  
[  5]  23.00-24.00  sec   228 MBytes  1.91 Gbits/sec  0.002 ms  7525/171237 (4.4%)  
[  5]  24.00-25.00  sec   229 MBytes  1.92 Gbits/sec  0.002 ms  7004/171301 (4.1%)  
[  5]  25.00-26.00  sec   229 MBytes  1.92 Gbits/sec  0.006 ms  6365/171026 (3.7%)  
[  5]  26.00-27.00  sec   228 MBytes  1.91 Gbits/sec  0.005 ms  7722/171465 (4.5%)  
[  5]  27.00-28.00  sec   223 MBytes  1.87 Gbits/sec  0.002 ms  11139/171119 (6.5%)  
[  5]  28.00-29.00  sec   225 MBytes  1.89 Gbits/sec  0.005 ms  9836/171256 (5.7%)  
[  5]  29.00-30.00  sec   224 MBytes  1.88 Gbits/sec  0.004 ms  10532/171299 (6.1%)  
[  5]  30.00-31.00  sec   217 MBytes  1.82 Gbits/sec  0.006 ms  15255/171237 (8.9%)  
[  5]  31.00-32.00  sec   192 MBytes  1.61 Gbits/sec  0.004 ms  32886/170937 (19%)  
[  5]  32.00-33.00  sec   211 MBytes  1.77 Gbits/sec  0.003 ms  19672/171555 (11%)  
[  5]  33.00-34.00  sec   200 MBytes  1.68 Gbits/sec  0.003 ms  27111/171093 (16%)  
[  5]  34.00-35.00  sec   229 MBytes  1.92 Gbits/sec  0.008 ms  6828/171210 (4%)  
[  5]  35.00-36.00  sec   229 MBytes  1.92 Gbits/sec  0.006 ms  6936/171298 (4%)  
[  5]  36.00-37.00  sec   215 MBytes  1.80 Gbits/sec  0.018 ms  16865/171128 (9.9%)  
[  5]  37.00-38.00  sec   193 MBytes  1.62 Gbits/sec  0.005 ms  32581/171254 (19%)  
[  5]  38.00-39.00  sec   195 MBytes  1.64 Gbits/sec  0.025 ms  31178/171334 (18%)  
[  5]  39.00-40.00  sec   205 MBytes  1.72 Gbits/sec  0.007 ms  23750/171116 (14%)  
[  5]  40.00-41.00  sec   228 MBytes  1.91 Gbits/sec  0.009 ms  7431/171379 (4.3%)  
[  5]  41.00-42.00  sec   228 MBytes  1.91 Gbits/sec  0.005 ms  7404/171058 (4.3%)  
[  5]  42.00-43.00  sec   230 MBytes  1.93 Gbits/sec  0.001 ms  6474/171347 (3.8%)  
[  5]  43.00-44.00  sec   228 MBytes  1.91 Gbits/sec  0.002 ms  7184/170988 (4.2%)  
[  5]  44.00-45.00  sec   229 MBytes  1.92 Gbits/sec  0.001 ms  6690/171209 (3.9%)  
[  5]  45.00-46.00  sec   217 MBytes  1.82 Gbits/sec  0.010 ms  15540/171451 (9.1%)  
[  5]  46.00-47.00  sec   201 MBytes  1.68 Gbits/sec  0.009 ms  26924/171065 (16%)  
[  5]  47.00-48.00  sec   192 MBytes  1.61 Gbits/sec  0.004 ms  33313/171498 (19%)  
[  5]  48.00-49.00  sec   188 MBytes  1.58 Gbits/sec  0.007 ms  35973/171260 (21%)  
[  5]  49.00-50.00  sec   193 MBytes  1.62 Gbits/sec  0.003 ms  32375/171214 (19%)  
[  5]  50.00-51.00  sec   225 MBytes  1.89 Gbits/sec  0.006 ms  9722/171133 (5.7%)  
[  5]  51.00-52.00  sec   228 MBytes  1.92 Gbits/sec  0.006 ms  7282/171347 (4.2%)  
[  5]  52.00-53.00  sec   224 MBytes  1.88 Gbits/sec  0.005 ms  10563/171132 (6.2%)  
[  5]  53.00-54.00  sec   224 MBytes  1.88 Gbits/sec  0.001 ms  9984/170918 (5.8%)  
[  5]  54.00-55.00  sec   226 MBytes  1.90 Gbits/sec  0.008 ms  9126/171392 (5.3%)  
[  5]  55.00-56.00  sec   226 MBytes  1.90 Gbits/sec  0.008 ms  9032/171514 (5.3%)  
[  5]  56.00-57.00  sec   224 MBytes  1.88 Gbits/sec  0.009 ms  10328/171194 (6%)  
[  5]  57.00-58.00  sec   224 MBytes  1.88 Gbits/sec  0.001 ms  10531/171209 (6.2%)  
[  5]  58.00-59.00  sec   222 MBytes  1.86 Gbits/sec  0.004 ms  11520/171158 (6.7%)  
[  5]  59.00-60.00  sec   213 MBytes  1.79 Gbits/sec  0.005 ms  18250/171313 (11%)  
[  5]  60.00-60.07  sec  16.6 MBytes  1.94 Gbits/sec  0.004 ms  432/12353 (3.5%)  
- - - - - - - - - - - - - - - - - - - - - - - - -
[ ID] Interval           Transfer     Bitrate         Jitter    Lost/Total Datagrams
[  5]   0.00-60.07  sec  12.9 GBytes  1.85 Gbits/sec  0.004 ms  752911/10273932 (7.3%)  receiver

codfw -> eqiad

eqiad -> codfw (backup1003 -> backup2003)
iperf3 -u -b2G -i 10 -t 60 -Z -l 1460 -c 10.64.16.107
-----
iperf3 -s
-----------------------------------------------------------
Server listening on 5201
-----------------------------------------------------------
Accepted connection from 10.192.32.35, port 48314
[  5] local 10.64.16.107 port 5201 connected to 10.192.32.35 port 59172
[ ID] Interval           Transfer     Bitrate         Jitter    Lost/Total Datagrams
[  5]   0.00-1.00   sec   209 MBytes  1.75 Gbits/sec  0.007 ms  8891/158837 (5.6%)  
[  5]   1.00-2.00   sec   230 MBytes  1.93 Gbits/sec  0.001 ms  5701/171192 (3.3%)  
[  5]   2.00-3.00   sec   231 MBytes  1.94 Gbits/sec  0.003 ms  5547/171358 (3.2%)  
[  5]   3.00-4.00   sec   231 MBytes  1.93 Gbits/sec  0.001 ms  5754/171316 (3.4%)  
[  5]   4.00-5.00   sec   225 MBytes  1.89 Gbits/sec  0.009 ms  9243/171079 (5.4%)  
[  5]   5.00-6.00   sec   232 MBytes  1.95 Gbits/sec  0.002 ms  4306/171225 (2.5%)  
[  5]   6.00-7.00   sec   227 MBytes  1.91 Gbits/sec  0.005 ms  7906/171081 (4.6%)  
[  5]   7.00-8.00   sec   228 MBytes  1.91 Gbits/sec  0.001 ms  7781/171455 (4.5%)  
[  5]   8.00-9.00   sec   224 MBytes  1.88 Gbits/sec  0.007 ms  10038/171014 (5.9%)  
[  5]   9.00-10.00  sec   230 MBytes  1.93 Gbits/sec  0.005 ms  5815/171358 (3.4%)  
[  5]  10.00-11.00  sec   228 MBytes  1.91 Gbits/sec  0.001 ms  7879/171292 (4.6%)  
[  5]  11.00-12.00  sec   226 MBytes  1.90 Gbits/sec  0.001 ms  8944/171348 (5.2%)  
[  5]  12.00-13.00  sec   225 MBytes  1.89 Gbits/sec  0.001 ms  9614/171182 (5.6%)  
[  5]  13.00-14.00  sec   227 MBytes  1.90 Gbits/sec  0.001 ms  8490/171172 (5%)  
[  5]  14.00-15.00  sec   231 MBytes  1.93 Gbits/sec  0.002 ms  5635/171284 (3.3%)  
[  5]  15.00-16.00  sec   229 MBytes  1.92 Gbits/sec  0.005 ms  6665/171117 (3.9%)  
[  5]  16.00-17.00  sec   227 MBytes  1.91 Gbits/sec  0.007 ms  8076/171310 (4.7%)  
[  5]  17.00-18.00  sec   226 MBytes  1.90 Gbits/sec  0.002 ms  8810/171099 (5.1%)  
[  5]  18.00-19.00  sec   229 MBytes  1.92 Gbits/sec  0.005 ms  6504/171178 (3.8%)  
[  5]  19.00-20.00  sec   228 MBytes  1.91 Gbits/sec  0.003 ms  7900/171478 (4.6%)  
[  5]  20.00-21.00  sec   227 MBytes  1.91 Gbits/sec  0.001 ms  7917/171195 (4.6%)  
[  5]  21.00-22.00  sec   228 MBytes  1.91 Gbits/sec  0.001 ms  7343/171225 (4.3%)  
[  5]  22.00-23.00  sec   228 MBytes  1.91 Gbits/sec  0.003 ms  7589/171273 (4.4%)  
[  5]  23.00-24.00  sec   226 MBytes  1.89 Gbits/sec  0.005 ms  9095/171298 (5.3%)  
[  5]  24.00-25.00  sec   229 MBytes  1.92 Gbits/sec  0.001 ms  6456/171167 (3.8%)  
[  5]  25.00-26.00  sec   227 MBytes  1.90 Gbits/sec  0.001 ms  8258/171232 (4.8%)  
[  5]  26.00-27.00  sec   216 MBytes  1.81 Gbits/sec  0.011 ms  15738/171073 (9.2%)  
[  5]  27.00-28.00  sec   188 MBytes  1.58 Gbits/sec  0.016 ms  36061/171335 (21%)  
[  5]  28.00-29.00  sec   176 MBytes  1.48 Gbits/sec  0.007 ms  44565/171104 (26%)  
[  5]  29.00-30.00  sec   197 MBytes  1.66 Gbits/sec  0.013 ms  29576/171314 (17%)  
[  5]  30.00-31.00  sec   172 MBytes  1.45 Gbits/sec  0.008 ms  47561/171279 (28%)  
[  5]  31.00-32.00  sec   200 MBytes  1.68 Gbits/sec  0.006 ms  27257/171082 (16%)  
[  5]  32.00-33.00  sec   193 MBytes  1.62 Gbits/sec  0.007 ms  33042/171427 (19%)  
[  5]  33.00-34.00  sec   198 MBytes  1.67 Gbits/sec  0.012 ms  28646/171207 (17%)  
[  5]  34.00-35.00  sec   186 MBytes  1.56 Gbits/sec  0.008 ms  37669/171082 (22%)  
[  5]  35.00-36.00  sec   194 MBytes  1.63 Gbits/sec  0.004 ms  32158/171428 (19%)  
[  5]  36.00-37.00  sec   206 MBytes  1.72 Gbits/sec  0.009 ms  23557/171199 (14%)  
[  5]  37.00-38.00  sec   194 MBytes  1.63 Gbits/sec  0.006 ms  31920/171131 (19%)  
[  5]  38.00-39.00  sec   201 MBytes  1.69 Gbits/sec  0.008 ms  26672/171268 (16%)  
[  5]  39.00-40.00  sec   214 MBytes  1.79 Gbits/sec  0.001 ms  17666/171032 (10%)  
[  5]  40.00-41.00  sec   226 MBytes  1.89 Gbits/sec  0.001 ms  9446/171517 (5.5%)  
[  5]  41.00-42.00  sec   231 MBytes  1.94 Gbits/sec  0.002 ms  5232/171175 (3.1%)  
[  5]  42.00-43.00  sec   230 MBytes  1.93 Gbits/sec  0.001 ms  6292/171314 (3.7%)  
[  5]  43.00-44.00  sec   224 MBytes  1.88 Gbits/sec  0.009 ms  10446/171164 (6.1%)  
[  5]  44.00-45.00  sec   222 MBytes  1.86 Gbits/sec  0.006 ms  11385/170881 (6.7%)  
[  5]  45.00-46.00  sec   225 MBytes  1.89 Gbits/sec  0.002 ms  9953/171626 (5.8%)  
[  5]  46.00-47.00  sec   225 MBytes  1.88 Gbits/sec  0.008 ms  9876/171124 (5.8%)  
[  5]  47.00-48.00  sec   227 MBytes  1.90 Gbits/sec  0.004 ms  8404/171088 (4.9%)  
[  5]  48.00-49.00  sec   228 MBytes  1.91 Gbits/sec  0.003 ms  7804/171343 (4.6%)  
[  5]  49.00-50.00  sec   224 MBytes  1.88 Gbits/sec  0.005 ms  10449/171240 (6.1%)  
[  5]  50.00-51.00  sec   229 MBytes  1.92 Gbits/sec  0.006 ms  6839/171365 (4%)  
[  5]  51.00-52.00  sec   222 MBytes  1.86 Gbits/sec  0.003 ms  12114/171226 (7.1%)  
[  5]  52.00-53.00  sec   217 MBytes  1.82 Gbits/sec  0.008 ms  15444/171160 (9%)  
[  5]  53.00-54.00  sec   226 MBytes  1.89 Gbits/sec  0.008 ms  9264/171341 (5.4%)  
[  5]  54.00-55.00  sec   229 MBytes  1.92 Gbits/sec  0.006 ms  6589/171210 (3.8%)  
[  5]  55.00-56.00  sec   227 MBytes  1.90 Gbits/sec  0.008 ms  8401/171242 (4.9%)  
[  5]  56.00-57.00  sec   225 MBytes  1.89 Gbits/sec  0.002 ms  9309/171249 (5.4%)  
[  5]  57.00-58.00  sec   230 MBytes  1.93 Gbits/sec  0.007 ms  6203/171165 (3.6%)  
[  5]  58.00-59.00  sec   224 MBytes  1.88 Gbits/sec  0.001 ms  10192/171233 (6%)  
[  5]  59.00-60.00  sec   227 MBytes  1.90 Gbits/sec  0.001 ms  8526/171321 (5%)  
[  5]  60.00-60.07  sec  15.7 MBytes  1.84 Gbits/sec  0.002 ms  976/12232 (8%)  
- - - - - - - - - - - - - - - - - - - - - - - - -
[ ID] Interval           Transfer     Bitrate         Jitter    Lost/Total Datagrams
[  5]   0.00-60.07  sec  12.9 GBytes  1.84 Gbits/sec  0.002 ms  811389/10273942 (7.9%)  receiver

I would like to run it for longer, however, as the top speed on the metrics seem to be different (could be a metrics artifact):

Screenshot from 2021-05-25 16-47-09.png (1×2 px, 97 KB)

Screenshot from 2021-05-25 16-45-48.png (1×2 px, 94 KB)

https://grafana.wikimedia.org/d/000000377/host-overview?viewPanel=8&orgId=1&from=1621952895685&to=1621953273031&var-server=backup1003&var-datasource=thanos&var-cluster=misc
https://grafana.wikimedia.org/d/000000377/host-overview?viewPanel=8&orgId=1&from=1621952895685&to=1621953273031&var-server=backup2003&var-datasource=thanos&var-cluster=misc

Compare if I run the above with TCP (minus the -u), where the difference can be appreciated in one way:

eqiad->codfw
iperf3 -b2G -i 10 -t 60 -Z -l 1460 -c 10.192.32.35
Connecting to host 10.192.32.35, port 5201
[  5] local 10.64.16.107 port 54460 connected to 10.192.32.35 port 5201
[ ID] Interval           Transfer     Bitrate         Retr  Cwnd
[  5]   0.00-10.00  sec   799 MBytes   670 Mbits/sec  1031   2.60 MBytes       
[  5]  10.00-20.00  sec   388 MBytes   325 Mbits/sec  131   1.18 MBytes       
[  5]  20.00-30.00  sec   376 MBytes   315 Mbits/sec  168   1.30 MBytes       
[  5]  30.00-40.00  sec   382 MBytes   320 Mbits/sec   32   1.26 MBytes       
[  5]  40.00-50.00  sec   360 MBytes   302 Mbits/sec   46   1.26 MBytes       
[  5]  50.00-60.00  sec   395 MBytes   331 Mbits/sec    0   1.42 MBytes       
- - - - - - - - - - - - - - - - - - - - - - - - -
[ ID] Interval           Transfer     Bitrate         Retr
[  5]   0.00-60.00  sec  2.64 GBytes   377 Mbits/sec  1408             sender
[  5]   0.00-60.04  sec  2.63 GBytes   376 Mbits/sec                  receiver

iperf Done.

---
iperf3 -s
-----------------------------------------------------------
Server listening on 5201
-----------------------------------------------------------
Accepted connection from 10.64.16.107, port 54458
[  5] local 10.192.32.35 port 5201 connected to 10.64.16.107 port 54460
[ ID] Interval           Transfer     Bitrate
[  5]   0.00-1.00   sec   113 MBytes   944 Mbits/sec                  
[  5]   1.00-2.00   sec  73.4 MBytes   616 Mbits/sec                  
[  5]   2.00-3.00   sec  69.4 MBytes   582 Mbits/sec                  
[  5]   3.00-4.00   sec  72.6 MBytes   609 Mbits/sec                  
[  5]   4.00-5.00   sec  72.9 MBytes   611 Mbits/sec                  
[  5]   5.00-6.00   sec  76.8 MBytes   644 Mbits/sec                  
[  5]   6.00-7.00   sec  75.7 MBytes   635 Mbits/sec                  
[  5]   7.00-8.00   sec  78.6 MBytes   659 Mbits/sec                  
[  5]   8.00-9.00   sec  79.0 MBytes   663 Mbits/sec                  
[  5]   9.00-10.00  sec  77.0 MBytes   646 Mbits/sec                  
[  5]  10.00-11.00  sec  75.1 MBytes   630 Mbits/sec                  
[  5]  11.00-12.00  sec  40.6 MBytes   341 Mbits/sec                  
[  5]  12.00-13.00  sec  31.5 MBytes   264 Mbits/sec                  
[  5]  13.00-14.00  sec  31.4 MBytes   264 Mbits/sec                  
[  5]  14.00-15.00  sec  33.9 MBytes   285 Mbits/sec                  
[  5]  15.00-16.00  sec  34.7 MBytes   291 Mbits/sec                  
[  5]  16.00-17.00  sec  34.6 MBytes   290 Mbits/sec                  
[  5]  17.00-18.00  sec  35.8 MBytes   301 Mbits/sec                  
[  5]  18.00-19.00  sec  34.8 MBytes   292 Mbits/sec                  
[  5]  19.00-20.00  sec  35.9 MBytes   301 Mbits/sec                  
[  5]  20.00-21.00  sec  35.7 MBytes   299 Mbits/sec                  
[  5]  21.00-22.00  sec  35.3 MBytes   296 Mbits/sec                  
[  5]  22.00-23.00  sec  36.9 MBytes   309 Mbits/sec                  
[  5]  23.00-24.00  sec  36.4 MBytes   305 Mbits/sec                  
[  5]  24.00-25.00  sec  38.3 MBytes   321 Mbits/sec                  
[  5]  25.00-26.00  sec  39.0 MBytes   327 Mbits/sec                  
[  5]  26.00-27.00  sec  41.4 MBytes   347 Mbits/sec                  
[  5]  27.00-28.00  sec  41.1 MBytes   345 Mbits/sec                  
[  5]  28.00-29.00  sec  33.7 MBytes   283 Mbits/sec                  
[  5]  29.00-30.00  sec  38.2 MBytes   320 Mbits/sec                  
[  5]  30.00-31.00  sec  39.8 MBytes   334 Mbits/sec                  
[  5]  31.00-32.00  sec  42.4 MBytes   355 Mbits/sec                  
[  5]  32.00-33.00  sec  44.1 MBytes   370 Mbits/sec                  
[  5]  33.00-34.00  sec  38.5 MBytes   323 Mbits/sec                  
[  5]  34.00-35.00  sec  33.6 MBytes   282 Mbits/sec                  
[  5]  35.00-36.00  sec  34.6 MBytes   291 Mbits/sec                  
[  5]  36.00-37.00  sec  36.4 MBytes   305 Mbits/sec                  
[  5]  37.00-38.00  sec  37.5 MBytes   315 Mbits/sec                  
[  5]  38.00-39.00  sec  36.8 MBytes   309 Mbits/sec                  
[  5]  39.00-40.00  sec  38.2 MBytes   320 Mbits/sec                  
[  5]  40.00-41.00  sec  37.2 MBytes   312 Mbits/sec                  
[  5]  41.00-42.00  sec  38.1 MBytes   320 Mbits/sec                  
[  5]  42.00-43.00  sec  37.4 MBytes   314 Mbits/sec                  
[  5]  43.00-44.00  sec  38.1 MBytes   320 Mbits/sec                  
[  5]  44.00-45.00  sec  38.7 MBytes   325 Mbits/sec                  
[  5]  45.00-46.00  sec  28.8 MBytes   241 Mbits/sec                  
[  5]  46.00-47.00  sec  32.5 MBytes   273 Mbits/sec                  
[  5]  47.00-48.00  sec  33.9 MBytes   284 Mbits/sec                  
[  5]  48.00-49.00  sec  36.8 MBytes   309 Mbits/sec                  
[  5]  49.00-50.00  sec  36.9 MBytes   309 Mbits/sec                  
[  5]  50.00-51.00  sec  38.8 MBytes   325 Mbits/sec                  
[  5]  51.00-52.00  sec  39.2 MBytes   329 Mbits/sec                  
[  5]  52.00-53.00  sec  38.3 MBytes   322 Mbits/sec                  
[  5]  53.00-54.00  sec  39.5 MBytes   331 Mbits/sec                  
[  5]  54.00-55.00  sec  38.3 MBytes   321 Mbits/sec                  
[  5]  55.00-56.00  sec  39.6 MBytes   332 Mbits/sec                  
[  5]  56.00-57.00  sec  39.4 MBytes   330 Mbits/sec                  
[  5]  57.00-58.00  sec  39.4 MBytes   330 Mbits/sec                  
[  5]  58.00-59.00  sec  41.1 MBytes   345 Mbits/sec                  
[  5]  59.00-60.00  sec  41.1 MBytes   344 Mbits/sec                  
[  5]  60.00-60.04  sec  2.71 MBytes   565 Mbits/sec                  
- - - - - - - - - - - - - - - - - - - - - - - - -
[ ID] Interval           Transfer     Bitrate
[  5]   0.00-60.04  sec  2.63 GBytes   376 Mbits/sec                  receiver
codfw->eqiad
iperf3 -b2G -i 10 -t 60 -Z -l 1460 -c 10.64.16.107
Connecting to host 10.64.16.107, port 5201
[  5] local 10.192.32.35 port 48358 connected to 10.64.16.107 port 5201
[ ID] Interval           Transfer     Bitrate         Retr  Cwnd
[  5]   0.00-10.00  sec  2.33 GBytes  2.00 Gbits/sec    0   15.9 MBytes       
[  5]  10.00-20.00  sec  2.33 GBytes  2.00 Gbits/sec    0   15.9 MBytes       
[  5]  20.00-30.00  sec  2.33 GBytes  2.00 Gbits/sec    0   15.9 MBytes       
[  5]  30.00-40.00  sec  2.33 GBytes  2.00 Gbits/sec    0   15.9 MBytes       
[  5]  40.00-50.00  sec  2.33 GBytes  2.00 Gbits/sec    0   15.9 MBytes       
[  5]  50.00-60.00  sec  2.33 GBytes  2.00 Gbits/sec    0   15.9 MBytes       
- - - - - - - - - - - - - - - - - - - - - - - - -
[ ID] Interval           Transfer     Bitrate         Retr
[  5]   0.00-60.00  sec  14.0 GBytes  2.00 Gbits/sec    0             sender
[  5]   0.00-60.04  sec  14.0 GBytes  2.00 Gbits/sec                  receiver

iperf Done.
--
iperf3 -s
-----------------------------------------------------------
Server listening on 5201
-----------------------------------------------------------
Accepted connection from 10.192.32.35, port 48352
[  5] local 10.64.16.107 port 5201 connected to 10.192.32.35 port 48358
[ ID] Interval           Transfer     Bitrate
[  5]   0.00-1.00   sec   166 MBytes  1.40 Gbits/sec                  
[  5]   1.00-2.00   sec   247 MBytes  2.08 Gbits/sec                  
[  5]   2.00-3.00   sec   248 MBytes  2.08 Gbits/sec                  
[  5]   3.00-4.00   sec   248 MBytes  2.08 Gbits/sec                  
[  5]   4.00-5.00   sec   247 MBytes  2.07 Gbits/sec                  
[  5]   5.00-6.00   sec   249 MBytes  2.09 Gbits/sec                  
[  5]   6.00-7.00   sec   247 MBytes  2.07 Gbits/sec                  
[  5]   7.00-8.00   sec   246 MBytes  2.06 Gbits/sec                  
[  5]   8.00-9.00   sec   238 MBytes  1.99 Gbits/sec                  
[  5]   9.00-10.00  sec   239 MBytes  2.00 Gbits/sec                  
[  5]  10.00-11.00  sec   238 MBytes  2.00 Gbits/sec                  
[  5]  11.00-12.00  sec   239 MBytes  2.00 Gbits/sec                  
[  5]  12.00-13.00  sec   238 MBytes  2.00 Gbits/sec                  
[  5]  13.00-14.00  sec   238 MBytes  2.00 Gbits/sec                  
[  5]  14.00-15.00  sec   238 MBytes  2.00 Gbits/sec                  
[  5]  15.00-16.00  sec   238 MBytes  2.00 Gbits/sec                  
[  5]  16.00-17.00  sec   239 MBytes  2.00 Gbits/sec                  
[  5]  17.00-18.00  sec   238 MBytes  2.00 Gbits/sec                  
[  5]  18.00-19.00  sec   238 MBytes  2.00 Gbits/sec                  
[  5]  19.00-20.00  sec   238 MBytes  2.00 Gbits/sec                  
[  5]  20.00-21.00  sec   238 MBytes  2.00 Gbits/sec                  
[  5]  21.00-22.00  sec   239 MBytes  2.00 Gbits/sec                  
[  5]  22.00-23.00  sec   238 MBytes  2.00 Gbits/sec                  
[  5]  23.00-24.00  sec   239 MBytes  2.00 Gbits/sec                  
[  5]  24.00-25.00  sec   238 MBytes  2.00 Gbits/sec                  
[  5]  25.00-26.00  sec   239 MBytes  2.00 Gbits/sec                  
[  5]  26.00-27.00  sec   238 MBytes  2.00 Gbits/sec                  
[  5]  27.00-28.00  sec   238 MBytes  2.00 Gbits/sec                  
[  5]  28.00-29.00  sec   238 MBytes  2.00 Gbits/sec                  
[  5]  29.00-30.00  sec   238 MBytes  2.00 Gbits/sec                  
[  5]  30.00-31.00  sec   238 MBytes  2.00 Gbits/sec                  
[  5]  31.00-32.00  sec   239 MBytes  2.00 Gbits/sec                  
[  5]  32.00-33.00  sec   238 MBytes  2.00 Gbits/sec                  
[  5]  33.00-34.00  sec   238 MBytes  2.00 Gbits/sec                  
[  5]  34.00-35.00  sec   238 MBytes  2.00 Gbits/sec                  
[  5]  35.00-36.00  sec   238 MBytes  2.00 Gbits/sec                  
[  5]  36.00-37.00  sec   239 MBytes  2.00 Gbits/sec                  
[  5]  37.00-38.00  sec   238 MBytes  2.00 Gbits/sec                  
[  5]  38.00-39.00  sec   238 MBytes  2.00 Gbits/sec                  
[  5]  39.00-40.00  sec   238 MBytes  2.00 Gbits/sec                  
[  5]  40.00-41.00  sec   239 MBytes  2.00 Gbits/sec                  
[  5]  41.00-42.00  sec   238 MBytes  2.00 Gbits/sec                  
[  5]  42.00-43.00  sec   238 MBytes  2.00 Gbits/sec                  
[  5]  43.00-44.00  sec   238 MBytes  2.00 Gbits/sec                  
[  5]  44.00-45.00  sec   238 MBytes  2.00 Gbits/sec                  
[  5]  45.00-46.00  sec   238 MBytes  2.00 Gbits/sec                  
[  5]  46.00-47.00  sec   239 MBytes  2.00 Gbits/sec                  
[  5]  47.00-48.00  sec   238 MBytes  2.00 Gbits/sec                  
[  5]  48.00-49.00  sec   238 MBytes  1.99 Gbits/sec                  
[  5]  49.00-50.00  sec   239 MBytes  2.00 Gbits/sec                  
[  5]  50.00-51.00  sec   239 MBytes  2.01 Gbits/sec                  
[  5]  51.00-52.00  sec   238 MBytes  2.00 Gbits/sec                  
[  5]  52.00-53.00  sec   238 MBytes  2.00 Gbits/sec                  
[  5]  53.00-54.00  sec   239 MBytes  2.00 Gbits/sec                  
[  5]  54.00-55.00  sec   238 MBytes  2.00 Gbits/sec                  
[  5]  55.00-56.00  sec   238 MBytes  2.00 Gbits/sec                  
[  5]  56.00-57.00  sec   238 MBytes  2.00 Gbits/sec                  
[  5]  57.00-58.00  sec   239 MBytes  2.00 Gbits/sec                  
[  5]  58.00-59.00  sec   238 MBytes  2.00 Gbits/sec                  
[  5]  59.00-60.00  sec   238 MBytes  2.00 Gbits/sec                  
[  5]  60.00-60.04  sec  9.57 MBytes  2.01 Gbits/sec                  
- - - - - - - - - - - - - - - - - - - - - - - - -
[ ID] Interval           Transfer     Bitrate
[  5]   0.00-60.04  sec  14.0 GBytes  2.00 Gbits/sec                  receiver

@jcrespo, if you are ok with the proposed tests can you advise a newbie on what the best way to make these temporary adjustments is?

I just run as root:

iptables -I INPUT -p tcp -s <ipv4 source> --dport 5201 -j ACCEPT
iptables -I INPUT -p udp -s <ipv4 source> --dport 5201 -j ACCEPT

on the server side of the test.

As long as the ipv4 source is very restricted (1 host only wer roots control) and on a port that nobody will use (iperf3's default seems ok), it should be safe- the next time puppet runs it should clear those lines, but allow ongoing connections. I am using backup1003 and backup2003 as they are our "latest and bestest" backup hosts for testing.

We don't care about ipv6 for now, we have delayed a migration there and we don't want additional overhead for now (ipv6 dns resolution in a badly configured dual stack client).

Note there is likely to be high traffic on Wednesday GMT from ~2 am due to weekly backup. No problem experimenting there at that time, but may affect available bandwidth, while now it is mostly idle.

backups hosts happen to have a generous scratching area, I have left on backup1003:/srv and backup2003:/srv 2 files each, tcpdump_0001.pcap and tcpdump_0002.pcap of around 1 GB each*, #1 containing the capture of iperf3 in the eqiad->codfw direction, and #2 for the oposite direction.

Advice on what/how to search there? @cmooney

(*) - Well more like 235MB for #1 and 1GB for #2 for obvious reasons :-).

Ok thanks for the update, and confirmation that it's ok to to add those temp iptables rules if needed.

Your results are definitely interesting. Some packet loss at 2G with the UDP test alright, but the loss is relatively even in both directions.

Running longer is best advised when looking at resulting throughput graphs. Due to how often they sample the packets through the network you'll often have an averaging, and the amount of that can vary depending on when the tests start/end versus when interfaces are polled. So running for an extended time can help with that.

I notice on the TCP test your congestion window opens high (15.9Mbytes) on the codfw client and stays at that. On the poorer results, from eqiad, it starts at 2.6Mbyte but goes down (suggesting possibly that some packets aren't ACKed and had to be retransmitted).

I will download the PCAP files and see if I can spot anything there that might shed more light. I might run one or two tests between these hosts also if that is ok.

I might run one or two tests between these hosts also if that is ok.

Absolutely no problem, only check the warning I did about backup traffic between some hosts starting at some point during my night (not because that is any issue while it- testing can continue-, but to make sure it doesn't affect results).

Thanks Jamie I've been digging into this.

Looking at the PCAPs, and even the iperf cli output, it's clear there are some packets dropped between eqiad and codfw (you can see the retransmits / Retr are 0 in the codfw to eqiad direction, but there are a small number in the opposite direction). Drilling down you can see in tcpdump_0001.pcap from backup2003, at packet 256, that some previous segments have been lost. This results in backup2003 (in packets 259-261) sending selective ACKs to tell backup1003 it didn't get everything. tcpdump_0001.pcap from backup1003 shows these SACKs are received (packets 354-356), and backup1003 then re-sends a bunch of segments again (packets 362-365 for example).

While the amount of loss is low, TCP is very susceptible to such drops, you can see the window size does the normal ramp-up in the below graph, but then it levels out, and gets knocked back a few times on the back of dropped packets. This window-size controls the transmit rate, if there was no loss would ramp up much higher:

window_size.png (869×1 px, 143 KB)

Finding the source of that loss is the problem. The UDP tests you ran do show some, but it's fairly equal in both directions. Doing reasonably aggressive pings I don't see dropped packets:

cmooney@backup1003:~$ sudo ping -c 1000 -f -i 0.01 -l 100 -s 1400 10.192.32.35
PING 10.192.32.35 (10.192.32.35) 1400(1428) bytes of data.
          
--- 10.192.32.35 ping statistics ---
1000 packets transmitted, 1000 received, 0% packet loss, time 147ms
rtt min/avg/max/mdev = 31.525/31.640/31.822/0.071 ms, pipe 10, ipg/ewma 10.146/31.643 ms
cmooney@backup2003:~$ sudo ping -c 1000 -f -i 0.01 -l 100 -s 1400 10.64.16.107
PING 10.64.16.107 (10.64.16.107) 1400(1428) bytes of data.
       
--- 10.64.16.107 ping statistics ---
1000 packets transmitted, 1000 received, 0% packet loss, time 188ms
rtt min/avg/max/mdev = 31.550/31.638/31.831/0.177 ms, pipe 7, ipg/ewma 10.187/31.644 ms

One thing that might be a bit confusing in the PCAPs is that TCP segmentation offload is configured on the NICs. This is why you see packets larger than 1500 bytes in them. Effectively the OS is sending big packets to the NIC when transmitting, which is doing the work of breaking the TCP payload up into smaller segments. Same of the receive side, the NIC is getting 1500 byte packets on the wire, but merging the TCP payload of bunches of them into large packets to pass up the stack. That is a good thing, the NIC doing it in hardware saves CPU, but it does make the PCAPs look odd, as there is not a 1:1 relationship between packets sent/received. It might be an idea to temporarily disable this and do more captures, but as we can see loss I'm not sure it matters. So let's leave it for now.

I'll have some more time tomorrow hopefully. I'd like to test over one link versus the other for instance, and possibly do an extended UDP iperf3 test and see if it might help pinpoint a particular point in the network where the loss kicks in. I'll look at the link usage tomorrow morning EU time, if the backups are complete I will try then. If they are still running I may push it out until Thursday to make sure nothing skews the results.

Thanks, that analysis is very useful. I feel we are making lots of progress already on understanding the issue! Is the loss something we could test on every possible hop/piece of equipment/link to narrow where or why it happens? Check previous posts- they show the "effective transmission bandwidth" to change with the time of the day. If for some reason mitigating loss was not possible/desirable, could TCP window/congestion algorithm be tuned for certain workloads to be more aggresive?

if the backups are complete I will try then. If they are still running I may push it out until Thursday to make sure nothing skews the results.

Sadly, because of the slowdown, while the codfw->eqiad backups are about to finish as I write this already (5-6h), because of the slowdown, the eqiad->codfw backups may take up to 24 hours (still ongoing for a while). I also have pending finishing some last important manual extra backup after then- which will take ~48 hours. On one way, those are slow because of this, but on the other, I prefer to run them and have then available, as the opposite direction is fast to recover, and we won't be able to guarantee to get something fixed in a some hours'/few days's time. O:-/

Given this is not host specific, I can find you some alternative hosts to continue doing tests- although because of ongoing cross-dc large transfers we may want to wait until next week to have a "no known cross-dc backups ongoing state" (Monday & Tuesday)?

Thank you very much for your help.

Hi Jamie,

Thanks for the feedback. I think given the desire to push the WAN links relatively hard it might be best to wait until Tuesday morning and do it then. The less other traffic present will make the test more obvious in graphs etc.

In terms of the TCP algorithms there may be some tunings we can look at yes. I think our goal should be to locate the source of the packet loss but there are some options. I checked Arzhel's suggestion to try the BBR algorithm but it is not available in the current or next Debian releases by default. It can starve other traffic so might not be best options anyway.

Hopefully we can track down what's going on with the drops though, and review that other stuff as an optimization afterwards.

Mentioned in SAL (#wikimedia-operations) [2021-06-01T09:37:33Z] <topranks> Draining Telia CT IC-307235 to do some comparative bandwidth tests from eqiad to codfw (T274234)

Mentioned in SAL (#wikimedia-operations) [2021-06-01T13:43:16Z] <topranks> Restoring Telia CT IC-307235 to normal metric / bring back into service (T274234)

Mentioned in SAL (#wikimedia-operations) [2021-06-01T13:53:25Z] <topranks> Draining Lumen CCT 442550293 to do some comparative bandwidth tests from eqiad to codfw (T274234)

Mentioned in SAL (#wikimedia-operations) [2021-06-01T14:59:43Z] <topranks> Restoring Lumen CCT 442550293 to normal metric / bring back into service (T274234)

FYI, cross-dc backups are now in a "normal state" meaning we should only have those a few hours during the GMT night (Pacific day), twice a week. The big cross-dc backup migration at T282249 finished already.

Please share any finding you had, if any, about the different carriers (when you are done analyzing them, of course).

Thanks for the info @jcrespo that should help.

I did a lot of tests yesterday in relation to the two WAN links. And I've some good/bad news (depending on perspective I guess!)

The results show that the problem is the same regardless of which of the WAN circuits are being used. For instance see the iPerf tests in the file below, both show the same pattern of TCP retransmits, lowering congestion window and resulting lowering throughput:

Additionally I did some UDP based tests, at 3G to exceed what we were topping out at in the lossless TCP flows, to try to establish if packets were being dropped on the network.

In all of these end-to-end loss of 5-10% was observed. While they were running I ran a basic script to poll the CR router interfaces, in the DCs both sides, of the link the traffic was traversing. Unfortunately the stats I captured show a lot of variance, at the 10-second interval I was capturing at. Having looked into it I believe this is probably a sampling/phase error, i.e. a discrepancy due to the times I was polling the boxes versus when the internal Juniper counters were being updated.

https://docs.google.com/spreadsheets/d/118-_VZelZgG7uuqwvzH8oyWSPo5PUpp0zo1wV5qQyPI/edit?usp=sharing

In any event those 10-second values are off, and don't reveal much, but the totals over the 5 minutes (last line) make sense. What they reveal is that the numbers of packets sent out each side of these WAN links is basically the same as those being received at the other side. The difference in each case is less than 1%, which is probably well within the error margin for my basic tests, and definitely not close to the 5-10% loss seen in the iPerfs. So we can say for certain the WAN circuits weren't responsible for the loss seen in the UDP tests, and were not dropping packets even with a much higher load level than they normally see.

I don't think this leaves us any closer to an answer unfortunately. But we can rule out a problem with either WAN circuit, which means the issue is somewhere within our control.

Further work will still need to be done to try to find what/where that issue is. I think we should also probably look at the TCP settings to see if there is any easy-win there, to at least mitigate the symptoms a little, while the root cause remains elusive.

I've been able to find the source of the dropped traffic between eqiad and codfw. Transmit discards/drops are visible on all interfaces connecting asw-b-eqiad to CR1:

https://librenms.wikimedia.org/graphs/to=1623164700/id=15215/type=port_errors/from=1622559900/
https://librenms.wikimedia.org/graphs/to=1623164700/id=15217/type=port_errors/from=1622559900/
https://librenms.wikimedia.org/graphs/to=1623164700/id=15223/type=port_errors/from=1620486300/
https://librenms.wikimedia.org/graphs/to=1623164700/id=15225/type=port_errors/from=1620486300/

Backup1003, which I was using for tests, is connected to asw-b2-eqiad, so probably the test traffic traverses xe-2/0/44 or xe-2/0/45, but tbh I'm not 100% sure if this is how the stacked switch will behave. Either way all of the links show drops.

To verify this was the cause of the problem I temporarily routed traffic for backup2003 (in codfw) via CR2-EQIAD (VRRP backup for the same private1-b-eqiad vlan). The links from asw2-b-eqiad to cr2-eqiad are doing negligible upload traffic to the cr normally:

cmooney@backup1003:~$ iperf3 -i 5 -t 30 -Z -l 1420 -c 10.192.32.35
Connecting to host 10.192.32.35, port 5201
[  5] local 10.64.16.107 port 39870 connected to 10.192.32.35 port 5201
[ ID] Interval           Transfer     Bitrate         Retr  Cwnd
[  5]   0.00-5.00   sec   472 MBytes   793 Mbits/sec  980   1.48 MBytes       
[  5]   5.00-10.00  sec   190 MBytes   319 Mbits/sec   83   1.28 MBytes       
[  5]  10.00-15.00  sec   199 MBytes   334 Mbits/sec    0   1.30 MBytes       
[  5]  15.00-20.00  sec   211 MBytes   354 Mbits/sec    0   1.49 MBytes       
[  5]  20.00-25.00  sec   248 MBytes   417 Mbits/sec  117   1.58 MBytes       
[  5]  25.00-30.00  sec   230 MBytes   387 Mbits/sec   13   1.44 MBytes       
- - - - - - - - - - - - - - - - - - - - - - - - -
[ ID] Interval           Transfer     Bitrate         Retr
[  5]   0.00-30.00  sec  1.52 GBytes   434 Mbits/sec  1193             sender
[  5]   0.00-30.04  sec  1.51 GBytes   431 Mbits/sec                  receiver

iperf Done.
cmooney@backup1003:~$ sudo ip route add 10.192.32.35/32 via 10.64.16.3
cmooney@backup1003:~$ 
cmooney@backup1003:~$ iperf3 -i 5 -t 30 -Z -l 1420 -c 10.192.32.35
Connecting to host 10.192.32.35, port 5201
[  5] local 10.64.16.107 port 39874 connected to 10.192.32.35 port 5201
[ ID] Interval           Transfer     Bitrate         Retr  Cwnd
[  5]   0.00-5.00   sec   915 MBytes  1.54 Gbits/sec    0   15.3 MBytes       
[  5]   5.00-10.00  sec  1.03 GBytes  1.77 Gbits/sec    0   16.0 MBytes       
[  5]  10.00-15.00  sec  1.03 GBytes  1.76 Gbits/sec    0   16.4 MBytes       
[  5]  15.00-20.00  sec  1.03 GBytes  1.77 Gbits/sec    0   16.4 MBytes       
[  5]  20.00-25.00  sec  1.03 GBytes  1.77 Gbits/sec    0   16.4 MBytes       
[  5]  25.00-30.00  sec  1.04 GBytes  1.79 Gbits/sec    0   16.4 MBytes       
- - - - - - - - - - - - - - - - - - - - - - - - -
[ ID] Interval           Transfer     Bitrate         Retr
[  5]   0.00-30.00  sec  6.05 GBytes  1.73 Gbits/sec    0             sender
[  5]   0.00-30.04  sec  6.05 GBytes  1.73 Gbits/sec                  receiver

iperf Done.
cmooney@backup1003:~$ sudo ip route del 10.192.32.35/32 via 10.64.16.3
cmooney@backup1003:~$

As can be seen there is no loss / TCP retransmits in the second test, when traffic went via the links to CR2. Which gives us a good sign the rest of the path is ok and the drops on the ports connecting to CR1 are the cause of the poor performance.

In terms of the drops on the links from asw2-b-eqiad to cr1-eqiad I'm not 100% on the cause. Typically such drops mean tail-drops, i.e. the link is maxed and buffers fill up. LibreNMS graphs only show ~3Gb/sec on each of the 4 x 10Gb links, but our sampling interval is only every 5 minutes. I re-ran the tests and sampled manually at a 5-second granularity, and while there is a little more variation it doesn't suggest we are near max over that kind of interval either:

https://docs.google.com/spreadsheets/d/1lAckpLBHJzr_MbomT6RK_Pw_Vogc-pc1CHHvwbAwxBQ/edit?usp=sharing

But we can't rule out that sub-second microbursts are happening. I've not checked but I expect the switches have fairly small buffers (open to correction there). Further investigation will be required.

In terms of short-term mitigations one thing we could do is adjust the VRRP master/backup configuration on the CRs between the 4 Vlans on the LAG. i.e. leave cr1 master for public1-b-eqiad vlan but make cr2 master for private1-b-eqiad. Or if that is too large a shift in traffic we could introduce another VIP on private1-b-eqiad, and only configure that IP as gateway for the backup hosts.

I also researched / played with TCP tunings. I don't believe the current CUBIC algorithm can be tuned to give us much of a performance boost in the presence of dropped packets. As Arzhel suggested before BBR may work better while we have drops. But I'd be wary of using it tbh, it may squeeze out everything else.

If we can get rid of the drops I think we might be able to improve the "healthy" performance by upping the max TCP send/receive windows. You can see when we get close to 2Gbit/sec throughput end-to-end, the send window is maxing out (you can see in the iperf it sticks at 15.6Mb). I believe a good start would be to double the below kernel parameters (max send and max recv window), and see if we can get a further increase in performance:

cmooney@backup1003:~$ sudo sysctl net.core.rmem_max
net.core.rmem_max = 16777216
cmooney@backup1003:~$ sudo sysctl net.core.wmem_max
net.core.wmem_max = 16777216

It may also be worth increasing net.core.netdev_max_backlog, and some other parameters, but we should proceed cautiously and just do one thing at a time.

One interesting effect is that, since the datacenter switchover, the issue described above is "gone":

Screenshot from 2021-07-19 15-29-14.png (988×2 px, 109 KB)

Screenshot from 2021-07-19 15-28-02.png (982×2 px, 67 KB)

The speed of transfer is reasonable, and the same between eqiad -> codfw and codfw -> eqiad, with no regression in the opposite direction. I say gone in quotes because this was expected, @ayounsi mentioned that it was observed only in that direction because the increased traffic that way- which now has been for the most part reversed: https://librenms.wikimedia.org/graph.php?type=bill_bits&id=24&from=1624109619&to=1626701619&width=1000&height=200&total=1&dir=in

This ticket, however, is still valid, because this was all expected after the findings, and the issues will come back when we switch back to eqiad. We also confirm again that the bandwidth by itself is not the core problem, just a necessary factor, because we actually have 3 times the bandwidth in the opposite direction with no issues (yet, see recent ops- email about possibly getting over the available bandwidth). I wanted to make a note because I consider this a critical infrastracture issue- that yes, it affects backups more clearly, but it is a general issue.

Thanks @jcrespo.

Yes this makes perfect sense. Due to the switchover there is less traffic / usage in general in eqiad, and thus less pressure on the uplinks from rows to the CR routers there. So when you do your backup there is less other traffic competing for bandwidth on the uplinks and it works.

When we switch back we will need to observe the behaviour. We expect to see an improvement at very least due to T284592 being completed before then.

I see a huge improvement on the "stability" (if you allow me the vague word) of the transmission of data between dcs:

Before, the most visible issue was eqiad -> codfw topping at around 34 MBytes/s, compared to codfw->eqiad's 168:

Screenshot from 2021-02-08 19-31-35.png (940×2 px, 146 KB)

I no longer send and transmit from the same hosts at the same time (for disk space reasons), but the issue was also observed on the current workflow backup1002->backup2003 and backup2002->backup1003. However, currently, both backups run at the same speed and with no dips in performance:

Screenshot from 2021-09-22 10-23-59.png (356×1 px, 47 KB)

Screenshot from 2021-09-22 10-23-47.png (358×1 px, 44 KB)

Transmitting at a stable 160-175 MBytes/s, which makes use of the 10G network. While I would like to have 10G reserved in exclusivity just for me if I could- the current status is sustainable, as our largest dataset package (11TB) would be sent in less than a day between DCs.

This is the comparison of the evolution as seen from backup1002 rx bandwidth (red marking the DC switch and green the DC switch back:

Screenshot from 2021-09-22 10-36-22.png (1×2 px, 125 KB)

So I would encourage to keep, in the long run, continuing expanding and improving the network, but I can say the previously ongoing issue as solved. Thanks @cmooney @ayounsi @faidon for the help provided.

@jcrespo thanks for the above comments.

In terms of the work done to address this we now observe less discards on the ASW->CR links in eqiad, after the buffer changes to switches and following the switch-back to eqiad last week. But we still have some drops there, so that issue is not considered "fixed".

That said, from what I can tell we haven't seen, in the 2 scheduled transfers since the switch-back last week, a return to the very poor performance detailed earlier in this task:

image.png (840×1 px, 115 KB)

We will continue to look at ways to eliminate packet loss across our networks, any consistent loss is a problem. But hopefully the reduced number of drops is at least allowing these transfers to complete quicker for now.

@cmooney Please feel free to resolve this ticket and continue working on your own at T291627 or edit its title to reflect the pending work that you think is missing- the current title is not true anymore. From a backup maintenance point of view, the specific issue is solved. Of course, if you need help with testing performance you can always add me to the right tickets.

@jcrespo thanks. As you say it seems we have improved the situation just enough to keep the backups jobs completing in reasonable time. Even if we've not fully addressed the root cause.

We will track the continued work towards that goal in T291627.

cheers.