Page MenuHomePhabricator

jupyter notebook causing syslog/etc.. to fill up with error messages
Closed, ResolvedPublic

Description

Hey folks,

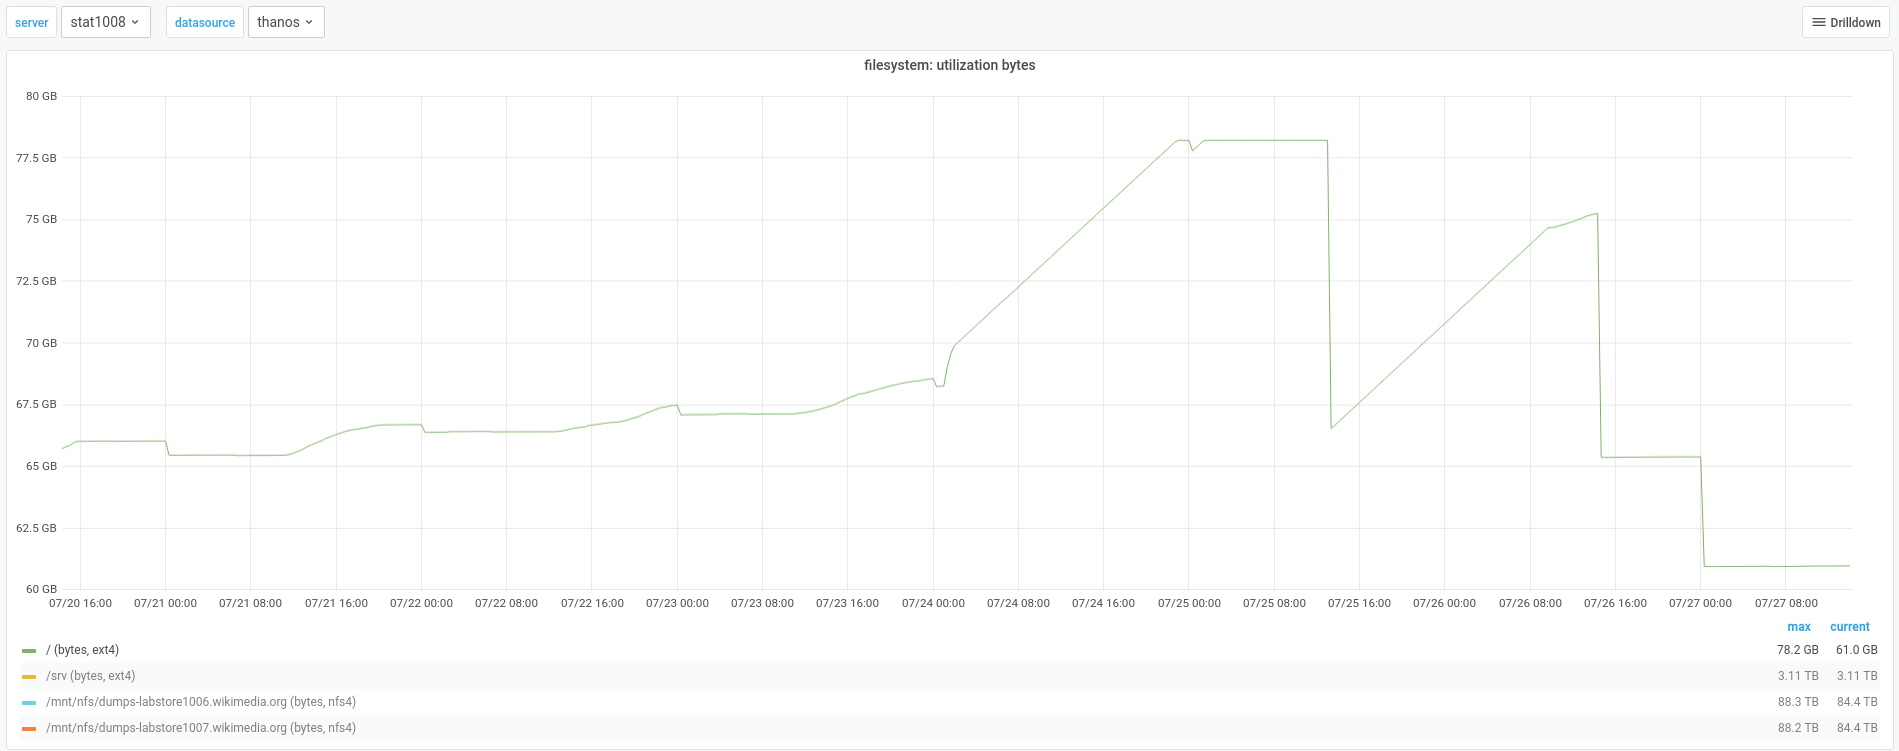
just noticed that stat1008's root partition is full, and /var/log's size is around 20G (half of the partition size). The syslog logs are quite big, full of:

Jul 25 11:27:23 stat1008 bash[7938]: 21/07/25 11:27:23 ERROR AsyncEventQueue: Listener AppStatusListener threw an exception
Jul 25 11:27:23 stat1008 bash[7938]: java.lang.NullPointerException
Jul 25 11:27:23 stat1008 bash[7938]: #011at org.spark_project.guava.base.Preconditions.checkNotNull(Preconditions.java:191)
Jul 25 11:27:23 stat1008 bash[7938]: #011at org.spark_project.guava.collect.MapMakerInternalMap.putIfAbsent(MapMakerInternalMap.java:3507)
Jul 25 11:27:23 stat1008 bash[7938]: #011at org.spark_project.guava.collect.Interners$WeakInterner.intern(Interners.java:85)
Jul 25 11:27:23 stat1008 bash[7938]: #011at org.apache.spark.status.LiveEntityHelpers$.weakIntern(LiveEntity.scala:603)
Jul 25 11:27:23 stat1008 bash[7938]: #011at org.apache.spark.status.LiveRDDDistribution.toApi(LiveEntity.scala:486)
Jul 25 11:27:23 stat1008 bash[7938]: #011at org.apache.spark.status.LiveRDD$$anonfun$2.apply(LiveEntity.scala:548)
Jul 25 11:27:23 stat1008 bash[7938]: #011at scala.collection.TraversableLike$$anonfun$map$1.apply(TraversableLike.scala:234)
Jul 25 11:27:23 stat1008 bash[7938]: #011at scala.collection.mutable.HashMap$$anon$2$$anonfun$foreach$3.apply(HashMap.scala:139)
Jul 25 11:27:23 stat1008 bash[7938]: #011at scala.collection.mutable.HashTable$class.foreachEntry(HashTable.scala:236)
Jul 25 11:27:23 stat1008 bash[7938]: #011at scala.collection.mutable.HashMap.foreachEntry(HashMap.scala:40)
Jul 25 11:27:23 stat1008 bash[7938]: #011at scala.collection.mutable.HashMap$$anon$2.foreach(HashMap.scala:139)
Jul 25 11:27:23 stat1008 bash[7938]: #011at scala.collection.TraversableLike$class.map(TraversableLike.scala:234)
Jul 25 11:27:23 stat1008 bash[7938]: #011at scala.collection.AbstractTraversable.map(Traversable.scala:104)
Jul 25 11:27:23 stat1008 bash[7938]: #011at org.apache.spark.status.LiveRDD.doUpdate(LiveEntity.scala:548)
Jul 25 11:27:23 stat1008 bash[7938]: #011at org.apache.spark.status.LiveEntity.write(LiveEntity.scala:49)
Jul 25 11:27:23 stat1008 bash[7938]: #011at org.apache.spark.status.AppStatusListener.org$apache$spark$status$AppStatusListener$$update(AppStatusL
istener.scala:991)
Jul 25 11:27:23 stat1008 bash[7938]: #011at org.apache.spark.status.AppStatusListener.org$apache$spark$status$AppStatusListener$$maybeUpdate(AppSt
atusListener.scala:997)
Jul 25 11:27:23 stat1008 bash[7938]: #011at org.apache.spark.status.AppStatusListener$$anonfun$onExecutorMetricsUpdate$2.apply(AppStatusListener.scala:764)
Jul 25 11:27:23 stat1008 bash[7938]: #011at scala.collection.mutable.HashMap$$anon$2$$anonfun$foreach$3.apply(HashMap.scala:139)
Jul 25 11:27:23 stat1008 bash[7938]: #011at scala.collection.mutable.HashTable$class.foreachEntry(HashTable.scala:236)
Jul 25 11:27:23 stat1008 bash[7938]: #011at scala.collection.mutable.HashMap.foreachEntry(HashMap.scala:40)
Jul 25 11:27:23 stat1008 bash[7938]: #011at scala.collection.mutable.HashMap$$anon$2.foreach(HashMap.scala:139)
Jul 25 11:27:23 stat1008 bash[7938]: #011at org.apache.spark.status.AppStatusListener.org$apache$spark$status$AppStatusListener$$flush(AppStatusListener.scala:788)
Jul 25 11:27:23 stat1008 bash[7938]: #011at org.apache.spark.status.AppStatusListener.onExecutorMetricsUpdate(AppStatusListener.scala:764)
Jul 25 11:27:23 stat1008 bash[7938]: #011at org.apache.spark.scheduler.SparkListenerBus$class.doPostEvent(SparkListenerBus.scala:59)
Jul 25 11:27:23 stat1008 bash[7938]: #011at org.apache.spark.scheduler.AsyncEventQueue.doPostEvent(AsyncEventQueue.scala:37)
Jul 25 11:27:23 stat1008 bash[7938]: #011at org.apache.spark.util.ListenerBus$class.postToAll(ListenerBus.scala:91)
Jul 25 11:27:23 stat1008 bash[7938]: #011at org.apache.spark.scheduler.AsyncEventQueue.org$apache$spark$scheduler$AsyncEventQueue$$super$postToAll(AsyncEventQueue.scala:92)
Jul 25 11:27:23 stat1008 bash[7938]: #011at org.apache.spark.scheduler.AsyncEventQueue$$anonfun$org$apache$spark$scheduler$AsyncEventQueue$$dispatch$1.apply$mcJ$sp(AsyncEventQueue.scala:92)
Jul 25 11:27:23 stat1008 bash[7938]: #011at org.apache.spark.scheduler.AsyncEventQueue$$anonfun$org$apache$spark$scheduler$AsyncEventQueue$$dispatch$1.apply(AsyncEventQueue.scala:87)
Jul 25 11:27:23 stat1008 bash[7938]: #011at scala.util.DynamicVariable.withValue(DynamicVariable.scala:58)
Jul 25 11:27:23 stat1008 bash[7938]: #011at org.apache.spark.scheduler.AsyncEventQueue.org$apache$spark$scheduler$AsyncEventQueue$$dispatch(AsyncEventQueue.scala:87)
Jul 25 11:27:23 stat1008 bash[7938]: #011at org.apache.spark.scheduler.AsyncEventQueue$$anon$1$$anonfun$run$1.apply$mcV$sp(AsyncEventQueue.scala:83)
Jul 25 11:27:23 stat1008 bash[7938]: #011at org.apache.spark.util.Utils$.tryOrStopSparkContext(Utils.scala:1302)
Jul 25 11:27:23 stat1008 bash[7938]: #011at org.apache.spark.scheduler.AsyncEventQueue$$anon$1.run(AsyncEventQueue.scala:82)

The bash script is:

christi+  7938  0.0  0.0   6912  3384 ?        Ss   Jul01   0:00 /bin/bash /etc/jupyterhub-conda/jupyterhub-singleuser-conda-env.sh /home/christinedk/.conda/envs/2021-02-17T16.48.34_christinedk --port=36749 --NotebookApp.default_url=/lab

And this leads to:

494M	/var/log/jupyterhub-conda
1.5G	/var/log/messages
1.5G	/var/log/syslog
1.5G	/var/log/user.log
3.3G	/var/log/syslog.1
5.3G	/var/log/messages.1
5.3G	/var/log/user.log.1

Event Timeline

elukey@stat1008:~$ mkdir T287339
elukey@stat1008:~$ cd T287339
elukey@stat1008:~/T287339$ sudo mv /var/log/syslog.1 .
elukey@stat1008:~/T287339$ sudo mv /var/log/messages.1 .
elukey@stat1008:~/T287339$ sudo mv /var/log/user.log.1 .

I have also ran apt-get clean to free some space. I think that it should be fine to kill the script and the logs, but maybe it is worth to follow up with @ChristineDeKock about the jupyter notebook (to see if we are missing some syslog filters or if it is something peculiar to their local settings).

Hi all,

Sorry about this. I think I know what may be causing it. I am not currently at a laptop unfortunately, but will be able to look at it tonight and will update then.

Hi all,

Sorry about this. I think I know what may be causing it. I am not currently at a laptop unfortunately, but will be able to look at it tonight and will update then.

Hi @ChristineDeKock! Nothing urgent, it is just a task to track the specific issue, it may be some missing config/automation step to do on our side :) Thanks for following up!

Hi @ChristineDeKock, FYI I stopped your jupyter notebook server on stat1008. Disks were filling up again.

I'm not sure why your process was causing logs to go to those /var/log files like that though. We'll have to investigate.

BTullis triaged this task as High priority.Jul 26 2021, 2:20 PM
BTullis added a project: Analytics-Kanban.
sudo mv syslog.1 /home/elukey/T287339/syslog.1.again
sudo -s
cp syslog /home/elukey/T287339/syslog.again
echo '' > syslog

cp messages /home/elukey/T287339/messages.again
echo '' > messages

cp user.log /home/elukey/T287339/user.log
echo '' > user.log

Thanks; I'll keep everything shut down for now.

find /tmp -mtime +100 -delete

But that actually didn't delete that much.

There seem to be a lot of model training temp files owned by various users that are really taking up much of the space.

The vast majority of the /home/elukey/T287339/syslog.again and similar files appears to be Java stack traces, logged via bash.

We have some errors from Yarn about exceeding resource limits. e.g.

Jul 26 14:15:24 stat1008 bash[7938]: 21/07/26 14:15:24 WARN YarnSchedulerBackend$YarnSchedulerEndpoint: Requesting driver to remove executor 163 for reason Container killed by YARN for exceeding memory limits.  
8.8 GB of 8.8 GB physical memory used. Consider boosting spark.yarn.executor.memoryOverhead or disabling yarn.nodemanager.vmem-check-enabled because of YARN-4714.
Jul 26 14:15:24 stat1008 bash[7938]: 21/07/26 14:15:24 ERROR YarnScheduler: Lost executor 163 on an-worker1105.eqiad.wmnet: Container killed by YARN for exceeding memory limits.  8.8 GB of 8.8 GB physical memory
 used. Consider boosting spark.yarn.executor.memoryOverhead or disabling yarn.nodemanager.vmem-check-enabled because of YARN-4714.
Jul 26 14:15:24 stat1008 bash[7938]: 21/07/26 14:15:24 WARN TaskSetManager: Lost task 180.0 in stage 18082.0 (TID 2688063, an-worker1105.eqiad.wmnet, executor 163): ExecutorLostFailure (executor 163 exited cause
d by one of the running tasks) Reason: Container killed by YARN for exceeding memory limits.  8.8 GB of 8.8 GB physical memory used. Consider boosting spark.yarn.executor.memoryOverhead or disabling yarn.nodeman
ager.vmem-check-enabled because of YARN-4714.

Mainly they are network connection closure related errors though, such as:

ERROR TransportClient: Failed to send RPC RPC 5002905147896109670 to /10.64.21.10:43858: java.nio.channels.ClosedChannelException

No growth of the / filesystem for the past 24 hours.

image.png (751×1 px, 64 KB)

https://grafana.wikimedia.org/d/000000377/host-overview?viewPanel=28&orgId=1&var-server=stat1008&var-datasource=thanos&var-cluster=analytics&from=now-7d&to=now

Monitoring for stability, but I'd also like to try to find out why these continuous stack traces were ending up in the syslog, rather than a user's home directory.

@ChristineDeKock - Could you please ping me the next time you run this (or a similar) notebook please?
I'm interested to catch it while it's running so that I see what the command-line arguments end up as on the host.

This will be useful evidence to help work out whether there's anything we can do to make the logging better. Thanks.

@BTullis Sure, I'd be happy to. I will likely be working on this again in the coming week. There are 2 potential processes which may be causing the issue. The first is a Spark data export job, which has not been a problem before. The second (newer) process is training ML models, which would be generating the temp files you referred to.

Thanks @ChristineDeKock - I see that you've got some scripts running now. I've had a quick look at the arguments in depth and I can see that the problem is more related to the setup of the system, rather than anything you're doing.

With regard to the temp files, it might be good if we could modify the training job to create these within a subdirectory of your home directory (e.g. /home/christinedk/tmp) as opposed to the system-wide`/tmp`.
This is simply because there is more space available and it would be easier to perform housekeeping on them. Maybe it would be possible to do this by setting an environment variable at the start of the job, but I'm not sure yet.
I'm happy to help if you'd like me to look at this with you, but it's not critical.

More of a concern to me than the temp files is the excessive logging from the notebooks to /var/log/syslog- particularly when notebooks create errors.
I now understand why the output from the notebooks is ending up in these logs - It's because of the way that each notebook runs as a service: https://wikitech.wikimedia.org/wiki/Analytics/Systems/Jupyter#Viewing_Jupyter_Notebook_Server_logs

I'm now investigating:

  • how we can prevent excessive logging, particularly of errors, from user's notebooks
  • how we can give users access to the logs of their own notebooks
  • whether there is a more robust way in general that we can set up JupyterHub for multi-user use.

Currently each notebook is started as a systemd transient service, ultimately started by systemd-run from the file: /usr/lib/anaconda-wmf/lib/python3.7/site-packages/systemdspawner/systemd.py

It creates a service definition file such as the following example: /run/systemd/transient/jupyter-christinedk-singleuser.service

# This is a transient unit file, created programmatically via the systemd API. Do not edit.
[Unit]
Description=/bin/bash -c cd /home/christinedk && exec /etc/jupyterhub-conda/jupyterhub-singleuser-conda-env.sh /home/christinedk/.conda/envs/2021-02-17T16.48.34_christinedk --port=51233 --NotebookApp.default_url=/lab

[Service]
NoNewPrivileges=yes
ReadOnlyDirectories="/"
ReadWriteDirectories="/home/christinedk"
ReadWriteDirectories="/dev/shm"
ReadWriteDirectories="/run/user"
ReadWriteDirectories="/tmp"
WorkingDirectory=/home/christinedk
Slice=user.slice
User=29809
Group=500
Environment="PATH=/usr/local/sbin:/usr/local/bin:/usr/sbin:/usr/bin:/sbin:/bin" "PYTHONPATH=/etc/jupyterhub-conda" "LANG=en_US.UTF-8" "JAVA_HOME=/usr/lib/jvm/java-1.8.0-openjdk-amd64" "http_proxy=http://webproxy.eqiad.wmnet:8080" "https_proxy=http://webproxy.eqiad.wmnet:8080" "no_proxy=localhost,127.0.0.1,10.64.5.35,.wmnet" "JAVA_OPTS=-Djava.net.useSystemProxies" "JUPYTERHUB_API_TOKEN=redacted" "JPY_API_TOKEN=redacted" "JUPYTERHUB_ADMIN_ACCESS=1" "JUPYTERHUB_CLIENT_ID=jupyterhub-user-christinedk" "JUPYTERHUB_HOST=" "JUPYTERHUB_OAUTH_CALLBACK_URL=/user/christinedk/oauth_callback" "JUPYTERHUB_USER=christinedk" "JUPYTERHUB_SERVER_NAME=" "JUPYTERHUB_API_URL=http://10.64.5.35:8881/hub/api" "JUPYTERHUB_ACTIVITY_URL=http://10.64.5.35:8881/hub/api/users/christinedk/activity" "JUPYTERHUB_BASE_URL=/" "JUPYTERHUB_SERVICE_PREFIX=/user/christinedk/" "SHELL=/bin/bash"
ExecStart=
ExecStart=@/bin/bash "/bin/bash" "-c" "cd /home/christinedk && exec /etc/jupyterhub-conda/jupyterhub-singleuser-conda-env.sh /home/christinedk/.conda/envs/2021-02-17T16.48.34_christinedk --port=51233 --NotebookApp.default_url=/lab"

There is no StandardOutput nor StandardError set, which means that it inherits the DefaultStandardOutput=journal and DefaultStandardError=journal settings.

One way in which we could deal with this is to work out how add these definitions and set the output to go to defined log files per notebook. For example:

StandardOutput=append:/var/log/jupyter/jupyter-christinedk-singleuser.log
StandardError=append:/var/log/jupyter/jupyter-christinedk-singleuser.error

Then we could create a simple logrotate frament to keep the size and number of these files under control.
I think that this would also give the users access to their logfiles.

Another way might be to create an rsyslog configuration fragment to write these notebook entries to files. I see that we already have an rsyslog configuration for the jupyterhub logs themselves...

btullis@stat1008:/etc/rsyslog.d$ cat 20-jupyterhub-conda.conf 
# rsyslogd(8) configuration file for services.

# This file is managed by Puppet.
:programname, startswith, "jupyterhub-conda" /var/log/jupyterhub-conda/syslog.log
& stop

That is working, but it seems that the notebook logs themseves don't prefix the unit name to the logs. Each line from the syslog just begins with bash e.g.

Aug  4 00:00:26 stat1008 bash[28760]: 21/08/04 00:00:26 WARN BlockManagerMasterEndpoint: No more replicas available for rdd_25915_220 !

One way in which we could deal with this is to work out how add these definitions and set the output to go to defined log files per notebook

AH! This sounds perfect! I've wanted to solve this problem for a while now!

I'd direct these logs into user homedirs, or at least symlink them there.

Change 710065 had a related patch set uploaded (by Btullis; author: Btullis):

[operations/puppet@production] Create discrete log files per user notebook

https://gerrit.wikimedia.org/r/710065

After a little testing and tweaking I got the configuration to be passed through to the transient unit file.

'-c.SystemdSpawner.unit_extra_properties = {
    'StandardOutput': 'append:/var/log/jupyterhub-conda/jupyter-{USERNAME}-singleuser.log',
    'StandardError': 'append:/var/log/jupyterhub-conda/jupyter-{USERNAME}-singleuser_error.log'

Unfortunately, this didn't interpolate the {USERNAME} variable, so the files end up like this:

btullis@an-test-client1001:/var/log/jupyterhub-conda$ ls -lrt
total 67220
-rw-r----- 1 root root 68792639 Aug  5 15:43 syslog.log
-rw-r--r-- 1 root root     2358 Aug  5 15:43 jupyter-{USERNAME}-singleuser.log
-rw-r--r-- 1 root root    26429 Aug  5 15:44 jupyter-{USERNAME}-singleuser_error.log

Still, it's a step forward. I was wondering though, is it ever the case that a user has multiple notebooks running on a single server?
That might make this flat file approach more difficult.

Confirmed, there is no variable interpolation done by the SystemdSpawner.
https://github.com/jupyterhub/systemdspawner#unit_extra_properties

At this stage I have several other ideas.

  1. pipe the output from each notebook to svlogd - which is part of the runit suite. This would potentially sort out the logs in the users' homes and automatic log rotation too, but requires installing runit.
  2. add a SyslogIdentifier instead of StandardOutput and StandardError, then configure rsyslog to log it to the right directories.

Number 2 is likely quicker to try out.
Number 1 could be a nice, user focused solution though.

@yuvipanda could/should we submit a patch to make SystemdSpawner interpolate unit_extra_properties?

@BTullis it looks like just calling self._expand_user_vars on each of the self.unit_extra_properties values on this line.

Oh nice. Thanks for that. I didn't think of patching it. Happy to do so.

I did wonder whether or not Logstash would be a good target for these user notebook logs.

Given that we already have quite a bit of the framework in place to move logs through rsyslog, kafka, logstash, elasticsearch etc - maybe it would make sense.

I have created an issue and a Pull Request in GitHub for this change.

If we're using Logstash then we won't need to modify StandardOutput and StandardError any more, but we will need to add SyslogIdentifier instead.

I think that we might want to add the notebook user field with a LogExtraFieldsparameter, so that users can identify their own logs.

I'll go ahead with the testing of Logstash integration.

Change 710065 merged by Btullis:

[operations/puppet@production] Redirect jupyter notebook logs to logstash via kafka

https://gerrit.wikimedia.org/r/710065

Change 710521 had a related patch set uploaded (by Btullis; author: Btullis):

[operations/puppet@production] Exclude jupyterhub notebooks from local logging

https://gerrit.wikimedia.org/r/710521

Change 710521 merged by Btullis:

[operations/puppet@production] Exclude jupyterhub notebooks from local logging

https://gerrit.wikimedia.org/r/710521

Ah, it's not making it through to Logstash because it gets caught by the following rsyslog snippet.

btullis@an-test-client1001:/etc/rsyslog.d$ cat 20-jupyterhub-conda.conf 
# rsyslogd(8) configuration file for services.

# This file is managed by Puppet.
:programname, startswith, "jupyterhub-conda" /var/log/jupyterhub-conda/syslog.log
& stop

Fixed by https://gerrit.wikimedia.org/r/710521

However, I'm still not seeing this in Logstash at the moment.

I'm tempted to mark this ticket as done and make a follow-up for getting the logstash integration working.
The main purpose of the ticket should be done, since newly launched user notebooks will not be logged multiple times to syslog.