Page MenuHomePhabricator

Slow loading on Toolforge
Open, Needs TriagePublicBUG REPORT

Description

Steps to replicate the issue (include links if applicable):

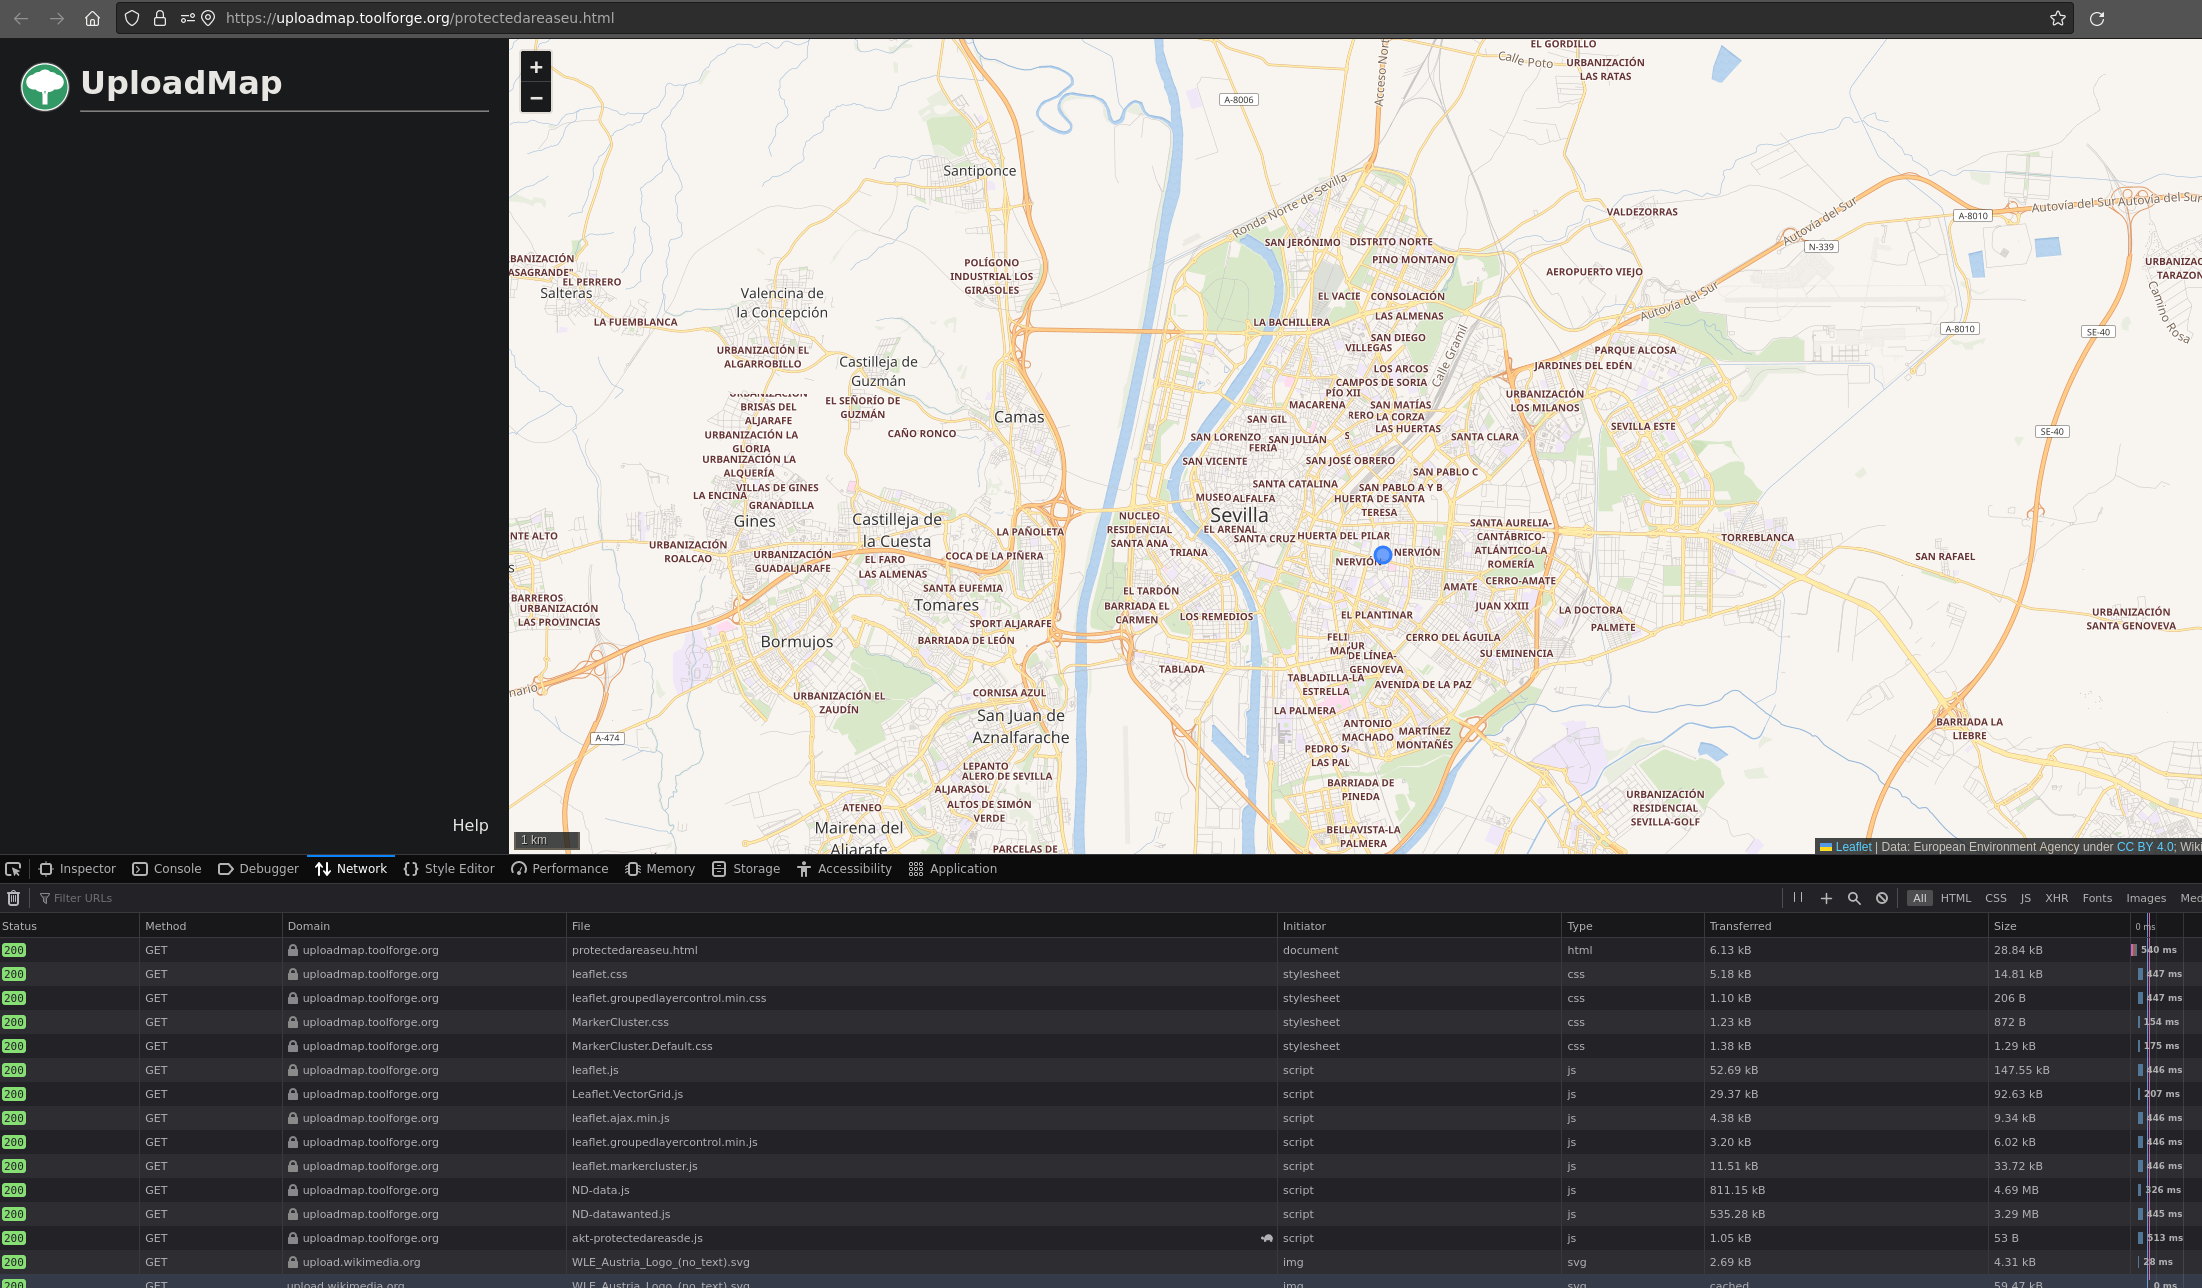
  • Open a tool with a web service running on Toolforge in a web browser.
  • This affects all tools but especially those tools with larger JavaScript code and libraries or other content stored on Toolforge. This also affects plain html sites.

What happens?:

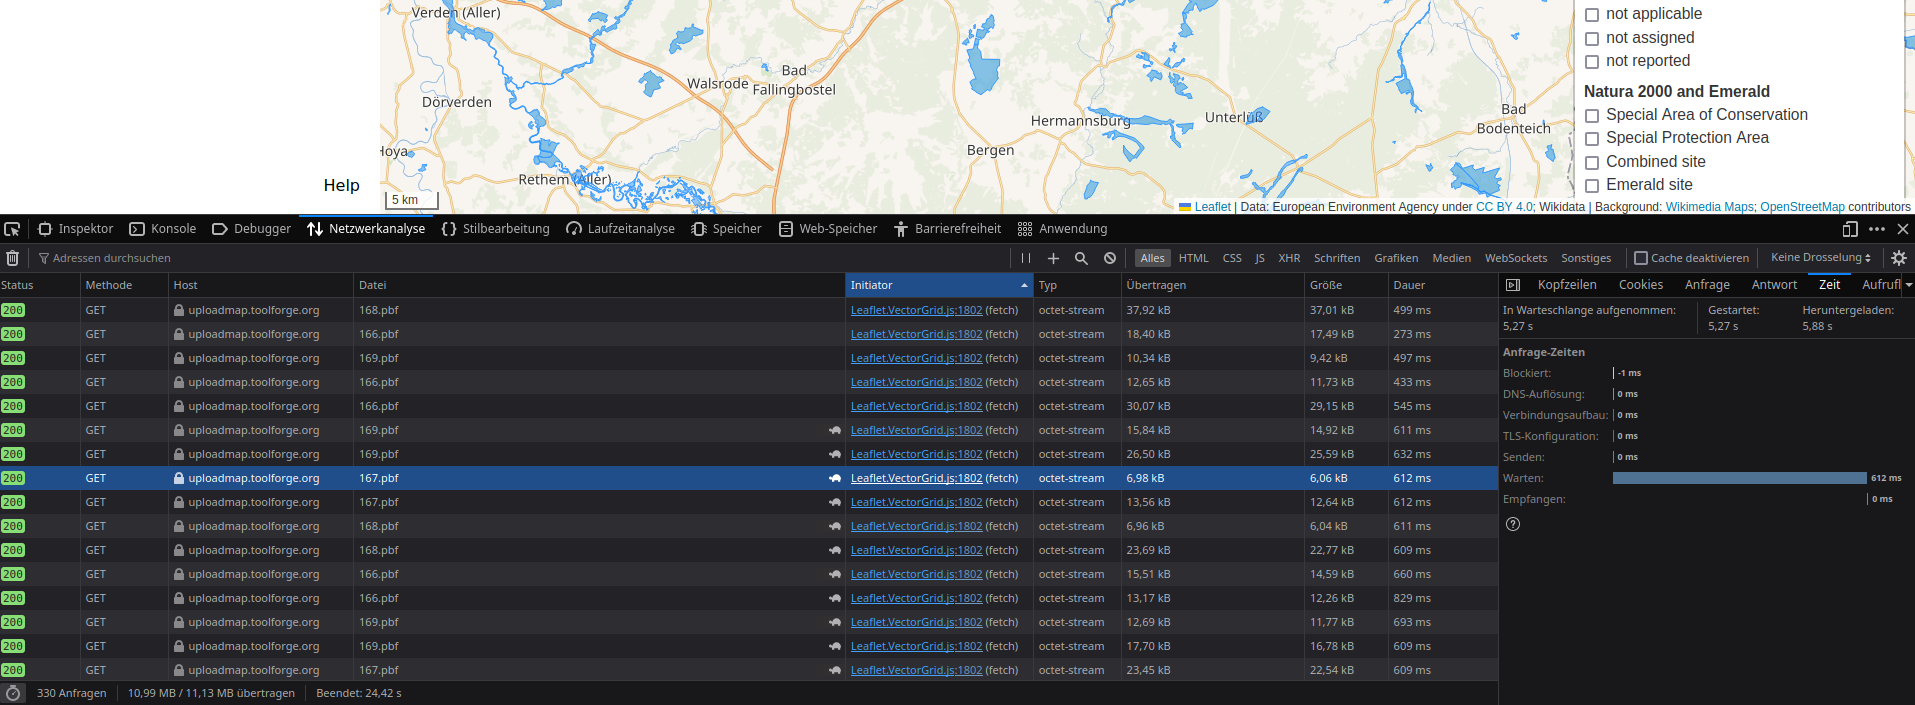
  • Content loading is very slow with wait and receive times of multiple seconds in extreme cases up to one minute.
  • Scripts loaded from tools-static.wmflabs.org are also affected.

What should have happened instead?:

  • Content loading should be reasonable fast.

Software version (on Special:Version page; skip for WMF-hosted wikis like Wikipedia):

Other information (browser name/version, screenshots, etc.):

Tested through Deutsche Telekom DSL and LTE in Berlin and a cloud service hosted in Frankfurt with similar results. It is therefore unlikely a network issue on my side.

Event Timeline

The Cloud-Services project tag is not intended to have any tasks. Please check the list on https://phabricator.wikimedia.org/project/profile/832/ and replace it with a more specific project tag to this task. Thanks!

@GPSLeo do you have a specific link that we can test?

Could you please go to here https://network-tests.toolforge.org/ and download the 1GB file, and report the speed you get?

This is the URL: https://network-tests.toolforge.org/files/1GB.bin

The loading speed is currently much faster than yesterday. I especially experienced the problem with the vector tile loading on my tool https://uploadmap.toolforge.org/protectedareaseu.html.

Here are some speed measurements with the file download and a simple ping:
Through my 250MBit DSL connection in Berlin:

# curl -O https://network-tests.toolforge.org/files/1GB.bin

  % Total    % Received % Xferd  Average Speed   Time    Time     Time  Current
                                 Dload  Upload   Total   Spent    Left  Speed
100  953M  100  953M    0     0  10.3M      0  0:01:32  0:01:32 --:--:-- 11.6M

# ping toolforge.org
PING toolforge.org (185.15.56.11) 56(84) bytes of data.
64 bytes from instance-tools-proxy-7.tools.wmcloud.org (185.15.56.11): icmp_seq=1 ttl=55 time=115 ms
64 bytes from instance-tools-proxy-7.tools.wmcloud.org (185.15.56.11): icmp_seq=2 ttl=55 time=115 ms
64 bytes from toolforge.org (185.15.56.11): icmp_seq=3 ttl=55 time=114 ms
64 bytes from instance-tools-proxy-7.tools.wmcloud.org (185.15.56.11): icmp_seq=4 ttl=55 time=114 ms
64 bytes from toolforge.org (185.15.56.11): icmp_seq=5 ttl=55 time=114 ms

Through a root server at hetzner also in Germany with a 1GBit connection:

# curl -O https://network-tests.toolforge.org/files/1GB.bin

  % Total    % Received % Xferd  Average Speed   Time    Time     Time  Current
                                 Dload  Upload   Total   Spent    Left  Speed
100  953M  100  953M    0     0  10.6M      0  0:01:29  0:01:29 --:--:-- 13.7M

# ping toolforge.org

PING toolforge.org (185.15.56.11) 56(84) bytes of data.
64 bytes from toolforge.org (185.15.56.11): icmp_seq=1 ttl=51 time=99.4 ms
64 bytes from toolforge.org (185.15.56.11): icmp_seq=2 ttl=51 time=99.5 ms
64 bytes from toolforge.org (185.15.56.11): icmp_seq=3 ttl=51 time=99.7 ms
64 bytes from toolforge.org (185.15.56.11): icmp_seq=4 ttl=51 time=99.5 ms
64 bytes from toolforge.org (185.15.56.11): icmp_seq=5 ttl=51 time=99.5 ms

The speeds you reported are perfectly normal.

For the website causing you the problems, did you try with the browser network inspector, to see if there is any particular resource download causing the slowness?

Example:

image.png (1×2 px, 1 MB)

The problem seems to be fixed for now. The loading speed is not very fast but currently absolutely usable. At the time I created this report the respond times for the pbf files were around 30 to 60 seconds.

The current speeds are around around 200-800ms:

Screenshot_20240419_122852.png (705×1 px, 436 KB)

I will write here if the response times go up like this again.

The problem is currently present again. I made some measurements with an interesting result. There seems to be some kind of insufficient peering capacity when the download comes directly from eqiad and is not on some cache in Europe.

download from toolforge.org:

telekom connection:

curl -O https://network-tests.toolforge.org/files/10MB.bin
  % Total    % Received % Xferd  Average Speed   Time    Time     Time  Current
                                 Dload  Upload   Total   Spent    Left  Speed
100 9765k  100 9765k    0     0  28998      0  0:05:44  0:05:44 --:--:-- 34808

traceroute toolforge.org
traceroute to toolforge.org (185.15.56.11), 30 hops max, 60 byte packets
 1  fritz.box (192.168.178.1)  1.037 ms  1.198 ms  1.388 ms
 2  p3e9bf038.dip0.t-ipconnect.de (62.155.240.56)  10.072 ms  10.060 ms  10.667 ms
 3  b-eh3-i.B.DE.NET.DTAG.DE (62.154.46.210)  10.655 ms b-eh3-i.B.DE.NET.DTAG.DE (217.5.72.70)  10.730 ms b-eh3-i.B.DE.NET.DTAG.DE (62.154.46.210)  11.494 ms
 4  80.156.161.138 (80.156.161.138)  10.707 ms  10.777 ms  11.458 ms
 5  bei-b4-link.ip.twelve99.net (62.115.112.156)  12.977 ms  12.966 ms  13.270 ms
 6  bei-b3-link.ip.twelve99.net (62.115.112.90)  13.428 ms  7.268 ms  8.914 ms
 7  * ffm-bb2-link.ip.twelve99.net (62.115.136.76)  71.658 ms  73.970 ms
 8  prs-bb2-link.ip.twelve99.net (62.115.122.138)  34.272 ms  34.336 ms  31.657 ms
 9  rest-bb1-link.ip.twelve99.net (62.115.122.159)  110.323 ms  110.570 ms  113.942 ms
10  * ash-b2-link.ip.twelve99.net (62.115.123.123)  114.525 ms ash-b2-link.ip.twelve99.net (62.115.138.190)  114.571 ms
11  wikimedia-ic-308845.ip.twelve99-cust.net (80.239.132.226)  114.632 ms  115.177 ms  115.353 ms
12  * * *
13  cloudgw1001.eqiad1.wikimediacloud.org (185.15.56.245)  122.312 ms  121.867 ms  121.919 ms
14  toolforge.org (185.15.56.11)  122.345 ms  123.785 ms  122.589 ms
15  * * *

hetzner server:

curl -O https://network-tests.toolforge.org/files/10MB.bin
  % Total    % Received % Xferd  Average Speed   Time    Time     Time  Current
                                 Dload  Upload   Total   Spent    Left  Speed
100 9765k  100 9765k    0     0  5816k      0  0:00:01  0:00:01 --:--:-- 5812k

curl -O https://network-tests.toolforge.org/files/1GB.bin
  % Total    % Received % Xferd  Average Speed   Time    Time     Time  Current
                                 Dload  Upload   Total   Spent    Left  Speed
100  953M  100  953M    0     0  7413k      0  0:02:11  0:02:11 --:--:-- 6235k

traceroute toolforge.org
traceroute to toolforge.org (185.15.56.11), 30 hops max, 60 byte packets
 1  static.193.97.9.5.clients.your-server.de (5.9.97.193)  0.443 ms  0.409 ms  0.390 ms
 2  core21.fsn1.hetzner.com (213.239.254.165)  0.526 ms  0.503 ms core24.fsn1.hetzner.com (213.239.245.149)  10.710 ms
 3  juniper5.nbg1.hetzner.com (213.239.252.249)  2.635 ms static.213-239-254-234.clients.your-server.de (213.239.254.234)  2.613 ms juniper6.nbg1.hetzner.com (213.239.254.222)  2.707 ms
 4  nug-b1-link.ip.twelve99.net (62.115.183.232)  2.986 ms nug-b2-link.ip.twelve99.net (62.115.50.222)  5.547 ms nug-b1-link.ip.twelve99.net (213.248.70.0)  3.089 ms
 5  * ffm-bb1-link.ip.twelve99.net (62.115.113.146)  6.016 ms  6.109 ms
 6  * prs-bb1-link.ip.twelve99.net (62.115.123.13)  14.354 ms *
 7  ash-bb2-link.ip.twelve99.net (62.115.112.242)  101.002 ms  101.963 ms  102.137 ms
 8  ash-b2-link.ip.twelve99.net (62.115.123.125)  99.595 ms  99.863 ms  99.842 ms
 9  wikimedia-ic-308845.ip.twelve99-cust.net (80.239.132.226)  102.323 ms  102.213 ms  102.196 ms
10  * cloudgw1001.eqiad1.wikimediacloud.org (185.15.56.245)  97.456 ms *
11  cloudgw1001.eqiad1.wikimediacloud.org (185.15.56.245)  99.303 ms toolforge.org (185.15.56.11)  97.466 ms cloudgw1001.eqiad1.wikimediacloud.org (185.15.56.245)  99.317 ms
12  toolforge.org (185.15.56.11)  99.350 ms  99.561 ms  99.343 ms
13  * * *

download from upload.wikimedia.org:

telekom connection:

curl -O https://upload.wikimedia.org/wikipedia/commons/d/da/Geroldsauer_Wasserfall_2020-03-13.webm
  % Total    % Received % Xferd  Average Speed   Time    Time     Time  Current
                                 Dload  Upload   Total   Spent    Left  Speed
100 1678M  100 1678M    0     0  22.4M      0  0:01:14  0:01:14 --:--:-- 21.9M

traceroute upload.wikimedia.org
traceroute to upload.wikimedia.org (185.15.59.240), 30 hops max, 60 byte packets
 1  fritz.box (192.168.178.1)  1.013 ms  1.189 ms  1.475 ms
 2  p3e9bf038.dip0.t-ipconnect.de (62.155.240.56)  11.244 ms  11.233 ms  11.317 ms
 3  ams-sb5-i.AMS.NL.NET.DTAG.DE (217.239.52.45)  23.794 ms  24.499 ms ams-sb5-i.AMS.NL.NET.DTAG.DE (217.239.54.182)  22.974 ms
 4  * * *

hetzner server:

curl -O https://upload.wikimedia.org/wikipedia/commons/d/da/Geroldsauer_Wasserfall_2020-03-13.webm
  % Total    % Received % Xferd  Average Speed   Time    Time     Time  Current
                                 Dload  Upload   Total   Spent    Left  Speed
100 1678M  100 1678M    0     0  25.9M      0  0:01:04  0:01:04 --:--:-- 28.7M

traceroute upload.wikimedia.org
traceroute to upload.wikimedia.org (185.15.59.240), 30 hops max, 60 byte packets
 1  static.193.97.9.5.clients.your-server.de (5.9.97.193)  0.489 ms  0.463 ms  0.510 ms
 2  core24.fsn1.hetzner.com (213.239.245.149)  0.426 ms core22.fsn1.hetzner.com (213.239.254.189)  0.473 ms core23.fsn1.hetzner.com (213.239.245.109)  0.389 ms
 3  core5.fra.hetzner.com (213.239.224.78)  4.893 ms  4.875 ms  5.018 ms
 4  * * *

download from dumps.wikimedia.org:

telekom connection:

curl -O https://dumps.wikimedia.org/commonswiki/20240420/commonswiki-20240420-stub-articles1.xml.gz
  % Total    % Received % Xferd  Average Speed   Time    Time     Time  Current
                                 Dload  Upload   Total   Spent    Left  Speed
100  653M  100  653M    0     0  3967k      0  0:02:48  0:02:48 --:--:-- 4037k

traceroute dumps.wikimedia.org
traceroute to dumps.wikimedia.org (208.80.154.71), 30 hops max, 60 byte packets
 1  fritz.box (192.168.178.1)  1.418 ms  1.731 ms  2.014 ms
 2  p3e9bf038.dip0.t-ipconnect.de (62.155.240.56)  13.289 ms  13.277 ms  13.456 ms
 3  b-eh3-i.B.DE.NET.DTAG.DE (217.5.72.74)  18.428 ms  18.417 ms b-eh3-i.B.DE.NET.DTAG.DE (217.239.39.2)  13.661 ms
 4  b-eh3-i.B.DE.NET.DTAG.DE (217.239.39.2)  13.983 ms  15.689 ms 80.156.161.138 (80.156.161.138)  13.641 ms
 5  bei-b4-link.ip.twelve99.net (62.115.112.156)  15.859 ms 80.156.161.138 (80.156.161.138)  15.847 ms bei-b4-link.ip.twelve99.net (62.115.112.156)  16.044 ms
 6  bei-b3-link.ip.twelve99.net (62.115.112.90)  16.747 ms  7.522 ms  15.049 ms
 7  bei-b3-link.ip.twelve99.net (62.115.112.90)  15.030 ms  15.018 ms  15.068 ms
 8  * prs-bb2-link.ip.twelve99.net (62.115.122.138)  34.618 ms  34.841 ms
 9  prs-bb2-link.ip.twelve99.net (62.115.122.138)  38.007 ms  37.996 ms rest-bb1-link.ip.twelve99.net (62.115.122.159)  114.491 ms
10  ash-b2-link.ip.twelve99.net (62.115.138.190)  114.722 ms rest-bb1-link.ip.twelve99.net (62.115.122.159)  117.872 ms ash-b2-link.ip.twelve99.net (62.115.123.123)  118.042 ms
11  wikimedia-ic-308845.ip.twelve99-cust.net (80.239.132.226)  118.363 ms  121.071 ms  122.516 ms
12  wikimedia-ic-308845.ip.twelve99-cust.net (80.239.132.226)  109.684 ms * *
13  * * *

hetzner server:

curl -O https://dumps.wikimedia.org/commonswiki/20240420/commonswiki-20240420-stub-articles1.xml.gz
  % Total    % Received % Xferd  Average Speed   Time    Time     Time  Current
                                 Dload  Upload   Total   Spent    Left  Speed
100  653M  100  653M    0     0  3961k      0  0:02:48  0:02:48 --:--:-- 4049k

traceroute dumps.wikimedia.org
traceroute to dumps.wikimedia.org (208.80.154.71), 30 hops max, 60 byte packets
 1  static.193.97.9.5.clients.your-server.de (5.9.97.193)  0.388 ms  0.361 ms  0.446 ms
 2  * core24.fsn1.hetzner.com (213.239.245.149)  0.597 ms core22.fsn1.hetzner.com (213.239.254.189)  0.253 ms
 3  juniper5.nbg1.hetzner.com (213.239.254.218)  2.589 ms static.213-239-254-234.clients.your-server.de (213.239.254.234)  2.813 ms juniper5.nbg1.hetzner.com (213.239.252.249)  2.713 ms
 4  * * nug-b2-link.ip.twelve99.net (62.115.50.222)  5.545 ms
 5  prs-bb2-link.ip.twelve99.net (62.115.112.214)  16.427 ms  16.564 ms ffm-bb1-link.ip.twelve99.net (62.115.113.146)  6.052 ms
 6  * * rest-bb1-link.ip.twelve99.net (62.115.122.159)  97.763 ms
 7  * ash-bb2-link.ip.twelve99.net (62.115.112.242)  101.148 ms  100.871 ms
 8  ash-b2-link.ip.twelve99.net (62.115.123.125)  99.937 ms  99.969 ms  99.954 ms
 9  wikimedia-ic-308845.ip.twelve99-cust.net (80.239.132.226)  99.653 ms  99.409 ms  99.647 ms
10  * * *

This seems to be a problem of the Deutsche Telekom network. I asked them for a statement on this. I think this can therefore become closed. But if this is not fixed soon it might be good to document this problem somewhere.