Page MenuHomePhabricator

Establish baseline performance of Python/WSGI frameworks
Closed, ResolvedPublic

Assigned To
Authored By
Eevans
Nov 8 2018, 8:05 PM
Referenced Files
F27541633: Requests%2Fsec.png
Dec 13 2018, 10:17 PM
F27541641: Requests%2Fsec (without Meinheld).png
Dec 13 2018, 10:17 PM
F27541647: Latency.png
Dec 13 2018, 10:17 PM
F27541650: Errors.png
Dec 13 2018, 10:17 PM
F27541490: Meinheld.png
Dec 13 2018, 10:10 PM
F27541501: Meinheld Errors.png
Dec 13 2018, 10:10 PM
F27541496: Meinheld Latency.png
Dec 13 2018, 10:10 PM
F27424713: Screenshot_2018-12-07 Preliminary Results(4).png
Dec 7 2018, 7:32 PM

Description

Prior to committing to a framework and a WSGI server we decided to test the following servers with no framework: cherrypy, gunicorn, meinheld, and uwsgi. The list of servers is short and was chosen based on current uses, documentation, stack overflow resources, and community size. Suggestions for other servers are welcomed.

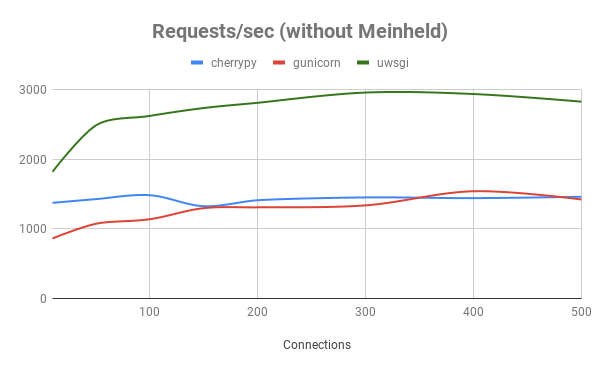
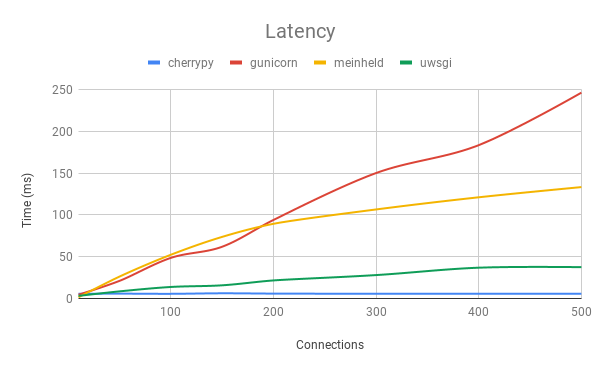
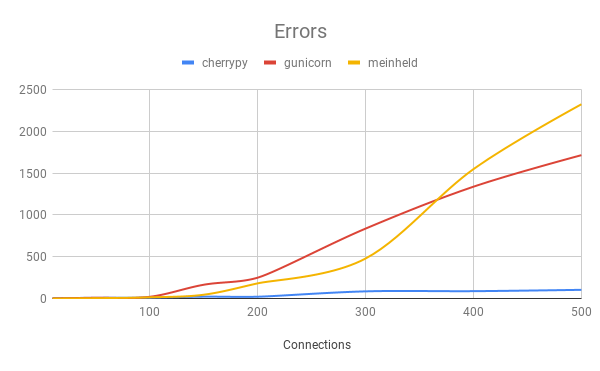
The servers ran on a Debian virtual machine with 2 CPU cores and 4 GB RAM. They were tested from another identical virtual machine using wrk, an HTTP benchmarking tool. The servers were tested with an increasing number of simultaneous connections, ranging from 10 to 500. Each test lasted 3 minutes and was repeated 3 times. The average of the results can be found in the graphs below. We chose to focus on the requests/second, latency, and errors. uwsgi errors were not included due to wrk misidentifying uwsgi responses as read errors.

More information on the methodology and code base can be found in the repository.

Results

WSGI container/server performance

Requests%2Fsec.png (371×600 px, 11 KB)
Requests%2Fsec (without Meinheld).png (371×600 px, 14 KB)
Latency.png (371×600 px, 16 KB)
Errors.png (371×600 px, 14 KB)

Python framework performance

Meinheld.png (371×600 px, 11 KB)
Meinheld Latency.png (371×600 px, 16 KB)
Meinheld Errors.png (371×600 px, 12 KB)

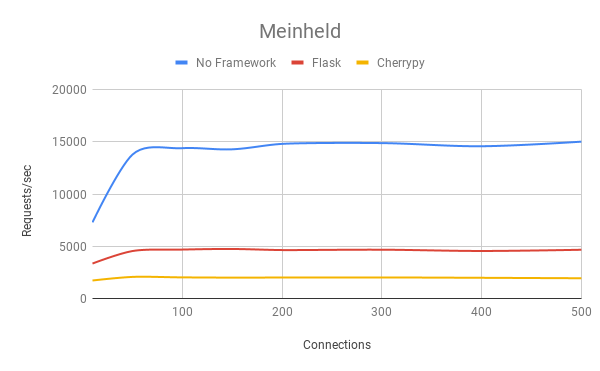
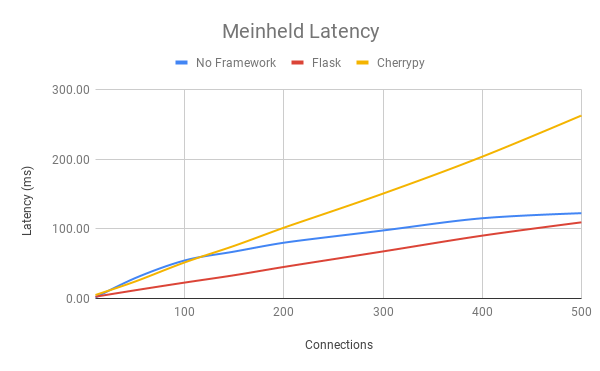
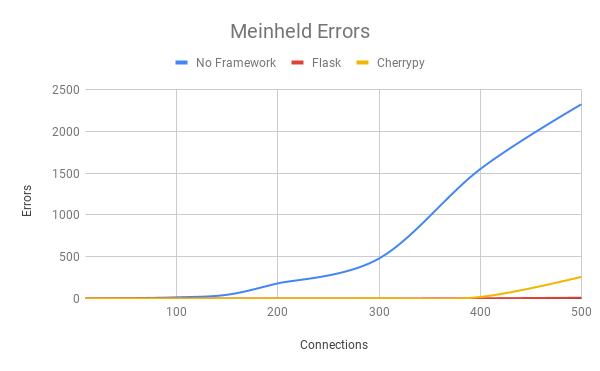
To better understand the performance costs of frameworks the tests above were rerun using the same environment but with two popular frameworks, Flask and Cherrypy. Suggestions for other frameworks are welcomed.

The graphs above compare meinheld’s requests/second, latency, and errors in Flask, Cherrypy, and without a framework. Results for the other servers can be found in the spreadsheet.


See also: T221292: Establish performance of the session storage service

Event Timeline

Eevans triaged this task as Medium priority.Nov 8 2018, 8:05 PM
Eevans created this task.

Kask performance testing is on-going, but I wanted to share some initial (early) results:

Methodology

Kask running on sessionstore1001.eqiad.wmnet (w/ open files bumped to 4096)

[[ https://github.com/wg/wrk | wrk ]] run from sessionstore1002.eqiad.wmnet (threads 8, concurrency 4096, duration 5 minutes). All requests were GETs of a single key with a value trivial in size.

Results

52k reqs/sec throughput
19.54ms average latency
50% 36.67ms
75% 37.15ms
90% 37.37ms
99% 39.36ms

Takeaways

The throughput is quite good, I see no problems in this regard.

The latency numbers are...suspicious. The numbers seen here are eerily close to what I see locally on my notebook, despite very different throughput. Additionally, the Prometheus metrics from Kask paint an even stranger picture:

...
http_request_duration_seconds_bucket{code="200",method="GET",le="0.001"} 2.756884e+06
http_request_duration_seconds_bucket{code="200",method="GET",le="0.0025"} 7.932338e+06
http_request_duration_seconds_bucket{code="200",method="GET",le="0.005"} 8.487417e+06
http_request_duration_seconds_bucket{code="200",method="GET",le="0.01"} 8.54812e+06
http_request_duration_seconds_bucket{code="200",method="GET",le="0.025"} 8.552673e+06
http_request_duration_seconds_bucket{code="200",method="GET",le="0.05"} 1.7099048e+07
http_request_duration_seconds_bucket{code="200",method="GET",le="0.1"} 1.7108523e+07
http_request_duration_seconds_bucket{code="200",method="GET",le="0.25"} 1.7108744e+07
http_request_duration_seconds_bucket{code="200",method="GET",le="0.5"} 1.7108744e+07
http_request_duration_seconds_bucket{code="200",method="GET",le="1"} 1.7108744e+07
http_request_duration_seconds_bucket{code="200",method="GET",le="+Inf"} 1.7108744e+07
http_request_duration_seconds_sum{code="200",method="GET"} 328809.99557739915
http_request_duration_seconds_count{code="200",method="GET"} 1.7108744e+07
...

The distribution here indicates that about half of the requests fall between 25-50ms, and the other half (49.6%) are less than or equal to 5ms; 46.3% are less than or equal to 2.5%! Taken together with the numbers from wrk, it would seem that roughly 1/2 of the requests are 37ms (+/-2ms), and ~1/2 that are 2.5ms (or less).

Next steps

  • Determine source of bizarre latency distribution
  • Get Cassandra dashboards setup (https://gerrit.wikimedia.org/r/497848)
  • Get numbers from a more representative request load (GET, POST & DELETE)
Eevans renamed this task from Establish baseline performance of the session storage service to Establish baseline performance of Python/WSGI frameworks.Apr 17 2019, 8:58 PM
Eevans closed this task as Resolved.
Eevans updated the task description. (Show Details)