Page MenuHomePhabricator

Establish performance of the session storage service
Closed, ResolvedPublic

Description

Prior to moving to production, we should benchmark (and document) the performance of the session storage service under mixed workloads. This information should prove invaluable in validating the implementation, providing a baseline for any subsequent optimizations, and in future capacity planning.

NOTE: Current estimations put production request rates (per-datcenter) at ~30k reads/sec, ~100 writes/sec, and total data set size at ~3G (uncompressed).

Environment

  • Cluster
    • sessionstore1001
    • sessionstore1002
    • sessionstore1003
    • sessionstore2001
    • sessionstore2002
    • sessionstore2003

Each machine is a dual Intel Xeon Silver 4110 2.1G (8C, 16T) w/ 64G RAM, 2 @ 128G SSDs, and 1 gbit NIC.

NOTE: While this is the production cluster, it is otherwise not being utilized at the time of testing.

Every node runs a single instance of Cassandra 3.11.2 (6 node cluster). All Cassandra data (commitlog, sstables, etc) shares a RAID-1.

Kask is run from screen session on sessionstore1001, port 8080.

wrk is executed from sessionstore1002. A Lua script is used to create a randomized mixed workload from a pregenerated JSON-formatted file:

$ wrk --latency -t8 -c2048 -d10m -s multi-request-json.lua http://sessionstore1001.eqiad.wmnet:8080
...

Results

ThreadsConcurrencySize (k/v)Ratio (r/w)Throughput50p latency99p latencyErrors
810248/16100:152610/s20.76ms39.01ms0
820488/16100:171899/s37.94245.18ms620 (0.001%)
8102432/128100:152343/s21.75ms40.50ms0
8204832/128100:167877/s38.33ms228.67ms2160 (0.005%)
8102432/2048100:134641/s38.28ms140.04ms0
8204832/2048100:133892/s48.97ms376.76ms0
8307232/2048100:134832/s72.68ms572.14ms773987 (3.7%)

Caveats, Observations & Comments

  • Errors in all cases above were the result of Cassandra timeouts
  • No effort has (yet) been made to tune Cassandra for this workload
  • Kask and wrk are co-located on two of the Cassandra nodes; Resource contention between the database, application, and benchmark-er influences the results
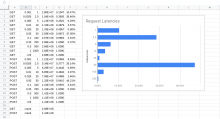
  • As noted in the comments, latency distribution would suggest that something adds ~40ms to ~1/2 of requests (see Figure 1)
Screenshot_2019-04-18 Untitled spreadsheet.png (641×1 px, 96 KB)
Figure 1: Latency distributions

Event Timeline

Eevans triaged this task as Medium priority.Apr 17 2019, 8:54 PM

Details on test methodology, and some initial results are forthcoming, but to elaborate on comments made elsewhere:

wrk produces latency information that includes 50, 75, 90, and 99p quantiles, for example:

Running 10m test @ http://sessionstore1001.eqiad.wmnet:8080
  8 threads and 1028 connections
  Thread Stats   Avg      Stdev     Max   +/- Stdev
    Latency    23.26ms   24.29ms 472.78ms   96.41%
    Req/Sec     6.00k   611.79     7.69k    78.24%
  Latency Distribution
     50%   30.72ms
     75%   38.03ms
     90%   40.84ms
     99%   98.65ms
  28669438 requests in 10.00m, 3.23GB read
Requests/sec:  47774.78
Transfer/sec:      5.51MB

But that doesn't paint a complete picture. Looking at the distribution of request latency according to the Prometheus metrics (which are consistent with the above), you can see that ~50% of the requests are at or below 10ms (~30% are at or below 2.5ms). Most the remaining are in the 50ms range. Clearly there is something occurring in Kask that adds (an oddly consistent) 40-50ms on roughly half the requests. That will need to be figured out, but this is worth thinking about in terms of what/how we measure latencies.

Screenshot_2019-04-18 Untitled spreadsheet.png (641×1 px, 96 KB)

@Eevans should we break out a separate task for identifying the cause of the extra 40-50ms delay?

Also, have you broken out GET/SET/DELETE requests?

@Eevans should we break out a separate task for identifying the cause of the extra 40-50ms delay?

We can; If it would be helpful to you

Also, have you broken out GET/SET/DELETE requests?

I have not.

It seems like where your performance focus is right now, so let's call it out.

Also, is this task done when we're within the boundaries of T211721 or is the task just to have a tool to do measurements?

@Eevans maybe the mystery of the longer requests is just that they're writes instead of reads?

Also, is this task done when we're within the boundaries of T211721 or is the task just to have a tool to do measurements?

I honestly don't know.

T211721 ought to have been done as a prerequisite to building the service (to inform the implementation). That's why it was opened. It should have been based on our expectations for page latency, perhaps with some cost-benefit element, weighing the hit in latency we were willing to accept in exchange for the feature. Instead, it sort of devolved into an exercise of trying to guess where we'd end up, working backward to plug those numbers into the SLA. If that's the still the plan then yes, I guess we finish this issue and plug the resulting numbers into T211721 for our SLA.

@Eevans maybe the mystery of the longer requests is just that they're writes instead of reads?

That's not it.

@Eevans maybe the mystery of the longer requests is just that they're writes instead of reads?

That's not it.

Cool. Looks like you've got some middleware for prometheus instrumentation in there, so I guess a next step would be figuring out if the difference shows up there, too.

Also, is this task done when we're within the boundaries of T211721 or is the task just to have a tool to do measurements?

I honestly don't know.

OK. Let's say that it's done when you've separated out GET/POST/DELETE.

T211721 ought to have been done as a prerequisite to building the service (to inform the implementation). That's why it was opened. It should have been based on our expectations for page latency, perhaps with some cost-benefit element, weighing the hit in latency we were willing to accept in exchange for the feature. Instead, it sort of devolved into an exercise of trying to guess where we'd end up, working backward to plug those numbers into the SLA. If that's the still the plan then yes, I guess we finish this issue and plug the resulting numbers into T211721 for our SLA.

I don't think it makes sense to go backwards from what we have to what we want.

There are some numbers here. They're pretty high, but not as high as the ones you started off with. I think we're closing in on what's acceptable.

And I agree that getting those numbers sooner and clearer would have been great. That's my fault. For future services, I'm going to make sure we have performance expectations ahead of time, rather than after the implementation starts.