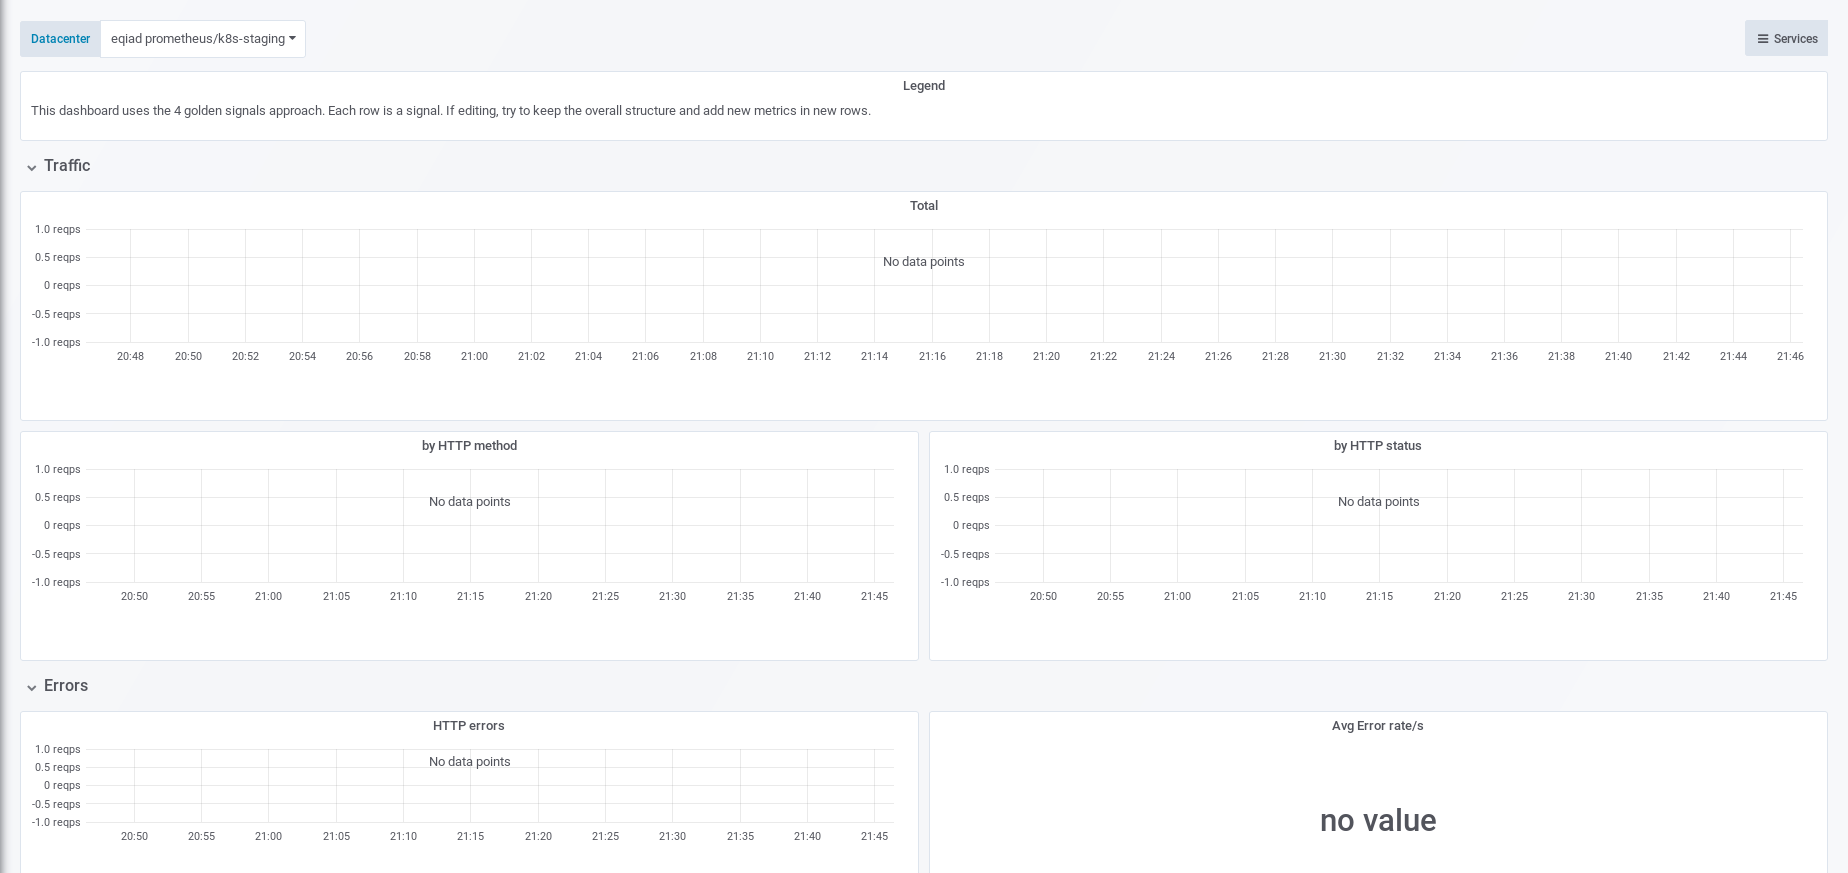
The Grafana dashboards for sessionstore staging are not working.
 |
|---|
| sessionstore dashboard after 10mins of traffic generation |
| Eevans | |
| Aug 14 2019, 9:50 PM |
| F30029426: image.png | |
| Aug 14 2019, 9:50 PM |
The Grafana dashboards for sessionstore staging are not working.
|
|---|
| sessionstore dashboard after 10mins of traffic generation |
| Status | Subtype | Assigned | Task | ||
|---|---|---|---|---|---|
| Resolved | aaron | T88445 MediaWiki active/active datacenter investigation and work (tracking) | |||
| Resolved | Eevans | T206016 Create a service for session storage | |||
| Resolved | Eevans | T221292 Establish performance of the session storage service | |||
| Resolved | Eevans | T229697 Investigate Kask request latency | |||
| Resolved | Eevans | T230515 Grafana dashboards for sessionstore, k8s staging, are not working |
I 've noticed that too. After some fiddling around I figured out that in the staging helm release, the wrong port had been passed at some point and there was port 8080 instead of 8081. I 've deleted the release and re-synced to make sure any old artifacts no longer exists. Graphs work now again