Page MenuHomePhabricator

AQS Cassandra READ timeouts caused an increase of 503s
Closed, ResolvedPublic5 Estimated Story Points

Assigned To
Authored By
elukey
Aug 25 2016, 9:57 AM
Referenced Files
F4419678: Screen Shot 2016-08-31 at 2.58.57 PM.png
Aug 31 2016, 12:59 PM
F4419667: Screen Shot 2016-08-31 at 2.48.55 PM.png
Aug 31 2016, 12:49 PM
F4419651: Screen Shot 2016-08-31 at 2.41.06 PM.png
Aug 31 2016, 12:41 PM
F4419640: Screen Shot 2016-08-31 at 2.34.20 PM.png
Aug 31 2016, 12:41 PM
F4419637: Screen Shot 2016-08-31 at 2.34.36 PM.png
Aug 31 2016, 12:41 PM
F4414211: Screen Shot 2016-08-29 at 12.54.07 PM.png
Aug 29 2016, 7:56 PM
F4414209: Screen Shot 2016-08-29 at 12.54.25 PM.png
Aug 29 2016, 7:56 PM
F4399281: Screen Shot 2016-08-25 at 11.53.04 AM.png
Aug 25 2016, 9:57 AM

Description

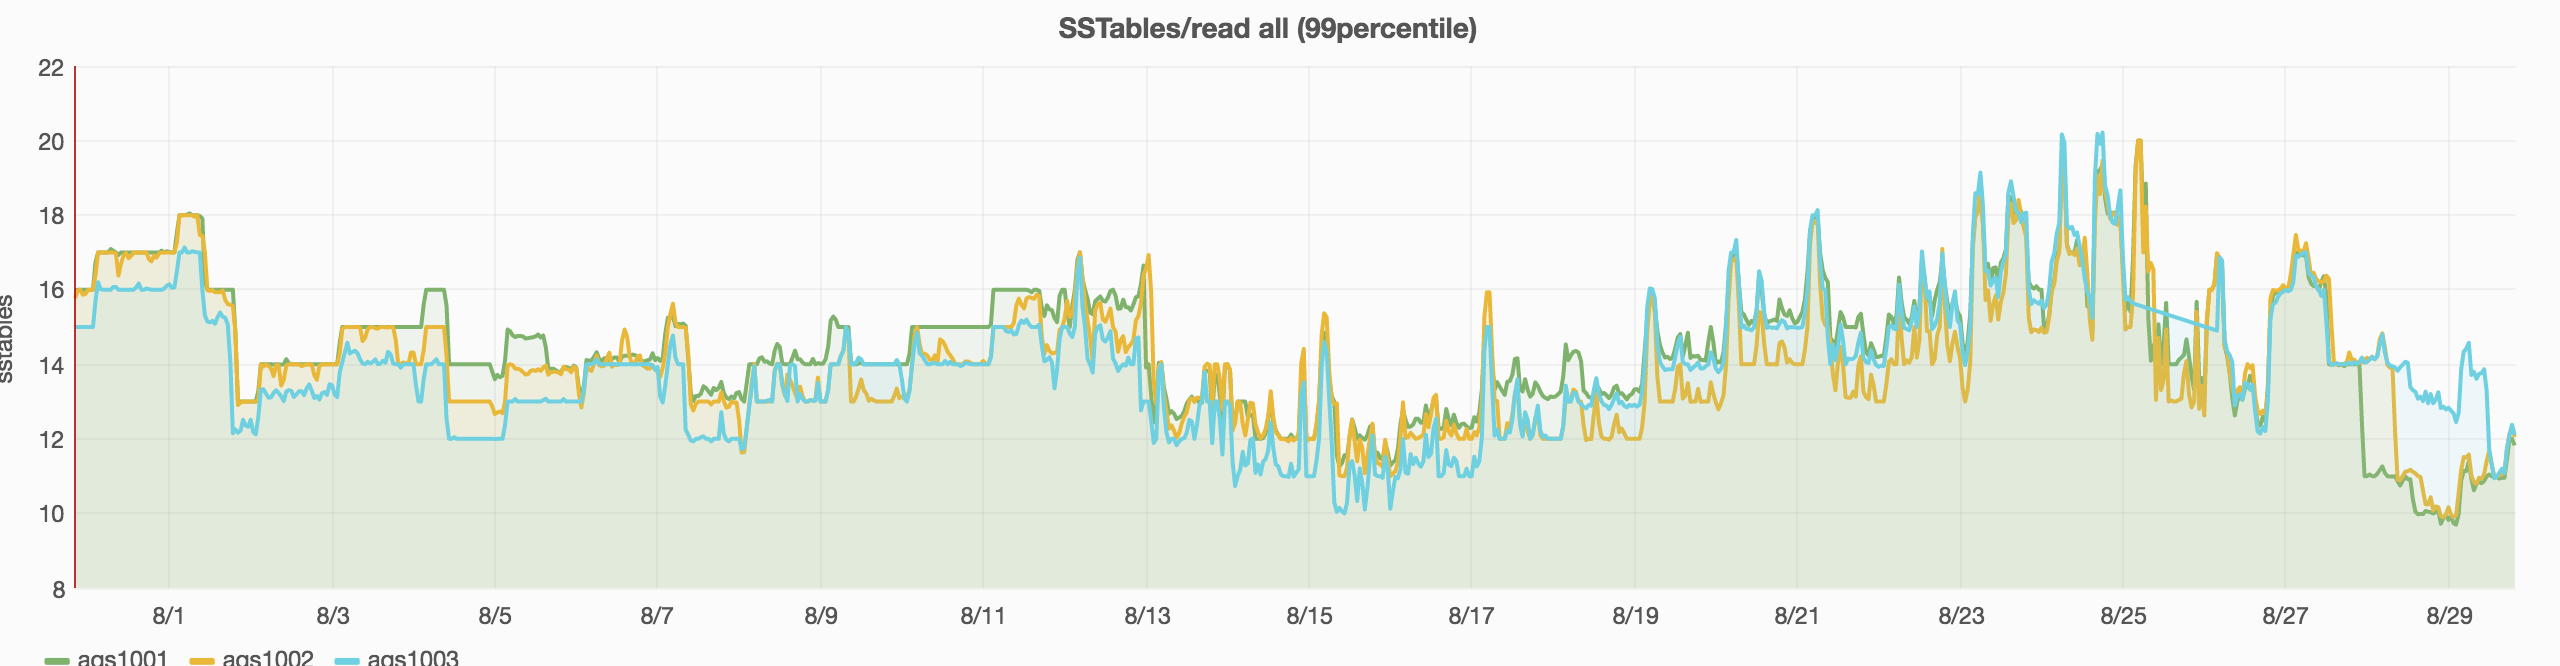
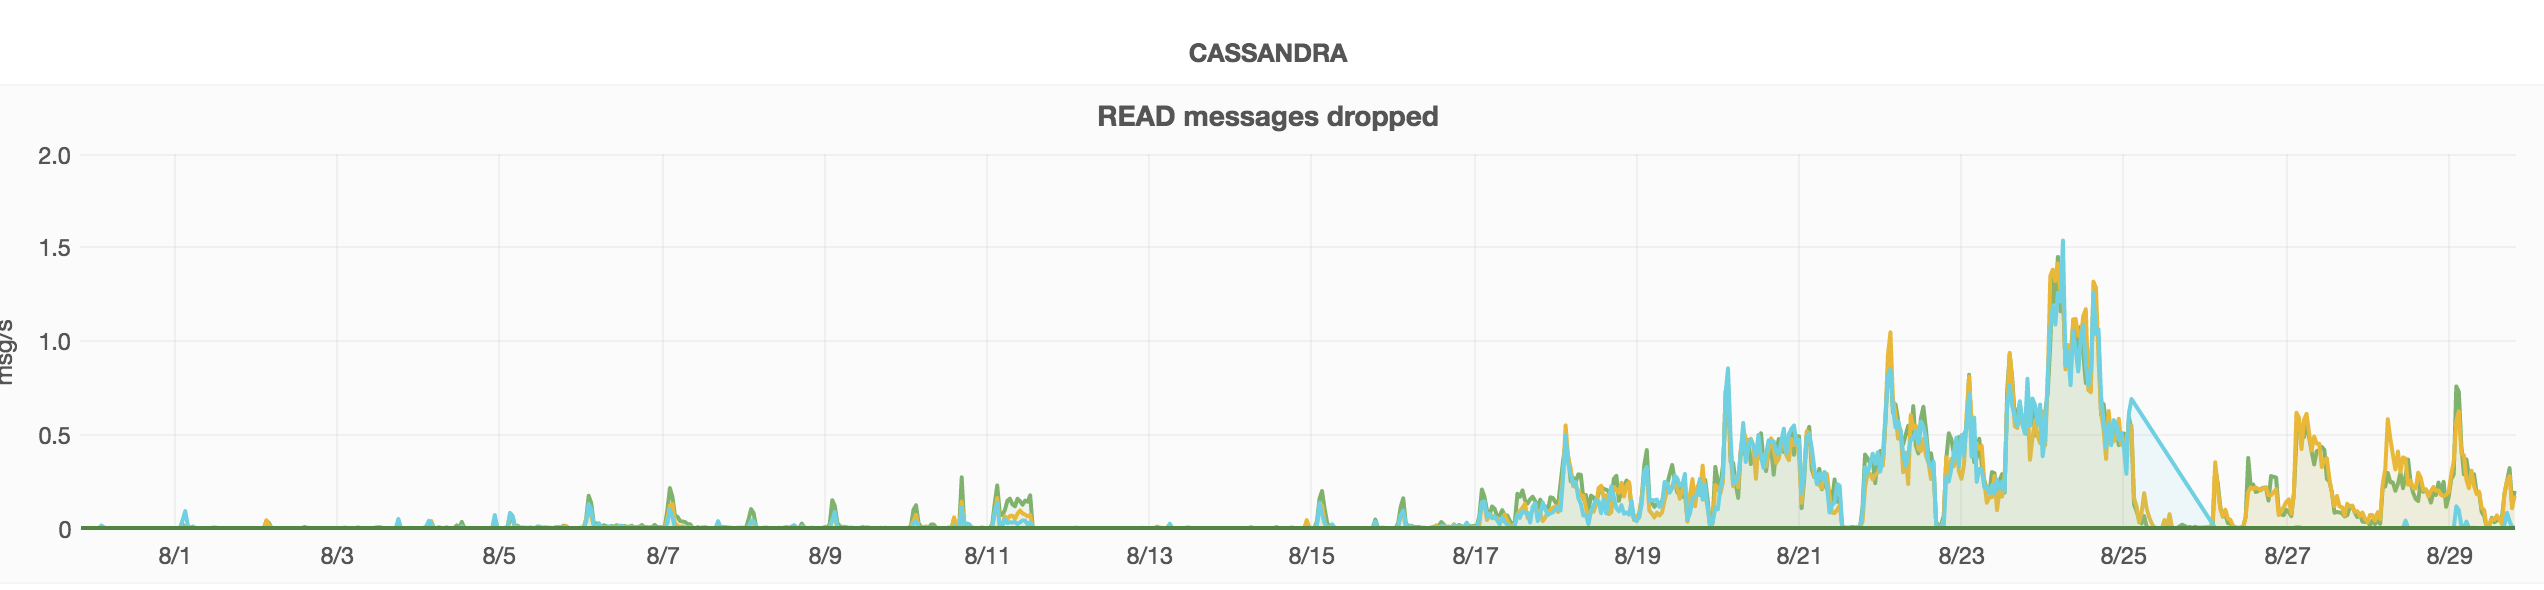
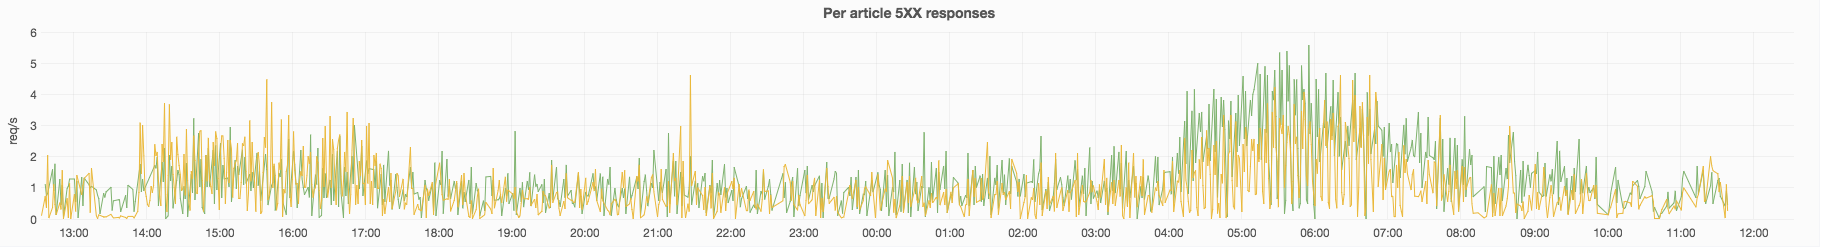
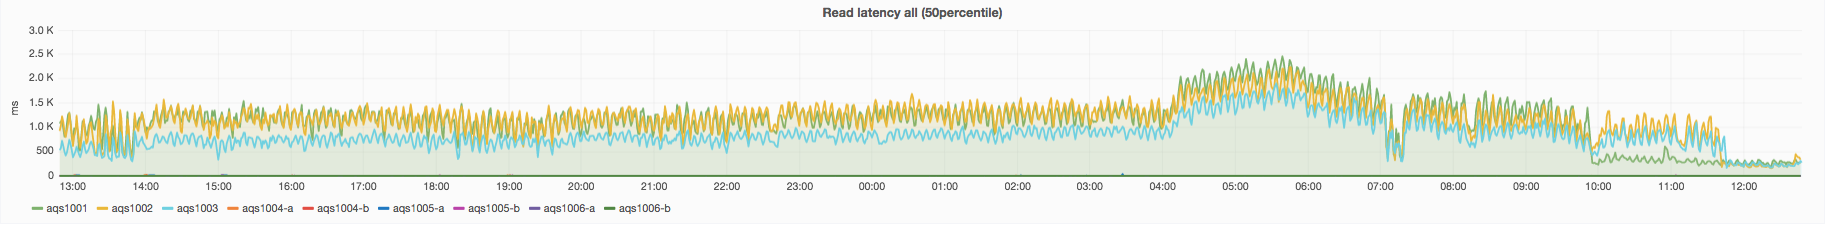
The Cassandra READ timeouts increased a lot from Aug 17th causing also an increase in AQS 503:

Screen Shot 2016-08-25 at 11.53.04 AM.png (716×1 px, 110 KB)

From the logs it seems that we are experiencing again a system auth timeout issue. It should have been resolved with our latest patches, namely:

  • increasing permissions_validity_in_ms to 10 minutes
  • switching Restbase to use the 'aqs' username rather than the 'cassandra' one (admin requiring QUORUM instead of LOCAL ONE)

There seems to be no evident reasons why this started all of a sudden, but we'd need to figure out what caused it.

https://issues.apache.org/jira/browse/CASSANDRA-8194 could be useful but doesn't explain the start of the issue.

Event Timeline

Milimetric triaged this task as Medium priority.Aug 25 2016, 4:55 PM

The # of SSTables read correlates with read messages dropped

Next step that I'd like to do is compare the variation in traffic from the 17th onwards, to see if different queries started to land on AQS.

The last outage that we registered on the 26th was related to a OOM:

Dates in UTC:

03:09  <icinga-wm> PROBLEM - cassandra CQL 10.64.48.117:9042 on aqs1003 is CRITICAL: Connection refused
03:23  <icinga-wm> RECOVERY - cassandra CQL 10.64.48.117:9042 on aqs1003 is OK: TCP OK - 0.002 second response time on port 9042
ERROR [SharedPool-Worker-21] 2016-08-26 03:03:08,936 JVMStabilityInspector.java:117 - JVM state determined to be unstable.  Exiting forcefully due to:
java.lang.OutOfMemoryError: Java heap space
        at org.apache.cassandra.io.util.RandomAccessReader.<init>(RandomAccessReader.java:76) ~[apache-cassandra-2.1.13.jar:2.1.13]
        at org.apache.cassandra.io.compress.CompressedRandomAccessReader.<init>(CompressedRandomAccessReader.java:70) ~[apache-cassandra-2.1.13.jar:2.1.13]
        at org.apache.cassandra.io.compress.CompressedRandomAccessReader.open(CompressedRandomAccessReader.java:48) ~[apache-cassandra-2.1.13.jar:2.1.13]
        at org.apache.cassandra.io.util.CompressedPoolingSegmentedFile.createPooledReader(CompressedPoolingSegmentedFile.java:95) ~[apache-cassandra-2.1.13.jar:2.1.13]
        at org.apache.cassandra.io.util.PoolingSegmentedFile.getSegment(PoolingSegmentedFile.java:62) ~[apache-cassandra-2.1.13.jar:2.1.13]
        at org.apache.cassandra.io.sstable.SSTableReader.getFileDataInput(SSTableReader.java:1902) ~[apache-cassandra-2.1.13.jar:2.1.13]
        at org.apache.cassandra.db.columniterator.IndexedSliceReader.setToRowStart(IndexedSliceReader.java:107) ~[apache-cassandra-2.1.13.jar:2.1.13]
        at org.apache.cassandra.db.columniterator.IndexedSliceReader.<init>(IndexedSliceReader.java:83) ~[apache-cassandra-2.1.13.jar:2.1.13]
        at org.apache.cassandra.db.columniterator.SSTableSliceIterator.createReader(SSTableSliceIterator.java:65) ~[apache-cassandra-2.1.13.jar:2.1.13]
        at org.apache.cassandra.db.columniterator.SSTableSliceIterator.<init>(SSTableSliceIterator.java:42) ~[apache-cassandra-2.1.13.jar:2.1.13]
        at org.apache.cassandra.db.filter.SliceQueryFilter.getSSTableColumnIterator(SliceQueryFilter.java:246) ~[apache-cassandra-2.1.13.jar:2.1.13]
        at org.apache.cassandra.db.filter.QueryFilter.getSSTableColumnIterator(QueryFilter.java:62) ~[apache-cassandra-2.1.13.jar:2.1.13]
        at org.apache.cassandra.db.CollationController.collectAllData(CollationController.java:270) ~[apache-cassandra-2.1.13.jar:2.1.13]
        at org.apache.cassandra.db.CollationController.getTopLevelColumns(CollationController.java:65) ~[apache-cassandra-2.1.13.jar:2.1.13]
        at org.apache.cassandra.db.ColumnFamilyStore.getTopLevelColumns(ColumnFamilyStore.java:2001) ~[apache-cassandra-2.1.13.jar:2.1.13]
        at org.apache.cassandra.db.ColumnFamilyStore.getColumnFamily(ColumnFamilyStore.java:1844) ~[apache-cassandra-2.1.13.jar:2.1.13]
        at org.apache.cassandra.db.Keyspace.getRow(Keyspace.java:353) ~[apache-cassandra-2.1.13.jar:2.1.13]
        at org.apache.cassandra.db.SliceFromReadCommand.getRow(SliceFromReadCommand.java:85) ~[apache-cassandra-2.1.13.jar:2.1.13]
        at org.apache.cassandra.db.ReadVerbHandler.doVerb(ReadVerbHandler.java:47) ~[apache-cassandra-2.1.13.jar:2.1.13]
        at org.apache.cassandra.net.MessageDeliveryTask.run(MessageDeliveryTask.java:64) ~[apache-cassandra-2.1.13.jar:2.1.13]
        at java.util.concurrent.Executors$RunnableAdapter.call(Executors.java:511) ~[na:1.8.0_102]
        at org.apache.cassandra.concurrent.AbstractTracingAwareExecutorService$FutureTask.run(AbstractTracingAwareExecutorService.java:164) ~[apache-cassandra-2.1.13.jar:2.1.13]
        at org.apache.cassandra.concurrent.SEPWorker.run(SEPWorker.java:105) [apache-cassandra-2.1.13.jar:2.1.13]
        at java.lang.Thread.run(Thread.java:745) [na:1.8.0_102]
WARN  [GossipTasks:1] 2016-08-26 03:03:09,049 FailureDetector.java:258 - Not marking nodes down due to local pause of 376385980526 > 5000000000

During the last analytics ops sync we decided to test a rolling restart of cassandra on aqs100[123] to double check if last month's performance improvements (latency going down, no more 50X errors, etc..) were due to the cassandra restarts rather than other changes (the candidates were JVM upgrades and new aqs-loader user).

Result: same big performance improvement registered

Screen Shot 2016-08-31 at 2.34.36 PM.png (248×1 px, 115 KB)

Screen Shot 2016-08-31 at 2.34.20 PM.png (771×1 px, 597 KB)

Screen Shot 2016-08-31 at 2.41.06 PM.png (252×1 px, 193 KB)

aqs1001 was the first at around 9:50 UTC, meanwhile aqs100[23] followed more or less two hours afterwards. Some thing to notice:

  1. latency dropped right after the first restart;
  2. READ message dropped and 50X went away after all the nodes were restarted.

Read latency followed the same pattern:

Screen Shot 2016-08-31 at 2.48.55 PM.png (227×1 px, 156 KB)

The number of IOPS dropped for the raid arrays, for example on aqs1001:

Screen Shot 2016-08-31 at 2.58.57 PM.png (458×1 px, 142 KB)

Today I tried to look into all the per article metrics in Graphite to check for any relevant pattern. The rationale is that $something triggers IOPS on disk that eventually turn into timeouts and user errors.

One good read is http://www.datastax.com/dev/blog/rapid-read-protection-in-cassandra-2-0-2
Cassandra by default elects a node as Coordinator, responsible to write/read data following the consistency chosen (ONE, QUORUM, etc..). By default the coordinator issue a second request to another node if more than p99 latency time has passed as "speculative", and the first one returning will win. This might affect performances when timeouts start to happen since more of them could be triggered by speculative actions. There is a counter metric for the per article keyspace that shows a steady increase (as expected), but its rate per second is not really telling us anything: https://grafana.wikimedia.org/dashboard/db/aqs-elukey?panelId=20&fullscreen

I checked also Key and Row cache, but the latter seems not used at all (even if afaics it is configured). Checked the OS page cache but I don't see huge variations from server-board, maybe there are some Cassandra tunables that I am not aware of.

What it might happen is that a rise in traffic (we observed it during the past month for per article data) causes a lot more IOPs to disks due to reads, and at some point a threshold is crossed and timeouts starts to happen causing 50X. This threshold could be related to big and expensive queries coming from restbase requiring more SSTable reads.

One possible way to have more insight would be http://techblog.netflix.com/2015/07/java-in-flames.html

I checked kernel+jdk should support this. The only requirement would be to start the JVM with -XX:+PreserveFramePointer (that causes a bit of CPU overhead since less optimizations are made)

Milimetric set the point value for this task to 5.Sep 15 2016, 3:51 PM
Milimetric moved this task from Paused to In Progress on the Analytics-Kanban board.
Milimetric moved this task from In Progress to Ready to Deploy on the Analytics-Kanban board.

As agreed with the team we will concentrate on putting the new cluster in production rather than keep going with this investigation. There are too many variables changed between the current one and the new one, we'll restart the investigations if we'll notice the same problem after the switch. I am almost sure that the actual issue is a combination of settings that all together leads to timeouts, almost all related to very slow rotating disks and a lot of random access due to inefficient compaction.