db2034 crashed and the ILO showed
Power: off
Check logs and then reimage the server as it has replication broken
Clone it from db2042
| Marostegui | |
| Oct 31 2016, 9:26 AM |
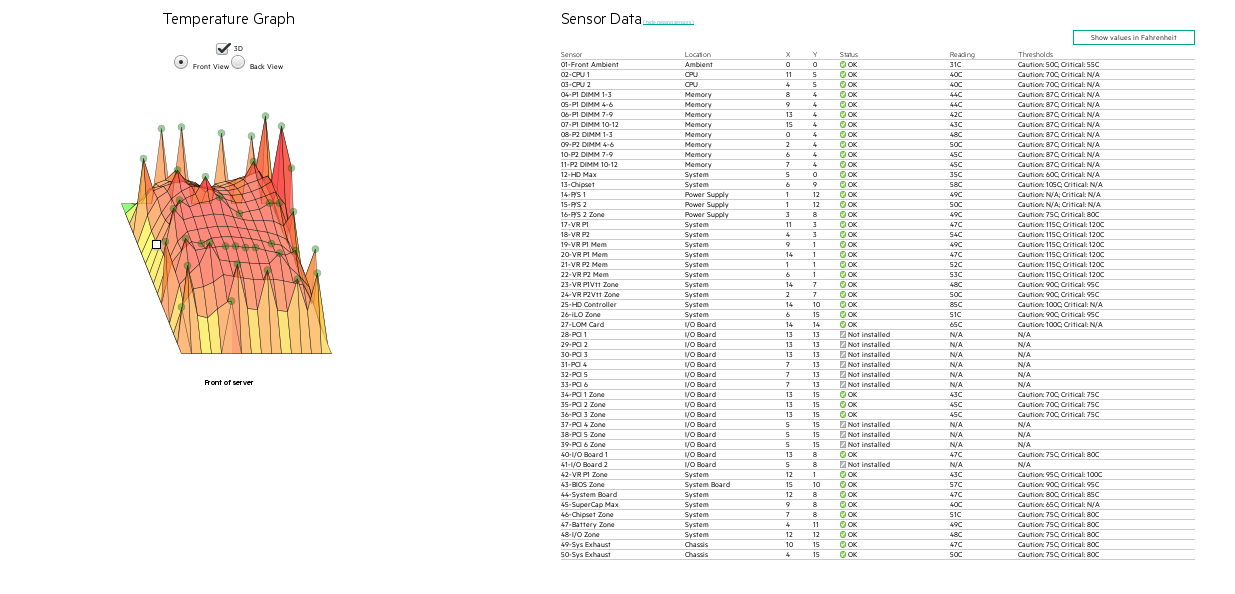
| F5049624: Selection_034.png | |
| Dec 13 2016, 5:44 PM |
| F4735211: iLO - Mozilla Firefox_020.png | |
| Nov 17 2016, 4:17 PM |
| F4735216: iLO: ILOUSE4282HJC - Mozilla Firefox_023.png | |
| Nov 17 2016, 4:17 PM |
| F4735213: iLO - Mozilla Firefox_021.png | |
| Nov 17 2016, 4:17 PM |
| F4735218: iLO: ILOUSE4282HJC - Mozilla Firefox_022.png | |
| Nov 17 2016, 4:17 PM |
| F4710393: HP_USE4282HJC_20161109.ahs | |
| Nov 9 2016, 6:11 PM |
db2034 crashed and the ILO showed
Power: off
Check logs and then reimage the server as it has replication broken
Clone it from db2042
| Status | Subtype | Assigned | Task | ||
|---|---|---|---|---|---|
| Resolved | Marostegui | T150233 db2034 crashes meta ticket | |||
| Resolved | Marostegui | T149553 db2034: investigate its crash and reimage |
@Papaul I have depooled db2048, so we can use that one to swap the PSUs with. Ping me once you are online so I can do the pre work to get it ready
Thanks!
Mentioned in SAL (#wikimedia-operations) [2016-11-29T15:30:57Z] <marostegui> Stop mysql and shutdown db2048 and db2034 for maintenance - T149553
Mentioned in SAL (#wikimedia-operations) [2016-11-29T15:59:24Z] <marostegui> Stop temporarily stop MySQL db2070 maintenance - T149553
Papaul has swapped the PSU so I have started the first test to try to crash db2034 which has now "the new PSU" from db2048.
There were no logs this time. I have cleared them via ILO and will start the process again to see if we get the same PSU related log again.
We have decided to change the PDU sockets it is connected to, we will see what happens now.
ps1-c6-codfw log
	 1  	 Not Available  	EVENT: TCP/IP stack has started
	 2  	 Not Available  	EVENT: System boot complete
	 3  	 Not Available  	EVENT: Humidity sensor "Temp_Humid_Sensor_B1" [B1] detected an event -- reason = Humid Low, humidity = 21 % RH
	 4  	 Not Available  	EVENT: Humidity sensor "Temp_Humid_Sensor_A1" [A1] detected an event -- reason = Humid Low, humidity = 24 % RH
	 5  	 Not Available  	EVENT: Temperature sensor "Temp_Humid_Sensor_B1" [B1] detected an event -- reason = Temp High, temperature = 40.5 Deg. C
	 6  	 Not Available  	EVENT: Temperature sensor "Temp_Humid_Sensor_A1" [A1] detected an event -- reason = Temp High, temperature = 40.5 Deg. C
	 7  	 Not Available  	AUTH: User "root" logged in -- connection source 10.193.0.7 using HTTP
	 8  	 Not Available  	CONFIG: Low humidity alarm value changed to 12 for temperature/humidity sensor "Temp_Humid_Sensor_A1" [A1] by user "root"
	 9  	 Not Available  	CONFIG: Low humidity alarm value changed to 12 for temperature/humidity sensor "Temp_Humid_Sensor_A2" [A2] by user "root"
	 10  	 Not Available  	CONFIG: Low humidity alarm value changed to 12 for temperature/humidity sensor "Temp_Humid_Sensor_B1" [B1] by user "root"
	 11  	 Not Available  	CONFIG: Low humidity alarm value changed to 12 for temperature/humidity sensor "Temp_Humid_Sensor_B2" [B2] by user "root"
	 12  	 Not Available  	EVENT: Humidity sensor "Temp_Humid_Sensor_A1" [A1] recovered from an event -- current status = Normal, humidity = 16 % RH
	 13  	 Not Available  	EVENT: Humidity sensor "Temp_Humid_Sensor_B1" [B1] recovered from an event -- current status = Normal, humidity = 16 % RH
	 14  	 Not Available  	AUTH: User "root" logged out -- connection source 10.193.0.7 using HTTP
	 15  	 Not Available  	EVENT: Temperature/humidity sensor "Temp_Humid_Sensor_B1" [B1] detected a status error -- reason = Lost
	 16  	 Not Available  	EVENT: Temperature sensor "Temp_Humid_Sensor_A2" [A2] detected an event -- reason = Temp High, temperature = 41.5 Deg. C
	 17  	 Not Available  	EVENT: Temperature sensor "Temp_Humid_Sensor_A1" [A1] recovered from an event -- current status = Normal, temperature = 39.0 Deg. C
	 18  	 Not Available  	EVENT: Temperature sensor "Temp_Humid_Sensor_A2" [A2] recovered from an event -- current status = Normal, temperature = 39.0 Deg. C
	 19  	 Not Available  	AUTH: User "root" logged in -- connection source 10.193.0.7 using HTTP
	 20  	 Not Available  	AUTH: User "root" logged out -- connection source 10.193.0.7 using HTTP
	 21  	 Not Available  	AUTH: User "root" logged in -- connection source 208.80.154.149 using HTTP
	 22  	 Not Available  	CONFIG: SNMP SysLocation string changed by user "root"
	 23  	 Not Available  	CONFIG: SNMP SysContact string changed by user "root"
	 24  	 Not Available  	AUTH: User "root" logged out -- connection source 208.80.154.149 using HTTP
	 25  	 Not Available  	AUTH: User "root" logged in -- connection source 10.193.0.7 using HTTP
<< First Page < Previous Page Next Page > Last Page >>
The server crashed again, although this time it took 1:33h to crash it, which is a lot longer than usual. This time we switched its PDU sockets.
Recap:
We still have the same error:
description=System Power Fault Detected (XR: 14 00 MID: FF 4D FC CE C0 FF FF 32 32 0C 0C 00 9C 00 04 01 03 47 00 00 00 00 00 00 00 00 00 00 00 00 00 00)
At the time of the crash this was the top output:
top - 18:51:40 up  1:34,  1 user,  load average: 1.57, 1.90, 1.97
Tasks: 383 total,   2 running, 381 sleeping,   0 stopped,   0 zombie
%Cpu(s):  3.5 us,  2.0 sy,  0.0 ni, 94.5 id,  0.0 wa,  0.0 hi,  0.0 si,  0.0 st
KiB Mem:  16502931+total, 16462036+used,   408956 free,     2192 buffers
KiB Swap:  7812092 total,        0 used,  7812092 free. 15729166+cached Mem

  PID USER      PR  NI    VIRT    RES    SHR S  %CPU %MEM     TIME+ COMMAND
 1237 root      20   0   36712    904    800 R 161.8  0.0 144:26.62 pigz
 1238 root      20   0   27620   2404   2176 S  29.9  0.0  24:53.44 tar
 1235 root      20   0    6328   1688   1564 S  18.3  0.0  11:46.42 nc
 1236 root      20   0    5964   1736   1636 S   8.6  0.0   5:38.50 pv
  224 root      20   0       0      0      0 S   5.0  0.0   2:21.71 kswapd0
  225 root      20   0       0      0      0 S   4.7  0.0   2:45.90 kswapd1
  272 root      20   0       0      0      0 S   1.3  0.0   0:44.79 kworker/17:1
  101 root      20   0       0      0      0 S   1.0  0.0   0:42.83 kworker/18:0
    8 root      20   0       0      0      0 S   0.7  0.0   0:32.77 rcu_sched
   60 root      20   0       0      0      0 S   0.7  0.0   0:20.18 kworker/10:0
  244 root      20   0       0      0      0 S   0.7  0.0   0:20.68 kworker/1:1
 6748 root      20   0       0      0      0 S   0.7  0.0   0:19.84 kworker/0:2
18530 root      20   0       0      0      0 S   0.7  0.0   0:10.90 kworker/3:1
23442 root      20   0       0      0      0 S   0.7  0.0   0:14.94 kworker/19:0
23443 root      20   0       0      0      0 S   0.7  0.0   0:17.10 kworker/11:2
23447 root      20   0       0      0      0 S   0.7  0.0   0:16.10 kworker/12:2
    3 root      20   0       0      0      0 S   0.3  0.0   0:12.52 ksoftirqd/0
I talked to @Papaul and we are going to replace the memory DIMMs. I have started the server again and cleared the ILO logs, so we are ready for the next crash :-)
(Looks like that it is not generating new logs if the previous ones aren't cleared).
I have left 43 instances of cpuburn running on db2034 to see if it crashes the server.
So far we have only see crashes while having high IO operations
We will see if the server also crashes without IO operations but just CPU intense one
Mentioned in SAL (#wikimedia-operations) [2016-11-30T07:06:14Z] <marostegui> Stop mysql db2048 maintenance - T149553
The server survived the whole night without any issues. So looks like the user cpu time/processes do not make the server crash.
I killed all the burning CPU processes and started a transfer from db2048 which killed the host after 30 minutes again.
  date=11/30/2016
  time=07:45
  description=System Power Fault Detected (XR: 14 00 MID: FF 4D FC CE C0 FF FF 32 32 0C 0C 00 9C 00 04 01 03 47 00 00 00 00 00 00 00 00 00 00 00 00 00 00)
Verbs
This iotop at the time of the crash:
Total DISK READ :       0.00 B/s | Total DISK WRITE :     288.72 M/s
Actual DISK READ:       0.00 B/s | Actual DISK WRITE:     502.57 K/s
  TID  PRIO  USER     DISK READ  DISK WRITE  SWAPIN     IO>    COMMAND
44231 be/4 root        0.00 B/s  288.72 M/s  0.00 %  0.00 % tar xvf -
    1 be/4 root        0.00 B/s    0.00 B/s  0.00 %  0.00 % init
    2 be/4 root        0.00 B/s    0.00 B/s  0.00 %  0.00 % [kthreadd]
    3 be/4 root        0.00 B/s    0.00 B/s  0.00 %  0.00 % [ksoftirqd/0]
    5 be/0 root        0.00 B/s    0.00 B/s  0.00 %  0.00 % [kworker/0:0H]
    6 be/4 root        0.00 B/s    0.00 B/s  0.00 %  0.00 % [kworker/u128:0]
    8 be/4 root        0.00 B/s    0.00 B/s  0.00 %  0.00 % [rcu_sched]
    9 be/4 root        0.00 B/s    0.00 B/s  0.00 %  0.00 % [rcu_bh]
   10 rt/4 root        0.00 B/s    0.00 B/s  0.00 %  0.00 % [migration/0]
   11 rt/4 root        0.00 B/s    0.00 B/s  0.00 %  0.00 % [watchdog/0]
   12 rt/4 root        0.00 B/s    0.00 B/s  0.00 %  0.00 % [watchdog/1]
   13 rt/4 root        0.00 B/s    0.00 B/s  0.00 %  0.00 % [migration/1]
   14 be/4 root        0.00 B/s    0.00 B/s  0.00 %  0.00 % [ksoftirqd/1]
   16 be/0 root        0.00 B/s    0.00 B/s  0.00 %  0.00 % [kworker/1:0H]
   17 rt/4 root        0.00 B/s    0.00 B/s  0.00 %  0.00 % [watchdog/2]
   18 rt/4 root        0.00 B/s    0.00 B/s  0.00 %  0.00 % [migration/2]
   19 be/4 root        0.00 B/s    0.00 B/s  0.00 %  0.00 % [ksoftirqd/2]
   22 rt/4 root        0.00 B/s    0.00 B/s  0.00 %  0.00 % [watchdog/3]
   23 rt/4 root        0.00 B/s    0.00 B/s  0.00 %  0.00 % [migration/3]
   24 be/4 root        0.00 B/s    0.00 B/s  0.00 %  0.00 % [ksoftirqd/3]
   26 be/0 root        0.00 B/s    0.00 B/s  0.00 %  0.00 % [kworker/3:0H]
I have cleared logs so we can start fresh.
@Papaul let's proceed as we agreed yesterday to replace the DIMMs. I will leave both hosts off so you can proceed when you get in.
I am now testing to generate lots of disks reads and writes locally, without involving an ethernet connection.
This is how iotop looks like now:
Total DISK READ :    1082.09 M/s | Total DISK WRITE :       4.04 G/s
Actual DISK READ:    1082.09 M/s | Actual DISK WRITE:     799.99 M/s
We will see if this crashes the server.
The first attempt to crash the server locally has not been successful.
I have started again the test with more threads.
Current state
top - 08:45:24 up 51 min, 10 users,  load average: 8.00, 6.75, 6.06
Tasks: 403 total,   2 running, 401 sleeping,   0 stopped,   0 zombie
%Cpu(s):  0.0 us,  2.7 sy,  0.0 ni, 82.3 id, 15.0 wa,  0.0 hi,  0.0 si,  0.0 st
KiB Mem:  16502931+total, 16457092+used,   458396 free,     3504 buffers
KiB Swap:  7812092 total,        0 used,  7812092 free. 16012659+cached Mem
Mentioned in SAL (#wikimedia-operations) [2016-11-30T09:42:52Z] <marostegui> Stop mysql on db2048 for maintenance - https://phabricator.wikimedia.org/T149553
Interesting, the second attemp with even more threads didn't kill the server. However, starting a transfer killed the server again.
I was generating waaaaay more load and write throughput with the local writes than the transfer itself.
Can this be related to the ethernet card? Although I assume it was changed as it is integrated with the main board?
The status of the server when it died:
top - 10:37:18 up  2:43,  1 user,  load average: 1.87, 1.96, 1.99
Tasks: 385 total,   4 running, 381 sleeping,   0 stopped,   0 zombie
%Cpu(s):  2.3 us,  1.2 sy,  0.0 ni, 96.0 id,  0.4 wa,  0.0 hi,  0.0 si,  0.0 st
KiB Mem:  16502931+total, 16456939+used,   459928 free,     4036 buffers
KiB Swap:  7812092 total,        0 used,  7812092 free. 15822556+cached Mem
Mentioned in SAL (#wikimedia-operations) [2016-11-30T14:44:48Z] <marostegui> Stop MySQL and shutdown db2048 for maintenance - T149553
@Papaul db2034 and db2048 are now off. Please proceed and change the memory DIMMs and turn them on so I can try to crash them later today or tomorrow morning.
Thanks!
I have started MySQL and replication on db2048 so it can catch up from yesterday. @Papaul ping me before doing the DIMM changes so I can turn it off.
Mentioned in SAL (#wikimedia-operations) [2016-12-01T15:38:34Z] <marostegui> Stopping mysql and shutting down db2048 for maintenance - T149553
And the server crashed
severity=Critical
date=12/01/2016
time=16:53
description=System Power Fault Detected (XR: 14 00 MID: FF 4D FC CE C0 FF FF 32 32 0C 0C 00 9C 00 04 01 0F 47 00 00 00 00 00 00 00 00 00 00 00 00 00 00)
@Papaul ping me once you are around so we can discuss further tests.
On Friday Papaul and myself discussed about next steps for this host:
We are going to recable the disk controller today (Monday) and Papaul is going to try to see if he can get HP's software to run a full HW check on the host, so we can get some details about each component.
Mentioned in SAL (#wikimedia-operations) [2016-12-05T16:08:46Z] <marostegui> Stop mysql db2048 for maintenance - T149553
We are testing the transfer again.
What has been done
Papaul has identified that db2034 has 1 disk which is a SAS 2.5 while the 11 others are 3.5" SAS
So for the next step we have thought about replacing that 2.5" one with a 3.5 so db2034 would be exactly the same as db2070 or db2048.
We would need to mark that one as failed manually and replace it in the array.
And...it died
/system1/log1/record3
  Targets
  Properties
    number=3
    severity=Critical
    date=12/05/2016
    time=17:16
    description=System Power Fault Detected (XR: 14 00 MID: FF 4D FC CE C0 FF FF 32 32 0C 0C 00 9C 00 04 01 03 47 00 00 00 00 00 00 00 00 00 00 00 00 00 00)
VerbsPapaul has replaced the 2.5" disk with a 3.5" one. The RAID is now rebuilding - once it is done I will try to crash it again.
The RAID finished rebuilding and it is marked as OK but the new disk is marked as a predictive failure:
physicaldrive 1I:1:2 (port 1I:box 1:bay 2, SAS, 600 GB, Predictive Failure)
However, I will start the test and try to crash it.
Mentioned in SAL (#wikimedia-operations) [2016-12-07T08:37:18Z] <marostegui> Stop MySQL db2048 for maintenance - T149553
The first has been successful and the server HAS NOT crashed.
I have started the transfer again to make sure it wasn't just luck.
We need to replace that disk though
The second transfer finished correctly but seconds after the last file was transferred, the server crashed:
date=12/07/2016
time=11:59
description=System Power Fault Detected (XR: 14 00 MID: FF 4D FC CE C0 FF FF 32 32 0C 0C 00 9C 00 04 01 03 47 00 00 00 00 00 00 00 00 00 00 00 00 00 00)
@Papaul can we get that new disk removed and leave the slot empty? Maybe it is the controller slot which is broken?
I can redo the tests without that disk, even though the array will be degraded, it should be fine.
As the transfer was done correctly, I have started MySQL replication + an alter table to see if it dies with normal load too.
The disk has been pulled out. We are going to let the big ALTER finish and then we will start the transfer again.
physicaldrive 1I:1:2 (port 1I:box 1:bay 2, SAS, 600 GB, Failed)
Note: the raid controller on this host has not been changed.
Looks like the server is still alive since we pulled out the disk. I have started another big alter.
Tomorrow morning, if it is still up I will start the normal transfer and we'll what happens.
Mentioned in SAL (#wikimedia-operations) [2016-12-09T07:42:34Z] <marostegui> Stop MySQL db2034 and db2048 for maintenance - T149553
The server survived to the last alter.
I have started the netcat transfer that always makes the server die.
And it died after 50 minutes into the transfer.
@Papaul can we get the RAID controller replaced by HP? it is one of the key components we have not replaced yet.
Mentioned in SAL (#wikimedia-operations) [2016-12-12T18:02:23Z] <marostegui> Shutting down db2034 for maintenance - T149553
We have inserted a new disk on slot 2 to check:
If it crashes again, we will try to replace the RAID controller.
At the moment the RAID is being rebuilt
logicaldrive 1 (3.3 TB, RAID 1+0, Recovering, 2% complete)

physicaldrive 1I:1:1 (port 1I:box 1:bay 1, SAS, 600 GB, OK)
physicaldrive 1I:1:2 (port 1I:box 1:bay 2, SAS, 600 GB, Rebuilding)
The RAID finished and the disk is showing again predictive failure:
logicaldrive 1 (3.3 TB, RAID 1+0, OK)

physicaldrive 1I:1:1 (port 1I:box 1:bay 1, SAS, 600 GB, OK)
physicaldrive 1I:1:2 (port 1I:box 1:bay 2, SAS, 600 GB, Predictive Failure)
The controller slot might be broken and maybe also causing the crashes when the server is under high IO.
I will do the crash test again tomorrow but I am sure it will not pass it, so replacing the controller could be our best shot here, @Papaul.
Mentioned in SAL (#wikimedia-operations) [2016-12-13T07:47:49Z] <marostegui> Stop MySQL db2048 for maintenance - T149553
I have also cleared the logs, by the way, the controller showed this error for the two different disks we inserted in slot 2
description=POST Error: 1720-Slot X Drive Array - S.M.A.R.T. Hard Drive(s) Detect imminent failure
And as expected, it died:
  time=09:26
  description=System Power Fault Detected (XR: 14 00 MID: FF 4D FC CE C0 FF FF 32 32 0C 0C 00 9C 00 04 01 03 47 00 00 00 00 00 00 00 00 00 00 00 00 00 00)
Verbs
@Papaul can we go ahead and try to get a replacement for the raid controller?
Thanks!
Mentioned in SAL (#wikimedia-operations) [2016-12-13T16:10:32Z] <marostegui> Shut down db2034 and db2048 for maintenance - T149553
Power settings are the same on both servers.
We will contact the vendor to see if we can get a new raid controller or a technician onsite (again)
db2034 is back up rebuilding the RAID with the disk (which will be marked as predictive failure by the controller for sure)
I chat with HP once again, the RAID controller is integrated to the main board so they will have to send another tech onsite to:
1- Replace again the main board
2- Update the system firmware
According to them the note of the previous tech shows that he didn't replaced the main board or I was onsite with the tech and he did replaced the main board I don't know why they are saying that he didn't.
But we will see this time
Dear Mr Papaul Tshibamba,
Thank you for contacting Hewlett Packard Enterprise for your service request. This email confirms your request for service and the details are below.
Your request is being worked on under reference number 5315705831
Status: Case is generated and in Progress
Product description: HP ProLiant DL380p Gen8 12 LFF Configure-to-order Server
Product number: 665552-B21
Serial number: USE4282HJC
Subject: DL380p Gen8 - Power Fault Detected
Yours sincerely,
Hewlett Packard Enterprise
Thanks for all the updates Papaul!
This time the RAID got rebuilt just fine, with no predictive failure, so I am going to try to make the server crash again.
Mentioned in SAL (#wikimedia-operations) [2016-12-14T06:35:15Z] <marostegui> Stop MySQL db2048 for maintenance - T149553
Server crashed and power is off.
iLO Advanced 2.40 at  Dec 02 2015
Server Name: WIN-12
Server Power: Off
As always, there is no log as I didn't delete the ones from yesterday's crash.
HP tech just left site and replaced the main-board once again also installed HP service Pack on the server. We can crash it again.
Thanks.
Thanks for the heads up @Papaul, I will do it tomorrow morning and report the results
Mentioned in SAL (#wikimedia-operations) [2016-12-16T08:20:57Z] <marostegui> Stop mysql db2048 for maintenance - https://phabricator.wikimedia.org/T149553
Changing the motherboard made no difference, the server died after 50 minutes into the transfer:
Server Power: Off
Same error log as always (even though the date looks wrong, that crash is the one I just generated as stated below)
</system1/log1>hpiLO-> show record1

status=0
status_tag=COMMAND COMPLETED
Wed Jul  1 15:40:39 2015


/system1/log1/record1
  Targets
  Properties
    number=1
    severity=Critical
    date=07/01/2015
    time=15:21
    description=System Power Fault Detected (XR: 14 00 MID: FF 4D FC CE C0 FF FF 32 32 0C 0C 00 9C 00 04 01 03 47 00 00 00 00 00 00 00 00 00 00 00 00 00 00)
The date is wrong, but that crash is the one I just generated as I cleared the logs now and I can see the date being wrong:
</system1/log1>hpiLO-> show record1

status=0
status_tag=COMMAND COMPLETED
Wed Jul  1 15:41:08 2015


/system1/log1/record1
  Targets
  Properties
    number=1
    severity=Informational
    date=07/01/2015
    time=15:41
description=IML Cleared (iLO 4 user:root)As a new test I am throttling the netcat transfer to a max of 100mb from the source to db2034 to see if that gives less load to the disks/eth on db2034 and makes any difference.
This is making db2034 to write a lot less than when the connection isn't throttled
Device:            tps    MB_read/s    MB_wrtn/s    MB_read    MB_wrtn
sda            1095.00         0.00      1095.01          0       1095
dm-0           1229.00         0.00      1226.01          0       1226

avg-cpu:  %user   %nice %system %iowait  %steal   %idle
           1.00    0.00    0.88    2.01    0.00   96.12

Device:            tps    MB_read/s    MB_wrtn/s    MB_read    MB_wrtn
sda            1093.00         0.00      1093.01          0       1093
dm-0           1114.00         0.00      1111.01          0       1111

avg-cpu:  %user   %nice %system %iowait  %steal   %idle
           1.08    0.00    0.68    1.55    0.00   96.70

Device:            tps    MB_read/s    MB_wrtn/s    MB_read    MB_wrtn
sda             900.00         0.00       900.02          0        900
dm-0            754.00         0.00       751.01          0        751
And withouth the throttling:
Device:            tps    MB_read/s    MB_wrtn/s    MB_read    MB_wrtn
sda            1614.00         0.00      1613.02          0       1613
dm-0           1749.00         0.00      1745.02          0       1745

avg-cpu:  %user   %nice %system %iowait  %steal   %idle
           3.60    0.00    2.01    1.74    0.00   92.65

Device:            tps    MB_read/s    MB_wrtn/s    MB_read    MB_wrtn
sda            1135.00         0.00      1135.01          0       1135
dm-0           1136.00         0.00      1133.01          0       1133

avg-cpu:  %user   %nice %system %iowait  %steal   %idle
           3.47    0.00    2.11    1.56    0.00   92.86

Device:            tps    MB_read/s    MB_wrtn/s    MB_read    MB_wrtn
sda            1142.00         0.00      1136.53          0       1136
dm-0 1174.00 0.00 1166.53 0 1166I have set up a quick netconsole server logging over netcat on db2048:9999 to see if there is something sent which is not logged to disk (logs) when db2034 dies.
Server died again 15 minutes into the transfer with the throttle to 100MB
Server Power: Off

/system1/log1/record2
  Targets
  Properties
    number=2
    severity=Critical
    date=12/16/2016
    time=09:53
    description=System Power Fault Detected (XR: 14 00 MID: FF 4D FC CE C0 FF FF 32 32 0C 0C 00 9C 00 04 01 03 47 00 00 00 00 00 00 00 00 00 00 00 00 00 00)
Nothing on the netconsole logging.
Transfer limited to 10mb/s now on both, db2034 and db2048 and started again
enabled netconsole again
monitoring: ethtool -S eth0 | grep errors on db2034 to see if there is anything being showed
I tried that (not sure if that's exactly what you meant):
We also need to keep in mind that the ethernet has been changed (as it is integrated on the main board)
I tried that
And it crashed or not crashed?
What if we do the same (large dd), without touching disks, on a ramdisk?
Nope
What if we do the same (large dd), without touching disks, on a ramdisk?
That is a good test. I will do that to a ramdisk instead of the disk (memory DIMMs were changed too a long time ago, just for the record)
Update: 4 hours into the transfer (145G copied) and the server is still up.
Looks again either disk or ethernet related.
Recap of what the server survived for:
What the server hasn't survived to:
I will leave the transfer there for a few more hours and for the weekend I will leave 10 dd processes writing to a file in ramdisk, without touching the disks.
The server has not crashed after 5 hours into the netcat transfer and I believe it won't crash.
So that leave us with the fact that with rate limiting the connection (to 10mbs, as 100mb did make the server crash) the server won't crash.
I have noticed that running 20 dd instances writing to disk isn't a great test as the bottleneck is the CPU and the fact that they all need to fight to read from /dev/urandom, so overall we are stressing the disks less as per iostat results. So I have changed a bit the dd syntax and way of running to make it more similar to what we do when we transfer from db2048 to db2034
the netcat transfer is after all a sequential copy of big files one by one, sync'ing to disk, then another file etc so I am running the following
dd bs=1M count=30000 if=/dev/zero of=test oflag=dsync
That will generate a file of 30G and using dsync which means (from the man): use synchronized I/O for data so basically it will sync the data and wait for the disk to say it is OK, and will do that every 1MB written. That will put lots of stress on the disk (hopefully).
The loop runs for 30 iterations
It is copying at around 550MB/s
Device:            tps    MB_read/s    MB_wrtn/s    MB_read    MB_wrtn
sda             933.00         0.00       581.27          0        581
dm-0            932.00         0.00       581.25          0        581
I have run the loop twice, writing 1.1T each time and the server didn't crash.
The average writing time was 515MB/s
Going to run the loop again.
Maybe we need to try the approach of changing the cable and use eth1 instead to discard the eth itself.
@Papaul we have not replaced the CPUs, right? I am thinking that this might be related to CPU and the IRQs.
Right now I am seeing that the NIC interrupts are just being handled by 1 single CPU. On Monday I will do some testing balancing those across all of them and.
Anyways, we should consider trying to swap the CPUs with another server and try.
A loop writing around 1T to a ramdisk didn't make the server crash, just multiple OOM but that is expected.
I am going to play with the smp affinity a bit and re do the transfer.
Mentioned in SAL (#wikimedia-operations) [2016-12-19T09:23:47Z] <marostegui> Stop mysql db2048 (depooled) for maintenance - T149553
I have written a small quick guide to set up netconsole as I needed it for trying to capture messages for this host: https://wikitech.wikimedia.org/wiki/Netconsole
After playing the affinity I could see the interruptions being distributed among the cores:
Before:

root@db2034:~# cat /proc/irq/{91,92,93,94,95}/smp_affinity
00000000,3ff003ff
00000000,3ff003ff
00000000,3ff003ff
00000000,3ff003ff
00000000,3ff003ff

After:

root@db2034:/srv/sqldata# cat /proc/irq/{91,92,93,94,95}/smp_affinity
00000000,00000010
00000000,00000020
00000000,00000040
00000000,00000080
00000000,00000100
The server died anyways after 1.1T copied.
So we have seen so far:
Whenever we involve the ethernet+cpu the server dies.
Let's try to:
Interesting, we have a new error logged:
description=Uncorrectable Machine Check Exception (Board 0, Processor 1, APIC ID 0x00000000, Bank 0x00000004, Status 0xB2000000'71000402, Address 0x00000000'00000000, Misc 0x00000000'00000000)
So looks like CPU issues then?
http://h20564.www2.hpe.com/hpsc/doc/public/display?docId=emr_na-c04046303:
HP ProLiant Gen8 servers configured with Intel Xeon E5-2400 v2 or E5-2600 v2 or E5-4600 v2 series processors and 32GB LRDIMMs may experience a Machine Check Exception when memory is forced to operate at 800Mhz via the ROM-Based Setup Utility (RBSU).

This issue has only been observed when memory is forced to a slower than normal operating frequency via the ROM-Based Setup Utility (RBSU) or the SmartStart Scripting Toolkit. When this issue occurs, the system may experience an unexpected reset and may stop responding at 20 percent during the next boot . A subsequent reboot will result in the following error being logged to the Integrated Lights-Out (iLO) IML Log:

Uncorrectable Machine Check Exception (Board 0, Processor 1, APIC ID 0x00000000, Bank 0x00000004, Status 0xB2000000'77000402, Address 0x00000000'00000000, Misc 0x00000000'00000000)
As per the above message, I think we are not suffering that:
root@db2034:~# dmidecode --type memory  | egrep "Speed|Configured Clock" | grep -v Unkn
	Speed: 1866 MHz
	Configured Clock Speed: 1866 MHz
	Speed: 1866 MHz
	Configured Clock Speed: 1866 MHz
	Speed: 1866 MHz
	Configured Clock Speed: 1866 MHz
	Speed: 1866 MHz
	Configured Clock Speed: 1866 MHz
	Speed: 1866 MHz
	Configured Clock Speed: 1866 MHz
	Speed: 1866 MHz
	Configured Clock Speed: 1866 MHz
	Speed: 1866 MHz
	Configured Clock Speed: 1866 MHz
	Speed: 1866 MHz
	Configured Clock Speed: 1866 MHz
	Speed: 1866 MHz
	Configured Clock Speed: 1866 MHz
	Speed: 1866 MHz
	Configured Clock Speed: 1866 MHz
I have been trying to check via ILO as well, just to confirm that dmidecode is correct but it is impossible with the latency to get in the BIOS via vsp. Maybe once @Papaul is back we can double check we are not lowering the speed. Just to be sure.
Mentioned in SAL (#wikimedia-operations) [2017-01-03T07:30:53Z] <marostegui> Stop mysql db2048 and db2034 for maintenance - https://phabricator.wikimedia.org/T149553
First transfer finished correctly! Going for the second one to confirm it wasn't just coincidence (as it has happened in the past)
Second attempt was also good and the server is alive!
Will try a third one and after that if it goes good too, I will start a massive alter that will take some days to see if it keeps up (reminder: the original crash happened with an alter table, so it will be a good use-case)
The server is now replicating and I am running the following alter:
ALTER TABLE enwiki.revision row_format = compressed, DROP PRIMARY KEY, DROP INDEX rev_id, ADD PRIMARY KEY (rev_id, rev_user) PARTITION BY RANGE (rev_user) ( PARTITION p1 VALUES LESS THAN (1), PARTITION p50000 VALUES LESS THAN (50000), PARTITION p100000 VALUES LESS THAN (100000), PARTITION p200000 VALUES LESS THAN (200000), PARTITION p300000 VALUES LESS THAN (300000), PARTITION p400000 VALUES LESS THAN (400000), PARTITION p500000 VALUES LESS THAN (500000), PARTITION p750000 VALUES LESS THAN (750000), PARTITION p1000000 VALUES LESS THAN (1000000), PARTITION p1250000 VALUES LESS THAN (1250000), PARTITION p1500000 VALUES LESS THAN (1500000), PARTITION p1750000 VALUES LESS THAN (1750000), PARTITION p2000000 VALUES LESS THAN (2000000), PARTITION p2500000 VALUES LESS THAN (2500000), PARTITION p3000000 VALUES LESS THAN (3000000), PARTITION p3500000 VALUES LESS THAN (3500000), PARTITION p4000000 VALUES LESS THAN (4000000), PARTITION p4500000 VALUES LESS THAN (4500000), PARTITION p5000000 VALUES LESS THAN (5000000), PARTITION p6000000 VALUES LESS THAN (6000000), PARTITION p7000000 VALUES LESS THAN (7000000), PARTITION p7500000 VALUES LESS THAN (7500000), PARTITION p8000000 VALUES LESS THAN (8000000), PARTITION p9000000 VALUES LESS THAN (9000000), PARTITION p10000000 VALUES LESS THAN (10000000), PARTITION p11000000 VALUES LESS THAN (11000000), PARTITION p12000000 VALUES LESS THAN (12000000), PARTITION p13000000 VALUES LESS THAN (13000000), PARTITION p14000000 VALUES LESS THAN (14000000), PARTITION p16000000 VALUES LESS THAN (16000000), PARTITION p18000000 VALUES LESS THAN (18000000), PARTITION p22000000 VALUES LESS THAN (22000000), PARTITION p24000000 VALUES LESS THAN (24000000), PARTITION p28000000 VALUES LESS THAN (28000000), PARTITION pMAXVALUE VALUES LESS THAN MAXVALUE );
The server is still responding fine, which is great news.
This is the state of the alter
Stage: 1 of 2 'copy to tmp table' 74.1% of stage done
The ALTER has finished and there were no issues!!!
Query OK, 700487466 rows affected, 70 warnings (2 days 18 hours 57 min 56.14 sec)
Records: 700487466  Duplicates: 0  Warnings: 70
The warnings are because of Antelope and not Barracuda (which is irrelevant for this ticket)
|  Warning | 1478 | InnoDB: ROW_FORMAT=COMPRESSED requires innodb_file_format > Antelope. |
| Warning | 1478 | InnoDB: assuming ROW_FORMAT=COMPACT.
I am going to let this server catch up with the master before closing this ticket and mark it as resolved (after two months of investigation!!!) - hopefully it will catch up without any problems!
Change 332218 had a related patch set uploaded (by Marostegui):
db-codfw.php: Repool db2034
Mentioned in SAL (#wikimedia-operations) [2017-01-16T08:56:16Z] <marostegui@tin> Synchronized wmf-config/db-codfw.php: Repool db2034 - T149553 (duration: 00m 38s)
Server repooled after almost some months! Thanks everyone involved in this investigation