Page MenuHomePhabricator

Analyze WDQS traffic data to find parallel connection patterns
Closed, ResolvedPublic6 Estimated Story Points

Description

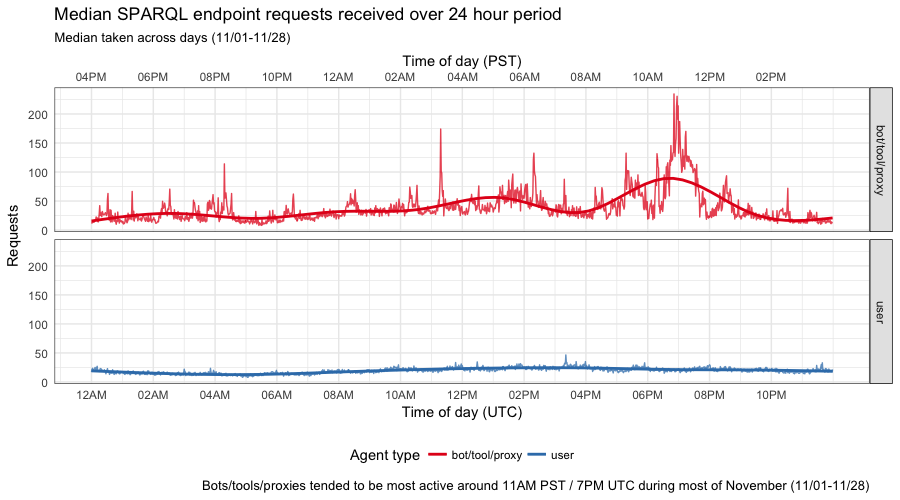
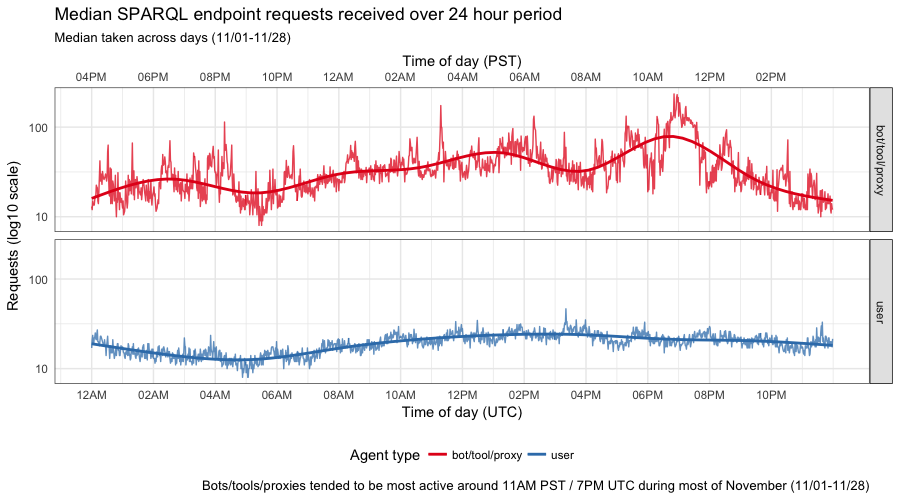
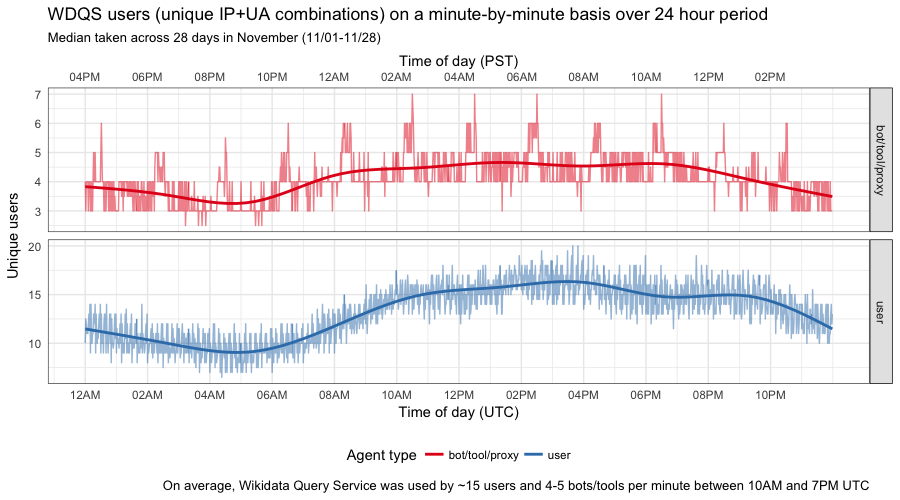
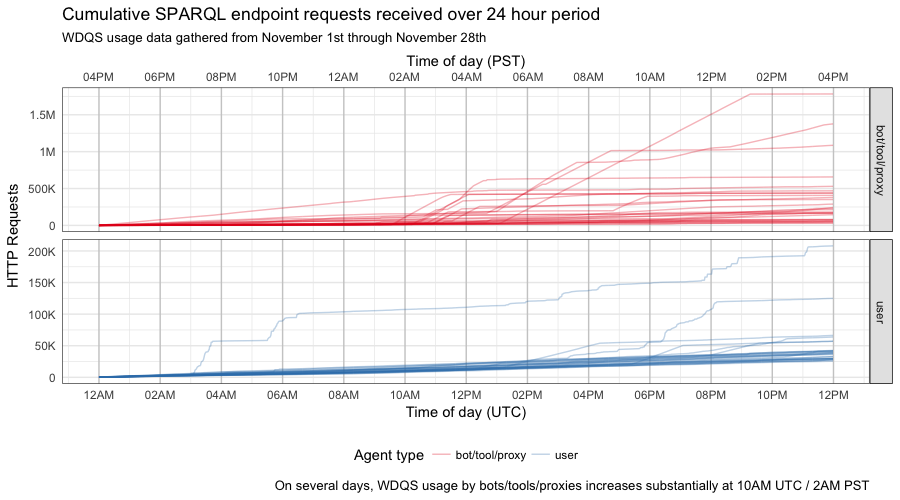
We would like to know whether there are WDQS clients that run a lot of queries on the service in parallel, and if so, how frequent this is, how many clients do this and to what measure. This would allow us to evaluate the impact of rate limiting on users. As many clients can be behind proxies, we would also like to know if it influences the calculation and what would be impact of rate limiting to such users.

We plan to use X-Client-IP header in decisions about rate limiting and would like to know if it makes sense and what would be the impact.

Analyze WDQS traffic in order to answer the following questions:

  1. How many IPs use parallel connections to the WDQS servers?
  2. How many parallel connections are typically used, how frequent is to use more than 3, what is the max, etc.?
  3. Out of the IPs that do the above, how many have the same/different user agents (hinting at one tool or proxy serving multiple clients)?
  4. In general, how many user agents per IP we have - do we have some IPs that have a lot of different agents (indicating a proxy), how much and how traffic from those IPs looks like - e.g. how many parallel requests, how often theres more than one, more than three?

By parallel connections we understand two connections from the same IP in which time intervals from request start to first byte sent to the response (time_firstbyte) intersect. Note that since we have more that one server, the requests may have been sent to separate servers, maybe we can correlate with logstash logs from wdqs servers to know which server it goes to. The ideal situation is if we have per-server data, but if that's not feasible, we can do with aggregated data.

Event Timeline

Restricted Application added a subscriber: Aklapper. · View Herald Transcript
debt triaged this task as Medium priority.Nov 8 2016, 9:23 PM
debt moved this task from Needs triage to Up Next on the Discovery-Analysis board.
debt subscribed.

Hi - how many hours/days/weeks of data would you want us to look at?

I think we have data for a month back, so that would be best, if not - then whatever is practical.

mpopov set the point value for this task to 6.
mpopov moved this task from Up Next to Current work on the Discovery-Analysis board.
mpopov moved this task from Backlog to In progress on the Discovery-Analysis (Current work) board.

@Smalyshev: still in the process of figuring out the parallel connection aspect but here are some minute-by-minute-over-24-hours graphs/stats you might be interested in that I made in the process of playing with the data

sparql_median_2.png (500×900 px, 95 KB)

sparql_median.png (500×900 px, 117 KB)

sparql_users.png (500×900 px, 144 KB)

cumulative_sparql.png (500×900 px, 115 KB)

Nice, thanks! So it suggests on average we don't have very high concurrency but of course average does not define point-in-time concurrency, only suggests about it.

  • How many IPs use parallel connections to the WDQS servers? Out of the IPs that do the above, how many have the same/different user agents (hinting at one tool or proxy serving multiple clients)?
    • Of 14K unique IPs observed between Nov 1st and 28th, 1.9K (13.6%) had made more than 1 request (to SPARQL endpoint) per second.
      • Of those, 1360 (71.1%) only had 1 UA; 553 (28.9%) had 2 or more UAs; with 2 IP addresses observed to have 30-33 UAs.
  • How many parallel connections are typically used, how frequent is to use more than 3, what is the max, etc.?
    • 726 IPs (5.17%) were seen making 3 or more requests per second.
      • Of those, 458 (63.1%) only had 1 UA; 268 (36.9%) had 2 or more UAs.
    • 537 IPs (3.82%) were seen making more than 3 requests per second.
      • Of those, 331 (61.64%) only had 1 UA; the rest had 2 or more UAs.
  • In general, how many user agents per IP we have - do we have some IPs that have a lot of different agents (indicating a proxy), how much and how traffic from those IPs looks like - e.g. how many parallel requests, how often theres more than one, more than three?
    • A particular Digital Ocean IP was especially active, using the axios promise based HTTP client
      • 300+ requests made per second 7 different times
      • 200-300 requests made per second 306 different times
      • 100-300 requests made per second 735 different times
    • 100-200 requests made per second by 2 Universidad Politecnica de Madrid IPs 2,200 different times

@Smalyshev: Let me know if you have any additional questions and/or if I missed anything. Hope this helps!

@mpopov Thank you! This looks very useful. I think it's enough data for now, if I need anything else I'll ask.