Page MenuHomePhabricator

Webrequest dataloss registered during the last kafka restarts
Closed, ResolvedPublic

Description

Data loss registered by Oozie for 2016-12-7-18:

elukey@stat1002:/mnt/hdfs$ cat wmf/data/raw/webrequests_data_loss/upload/2016/12/7/18/WARNING/000000_0
0 requests (0.0% of total) have incomplete records. 4009853 requests (2.043% of valid ones) were lost.

elukey@stat1002:/mnt/hdfs$ cat wmf/data/raw/webrequests_data_loss/text/2016/12/7/18/WARNING/000000_0
249 requests (0.0% of total) have incomplete records. 6490442 requests (2.726% of valid ones) were lost.

elukey@stat1002:/mnt/hdfs$ cat wmf/data/raw/webrequests_data_loss/misc/2016/12/7/18/WARNING/000000_0
0 requests (0.0% of total) have incomplete records. 3377 requests (1.277% of valid ones) were lost.

elukey@stat1002:/mnt/hdfs$ cat wmf/data/raw/webrequests_data_loss/maps/2016/12/7/18/WARNING/000000_0
0 requests (0.0% of total) have incomplete records. 30210 requests (2.321% of valid ones) were lost.

No kafka errors registered in https://grafana.wikimedia.org/dashboard/db/varnishkafka?var-instance=webrequest, plus we have the following two settings for librdkafka that should help:

# The topic partition leader needs to ack the msg batch
kafka.topic.request.required.acks = 1

# Maximum number of retries per messageset.
kafka.message.send.max.retries = 3

I checked cp3033 varnishkafka-webrequest logs and I can see errors like the following for the time of the alarms:

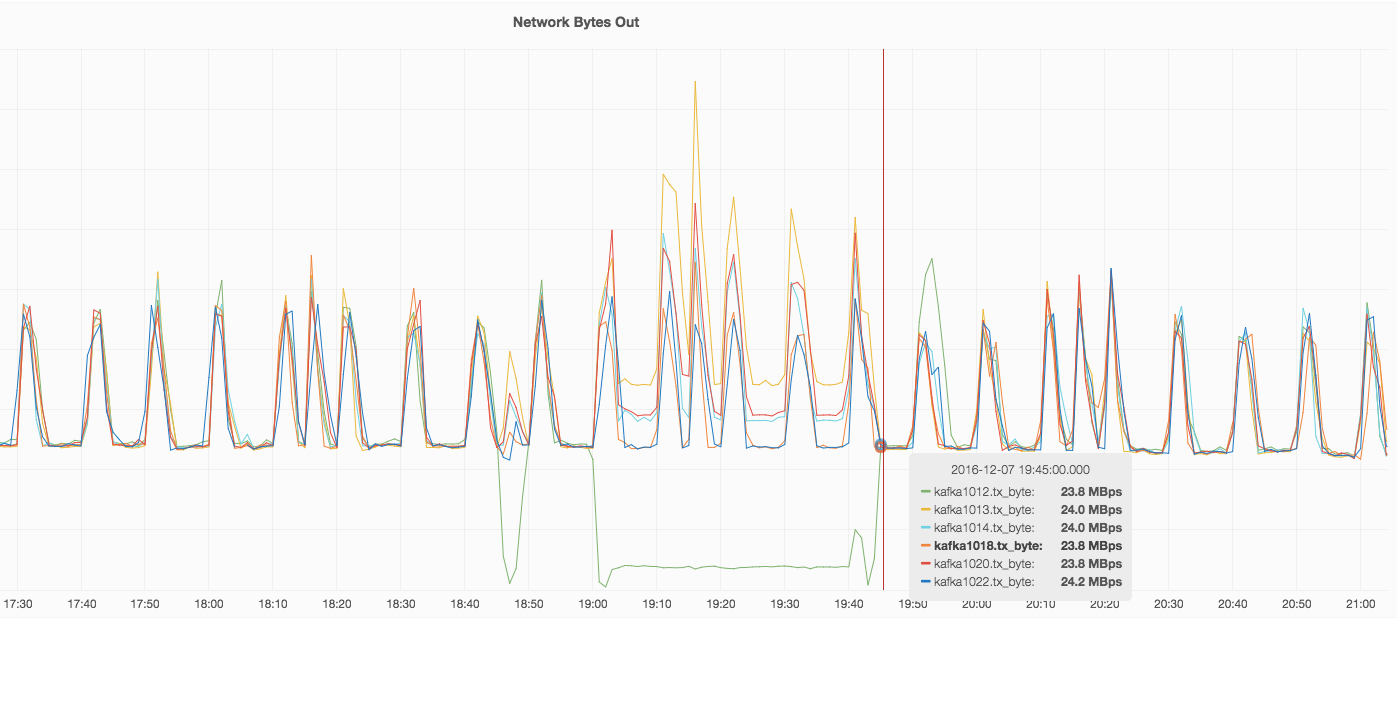
Dec 07 18:47:12 cp3033 varnishkafka[1899]: KAFKAERR: Kafka error (-195): kafka1012.eqiad.wmnet:9092/12: Connect to ipv4#10.64.5.12:9092 failed: Connection refused
Dec 07 19:00:25 cp3033 varnishkafka[1899]: %3|1481137225.865|FAIL|varnishkafka#producer-1| kafka1012.eqiad.wmnet:9092/12: Receive failed: Disconnected

I can see the following reports for librdkafka (quick glance):

https://github.com/edenhill/librdkafka/issues/736
https://github.com/edenhill/librdkafka/issues/437

So this could be due to:

  1. New alarms behaving in a unexpected way during Kafka restarts reporting false positives.
  2. New alarms more precise than the previous ones and reporting an issue that has been ongoing for a while.

About 2), we might have to check github issues for librdkafka, meanwhile for 1) we could check the distribution of the data loss (for example, are all the sequence numbers dropped contiguous or not?).

Event Timeline

elukey triaged this task as High priority.Dec 8 2016, 9:38 AM

I ran select_missing_sequence_runs for webrequest_text Dec 7 18:00. Results here: https://gist.github.com/ottomata/2bccd01cfe3e06376e4a79bc4672ddce

I'm not sure what is up with the records with missing_count 1, since the missing_start and missing_end are the same. Must be something with the query, dunno.

But, notably, the only hosts that show large holes are those from non eqiad datacenters. E.g.

hostname	missing_start	missing_end	missing_count	dt_before_missing	dt_after_missing

cp3030.esams.wmnet	2639188984	2639206006	17023	-	-
cp3030.esams.wmnet	2639206015	2639206015	1	-	-
cp3030.esams.wmnet	2639206017	2639435848	229832	-	-
cp3030.esams.wmnet	2639435850	2641357261	1921412	-	2016-12-07T18:00:00

Strange that those holes either have - as the dt missing before and after, or exactly 2016-12-07T18:00:00.

Mentioned in SAL (#wikimedia-analytics) [2016-12-08T18:15:22Z] <ottomata> restarting broker on kafka1012 to repro T152674

Mentioned in SAL (#wikimedia-operations) [2016-12-08T18:15:38Z] <ottomata> restarting broker on kafka1012 to repro T152674

BTW, the query was just a little wrong about missing_start and missing_end. The 1s in that list are actually missing. Fixed the query here: https://gerrit.wikimedia.org/r/#/c/325961/

I just restarted kafka1012 again and watched, and waited for load jobs to finish.

Everything looks fine this time.

@Ottomata: Looks like we've not been able to repro just by restarting ...
Maybe some weird race-condition of some sort ?

List the restarts and their timings (UTC):

Dec  7 18:45:38 kafka1012 sudo:     otto : TTY=pts/1 ; PWD=/home/otto ; USER=root ; COMMAND=/usr/sbin/service kafka restart
Dec  7 19:00:20 kafka1012 sudo:     otto : TTY=pts/2 ; PWD=/home/otto ; USER=root ; COMMAND=/usr/sbin/service kafka restart
Dec  7 19:41:52 kafka1012 sudo:     otto : TTY=pts/2 ; PWD=/home/otto ; USER=root ; COMMAND=/usr/sbin/service kafka restart

As far as I can tell kafka1012 was the only broker restarted two times (kafka preferred replica election probably executed right after the first and third restart):

Screen Shot 2016-12-12 at 2.11.45 PM.png (706×1 px, 229 KB)

Ok, from Luca and Marcel's research today, here's the current hypothesis:

Kafka restart caused varnishkafka messages to be delayed. Since one of the restarts was very close to the hour, it is possible that some messages for the beginning of hour 19 were successfully produced to Kafka before the end of hour 18. If Camus were to have run and finished consuming messages from the beginning of hour 19 before messages of hour 18, the Camus checker would notice that the latest timestamps consumed by Camus are in hour 19. The Camus checker would assume that hour 18 had been fully imported, and it would write the _IMPORTED flag to HDFS, causing Oozie webrequest load and sequence stats jobs to be launched. But, at this point, there would be messages in Kafka for hour 18 that have not yet been imported to HDFS. The sequence stats jobs would report missing data. During the subsequent Camus run, these messages will be imported to the hour 18 partition correctly.

After examining the data, Luca and Marcel conclude that there is no actual data loss. I tried to consume messages from Kafka for the 18/19 hour border to see if I could spot messages from hour 19 that have Kafka offsets before messages at the end of hour 18, but the messages all seem to be very out of order in Kafka. So much so that it is difficult to consume and sort enough messages to find this. So, I can't (easily) use Kafka to verify this hypothesis, but the fact that the messages are out of order supports our hypothesis.

It'd be really nice if the webrequest data in HDFS was augmented to include the Kafka topic, partition and offset the message was assigned. This would make it easier to use Hive to sort by partition,offset, sequence, and dt, and see if message are out of order.

Adding to what @Ottomata said:

If today you execute the query[1] that populates the wmf_raw.webrequest_sequence_stats table, its results are not the same as the ones executed on 2016-12-07T18 (that are stored in the mentioned table). The underlying data in the webrequest table was different in both executions, what brings us to believe in the case explained by @Ottomata. Here's an example:

webrequest_sequence_stats table ('misc', 2016-12-7T18):

hostname           seq_min  seq_max  count_actual count_expected count_different count_duplicate count_null_sequence percent_different
cp1045.eqiad.wmnet 14579201 14597382 17956        18182          226             0               0                   -1.2429875701242987

results of the same query executed today ('misc', 2016-12-7T18):

hostname           seq_min  seq_max  count_actual count_expected count_different count_duplicate count_null_sequence percent_different
cp1045.eqiad.wmnet 14579201 14597382 18182        18182          0               0               0                   0.0

You can see today's results do not have any sequence holes, and this happens with all other hosts. So the full data must have been imported at some point, which supports the theory of the missing data being imported in the next hour's job by camus.