A spike happened in Gearman. The alarm kicked in at 17:39 and the recovery notification went at 17:48.
Service Ok[2017-06-16 17:48:04] SERVICE ALERT: contint1001;Work requests waiting in Zuul Gearman server https://grafana.wikimedia.org/dashboard/db/zuul-gearman;OK;HARD;3;OK: Less than 30.00% above the threshold [90.0]
Service Critical[2017-06-16 17:39:04] SERVICE ALERT: contint1001;Work requests waiting in Zuul Gearman server https://grafana.wikimedia.org/dashboard/db/zuul-gearman;CRITICAL;HARD;3;CRITICAL: 42.86% of data above the critical threshold [140.0]
Service Critical[2017-06-16 17:38:04] SERVICE ALERT: contint1001;Work requests waiting in Zuul Gearman server https://grafana.wikimedia.org/dashboard/db/zuul-gearman;CRITICAL;SOFT;2;CRITICAL: 33.33% of data above the critical threshold [140.0]
Service Critical[2017-06-16 17:37:04] SERVICE ALERT: contint1001;Work requests waiting in Zuul Gearman server https://grafana.wikimedia.org/dashboard/db/zuul-gearman;CRITICAL;SOFT;1;CRITICAL: 33.33% of data above the critical threshold [140.0]
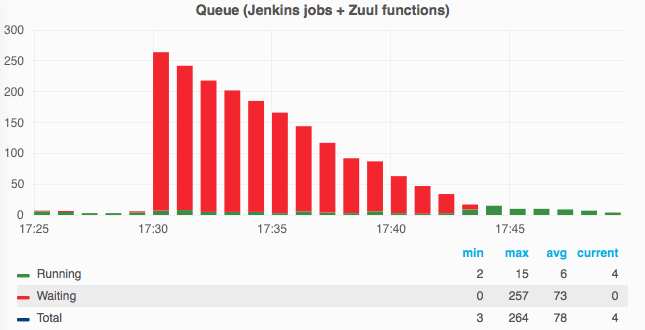
That started at 17:30 and recovered fully at 17:43. Need some tweaking, probably in the window of check graphite