Page MenuHomePhabricator

Firefox 57 improvement
Closed, ResolvedPublic

Assigned To
Authored By
Peter
Nov 16 2017, 1:32 PM
Referenced Files
F11027809: Screen Shot 2017-11-27 at 1.59.33 PM.png
Nov 27 2017, 1:03 PM
F10826281: Screen Shot 2017-11-16 at 3.05.56 PM.png
Nov 16 2017, 2:12 PM
F10826315: Screen Shot 2017-11-16 at 3.10.28 PM.png
Nov 16 2017, 2:12 PM
F10825659: Screen Shot 2017-11-16 at 2.22.34 PM.png
Nov 16 2017, 1:32 PM
F10825650: Screen Shot 2017-11-16 at 2.19.36 PM.png
Nov 16 2017, 1:32 PM
F10825691: fulldiff.png
Nov 16 2017, 1:32 PM
F10825682: Screen Shot 2017-11-16 at 2.29.52 PM.png
Nov 16 2017, 1:32 PM
F10825655: Screen Shot 2017-11-16 at 2.21.01 PM.png
Nov 16 2017, 1:32 PM

Description

Lets track the changes we see here for FF57 in this tasks so it's easier for Mozillians (and others) to follow what we do.

Possible problems in Navigation Timings?

I've seen that if we don't clear the cache between runs, backend times like connectEnd, connectStart, responseEnd , requestStart and responseStart is wrong. When I automate and clear the cache between runs the metrics is correct. If I use an old Firefox it works. It could either be something with Selenium/Gecko/Firefox 57 or it could be something that also affect real users. The thing is that video and VisualMetrics looks ok between runs (but navigation timings is wrong) so maybe this can affect our RUM metrics (or do we just disregard them). You can see the faulty metrics here: https://results.sitespeed.io/en.wikipedia.org/2017-11-14-22-34-52/pages/en.wikipedia.org/wiki/Barack_Obama/3.html#browsertime

Reported at https://bugzilla.mozilla.org/show_bug.cgi?id=1417308

Comparing FF 54, 57 and latest Chrome

https://dashboard.sitespeed.io/dashboard/db/browsers
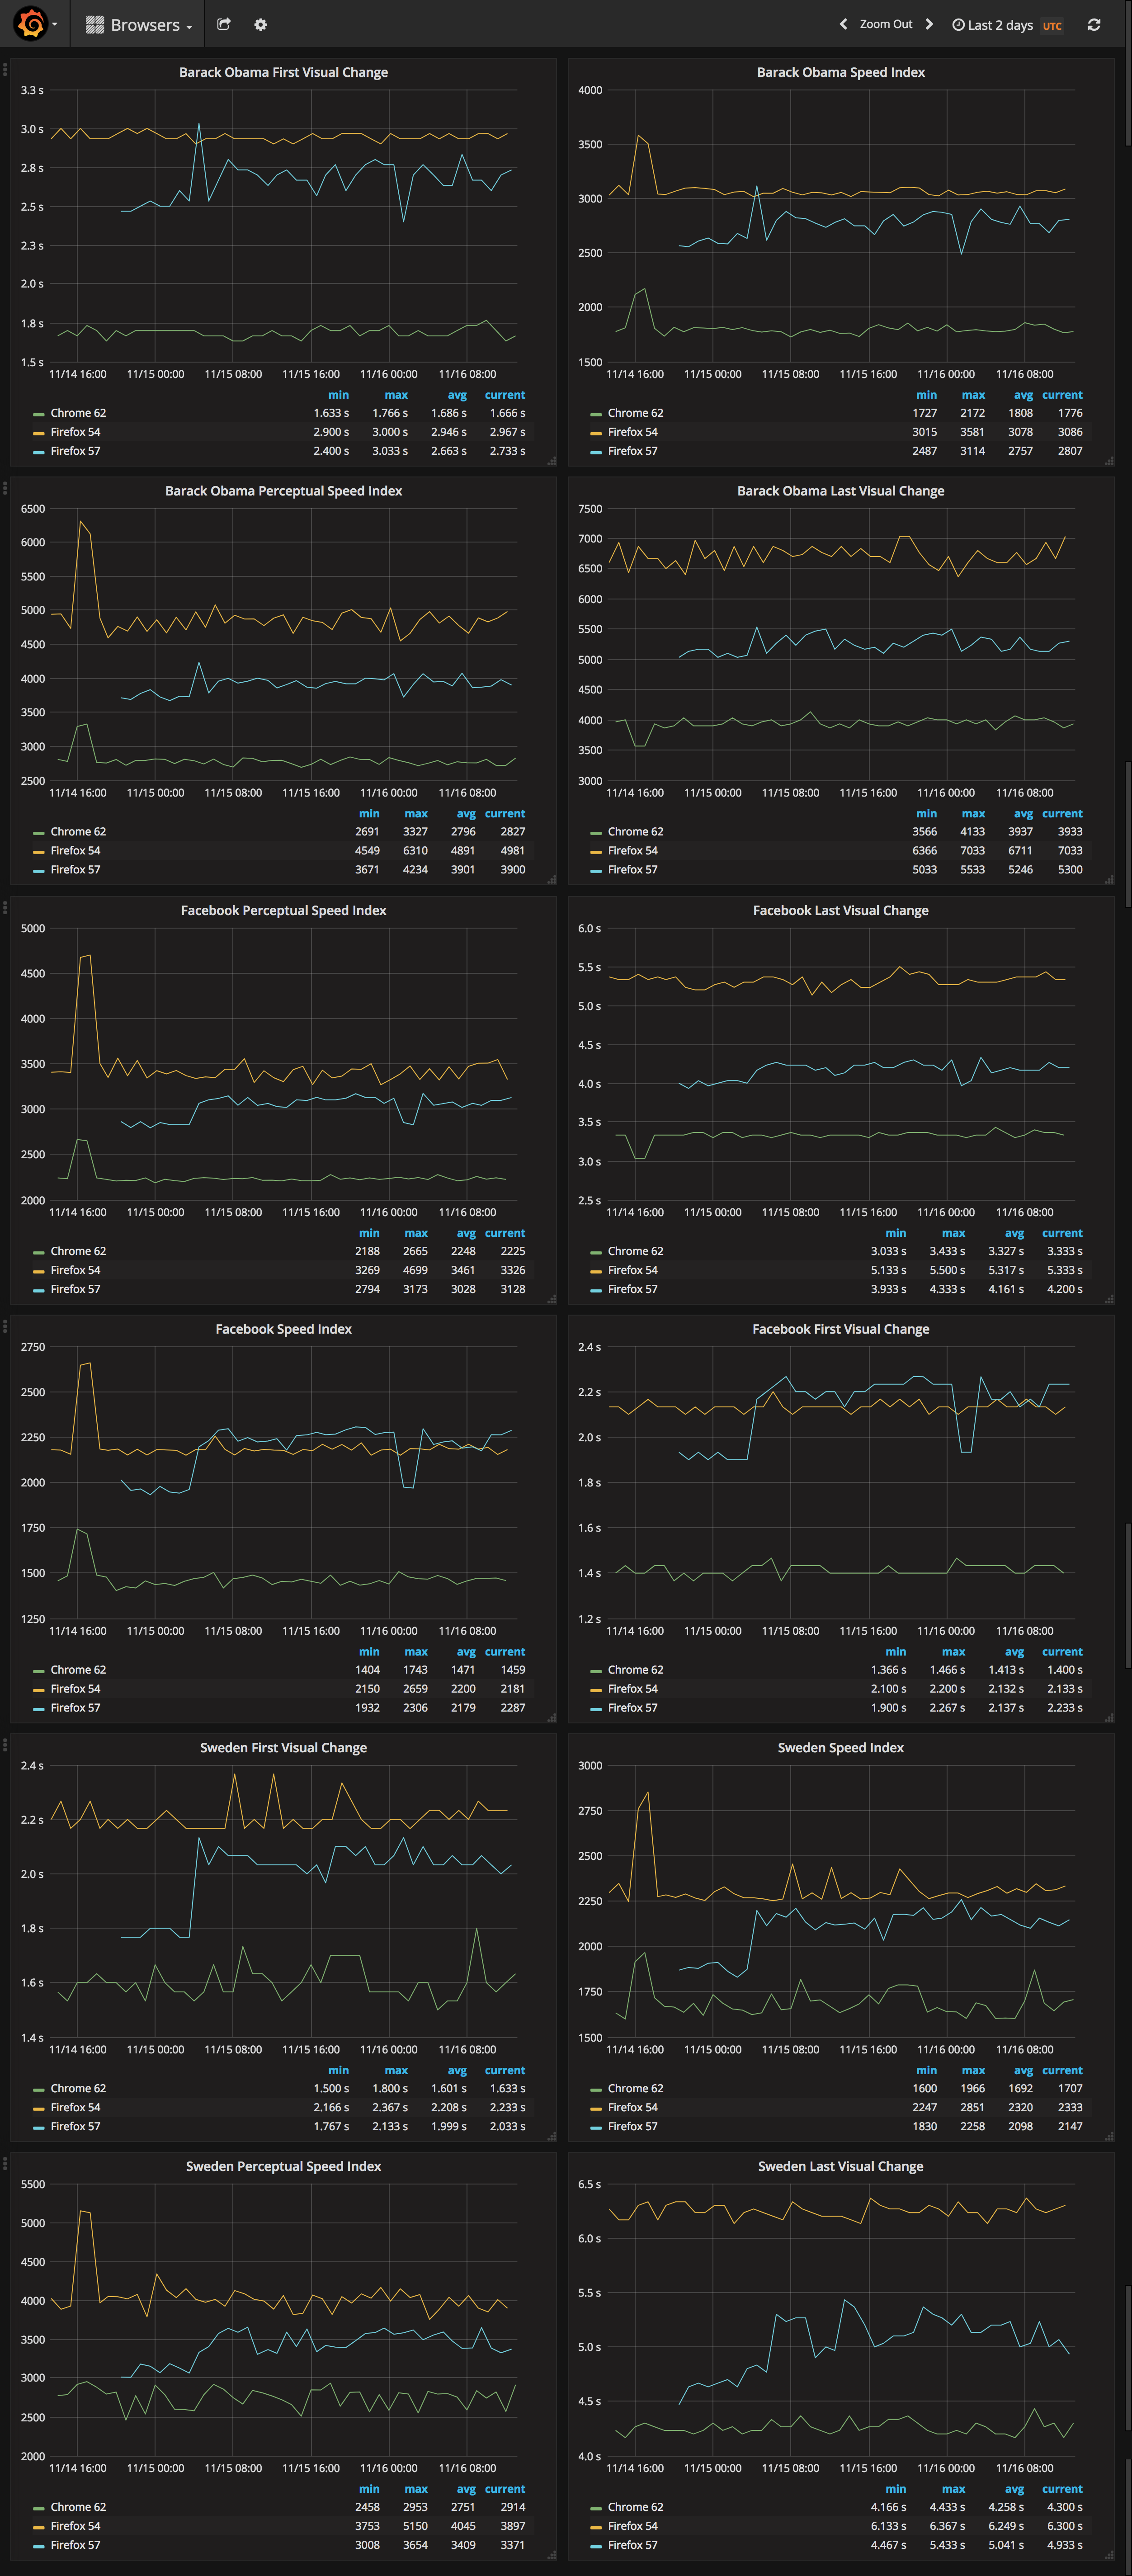
Running on AWS, c4.large Linux, connectivity type cable, taking the median of 7 runs (30fps). Looks like on the Facebook page we have regression in some values. Else 57 is faster than 54.

Screen Shot 2017-11-16 at 2.11.37 PM.png (944×2 px, 266 KB)

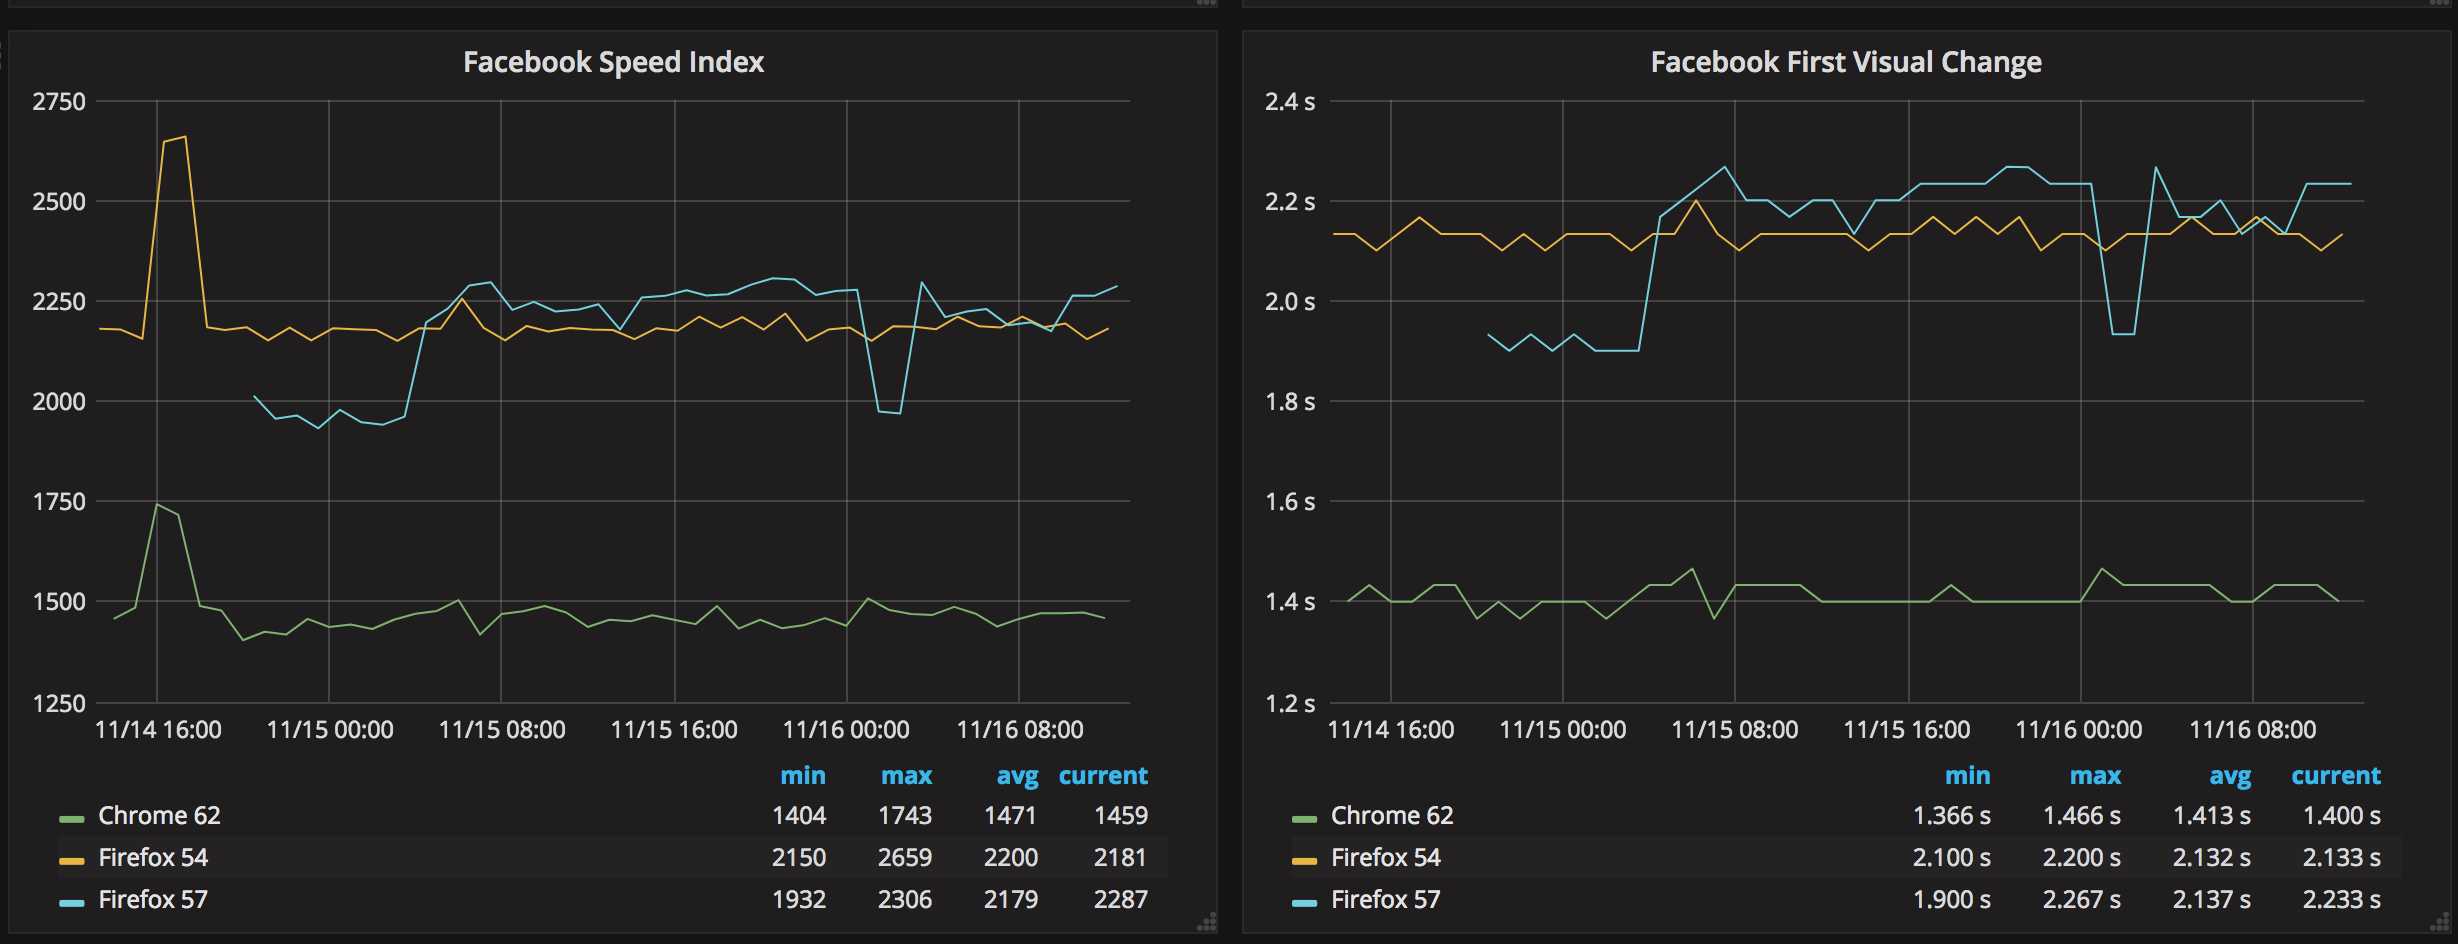
Also the metrics seems more unstable for 57 than 54 and metrics. Also Chrome is actually running with trace-logging turned on (adding x ms to all metrics).

Here's the full result of all tested pages for the history.

fulldiff.png (5×2 px, 845 KB)

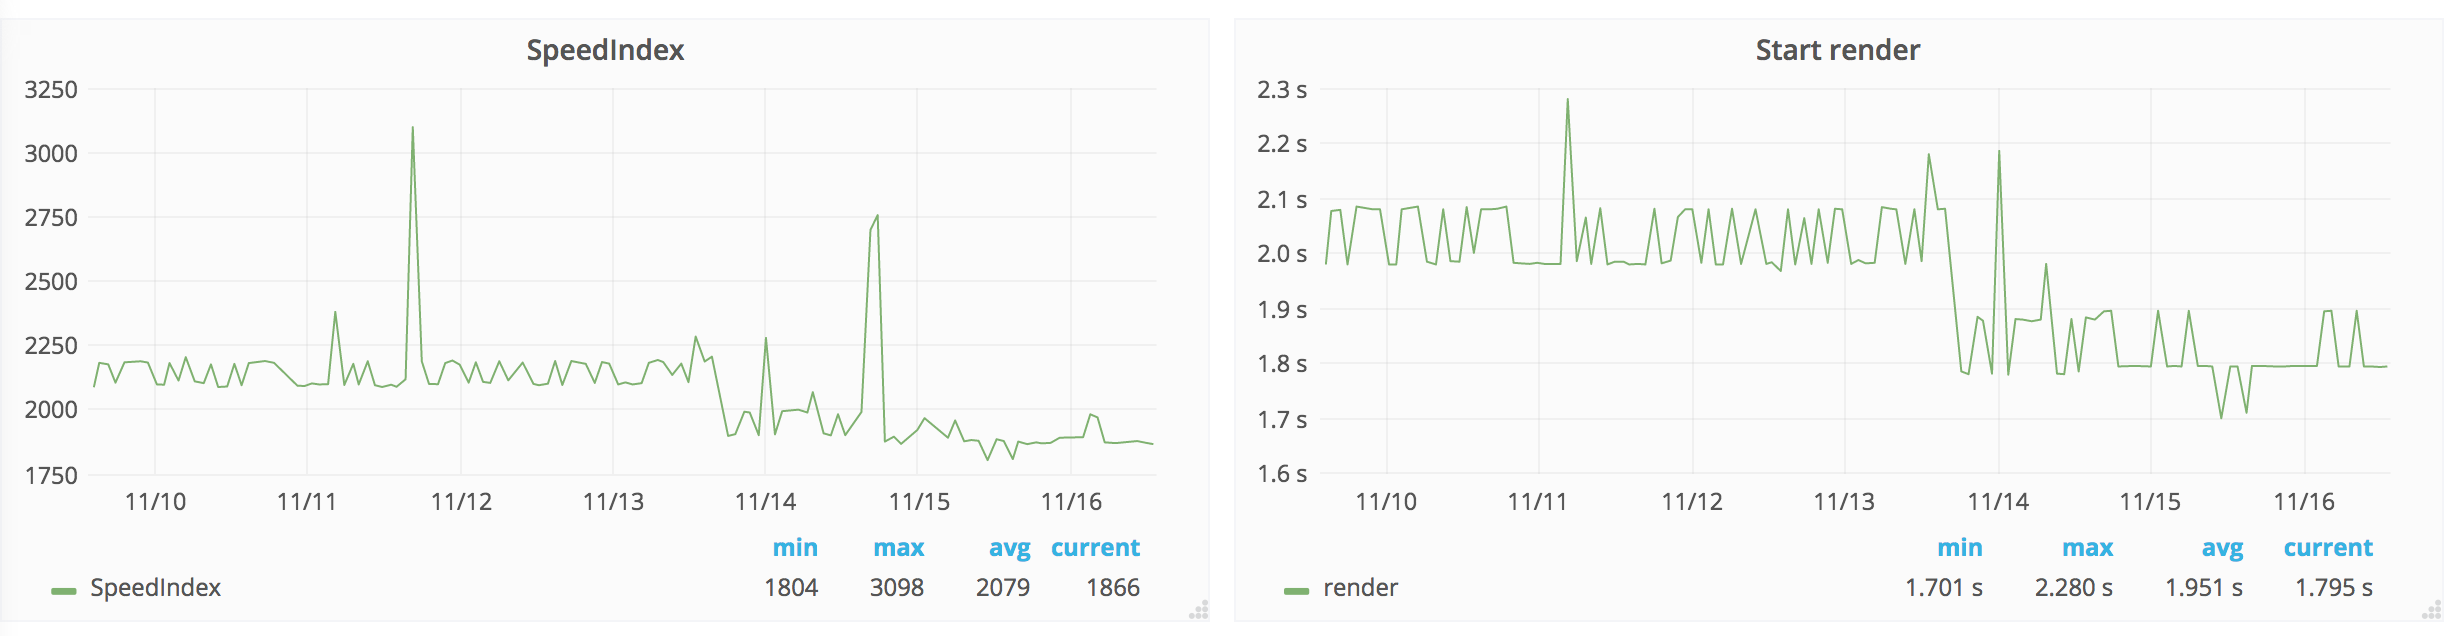
Comparing FF56 and 57

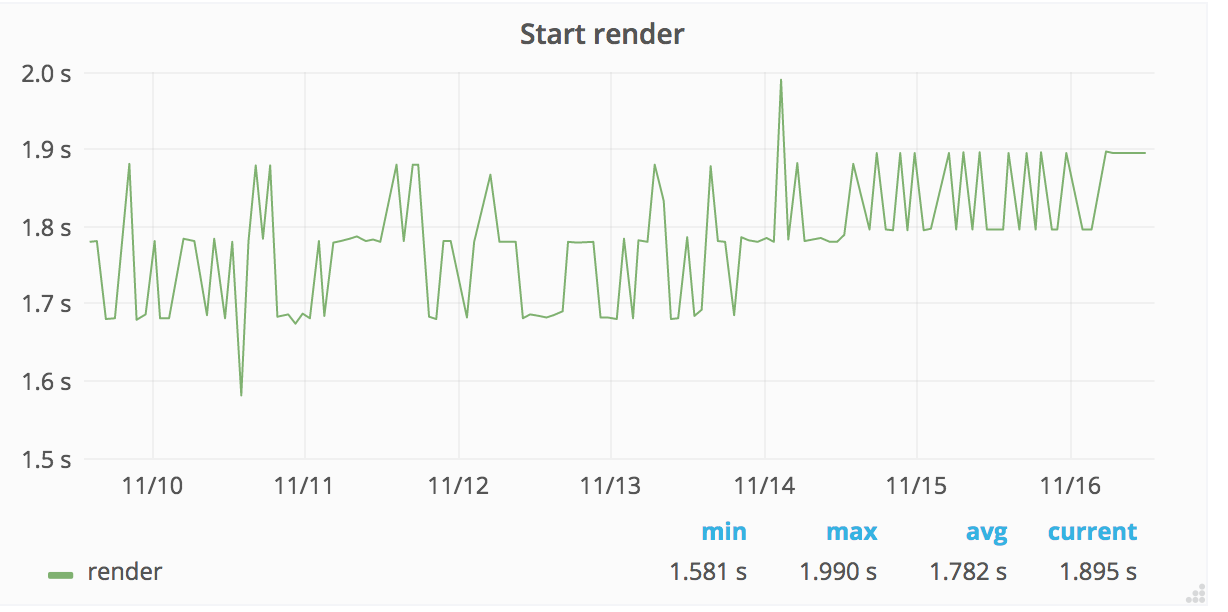
Running WebPageTest, c4.large windows, 10 fps, cable connectivity, 5 runs. FF 57 was picked up something like 2017-11-14 17.00 UTC.

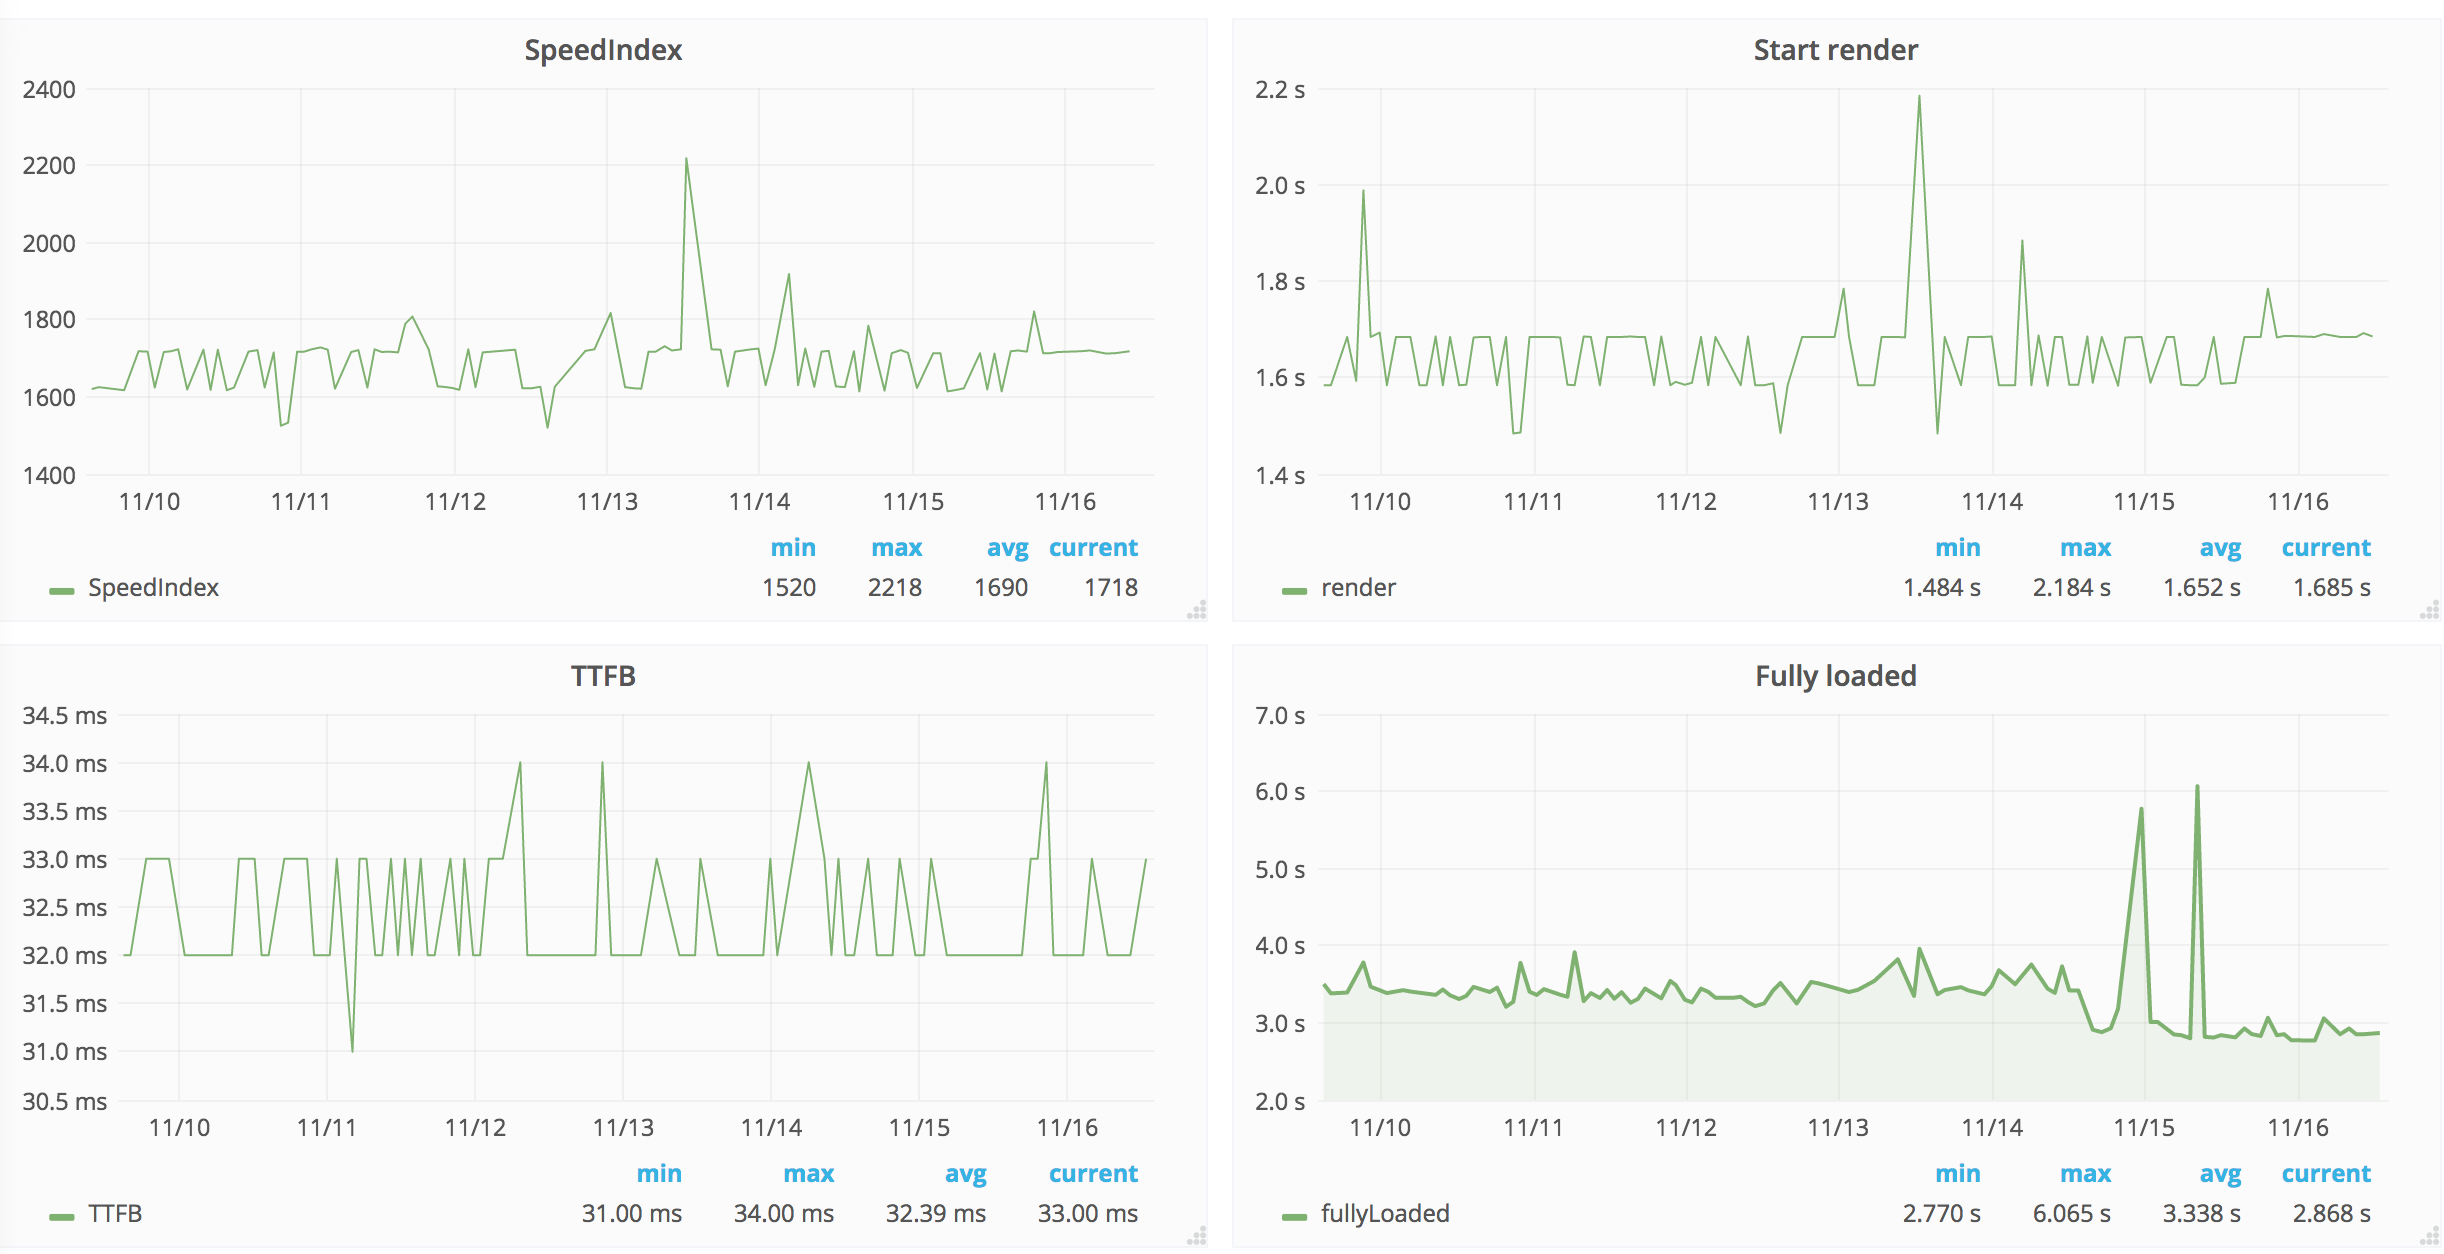
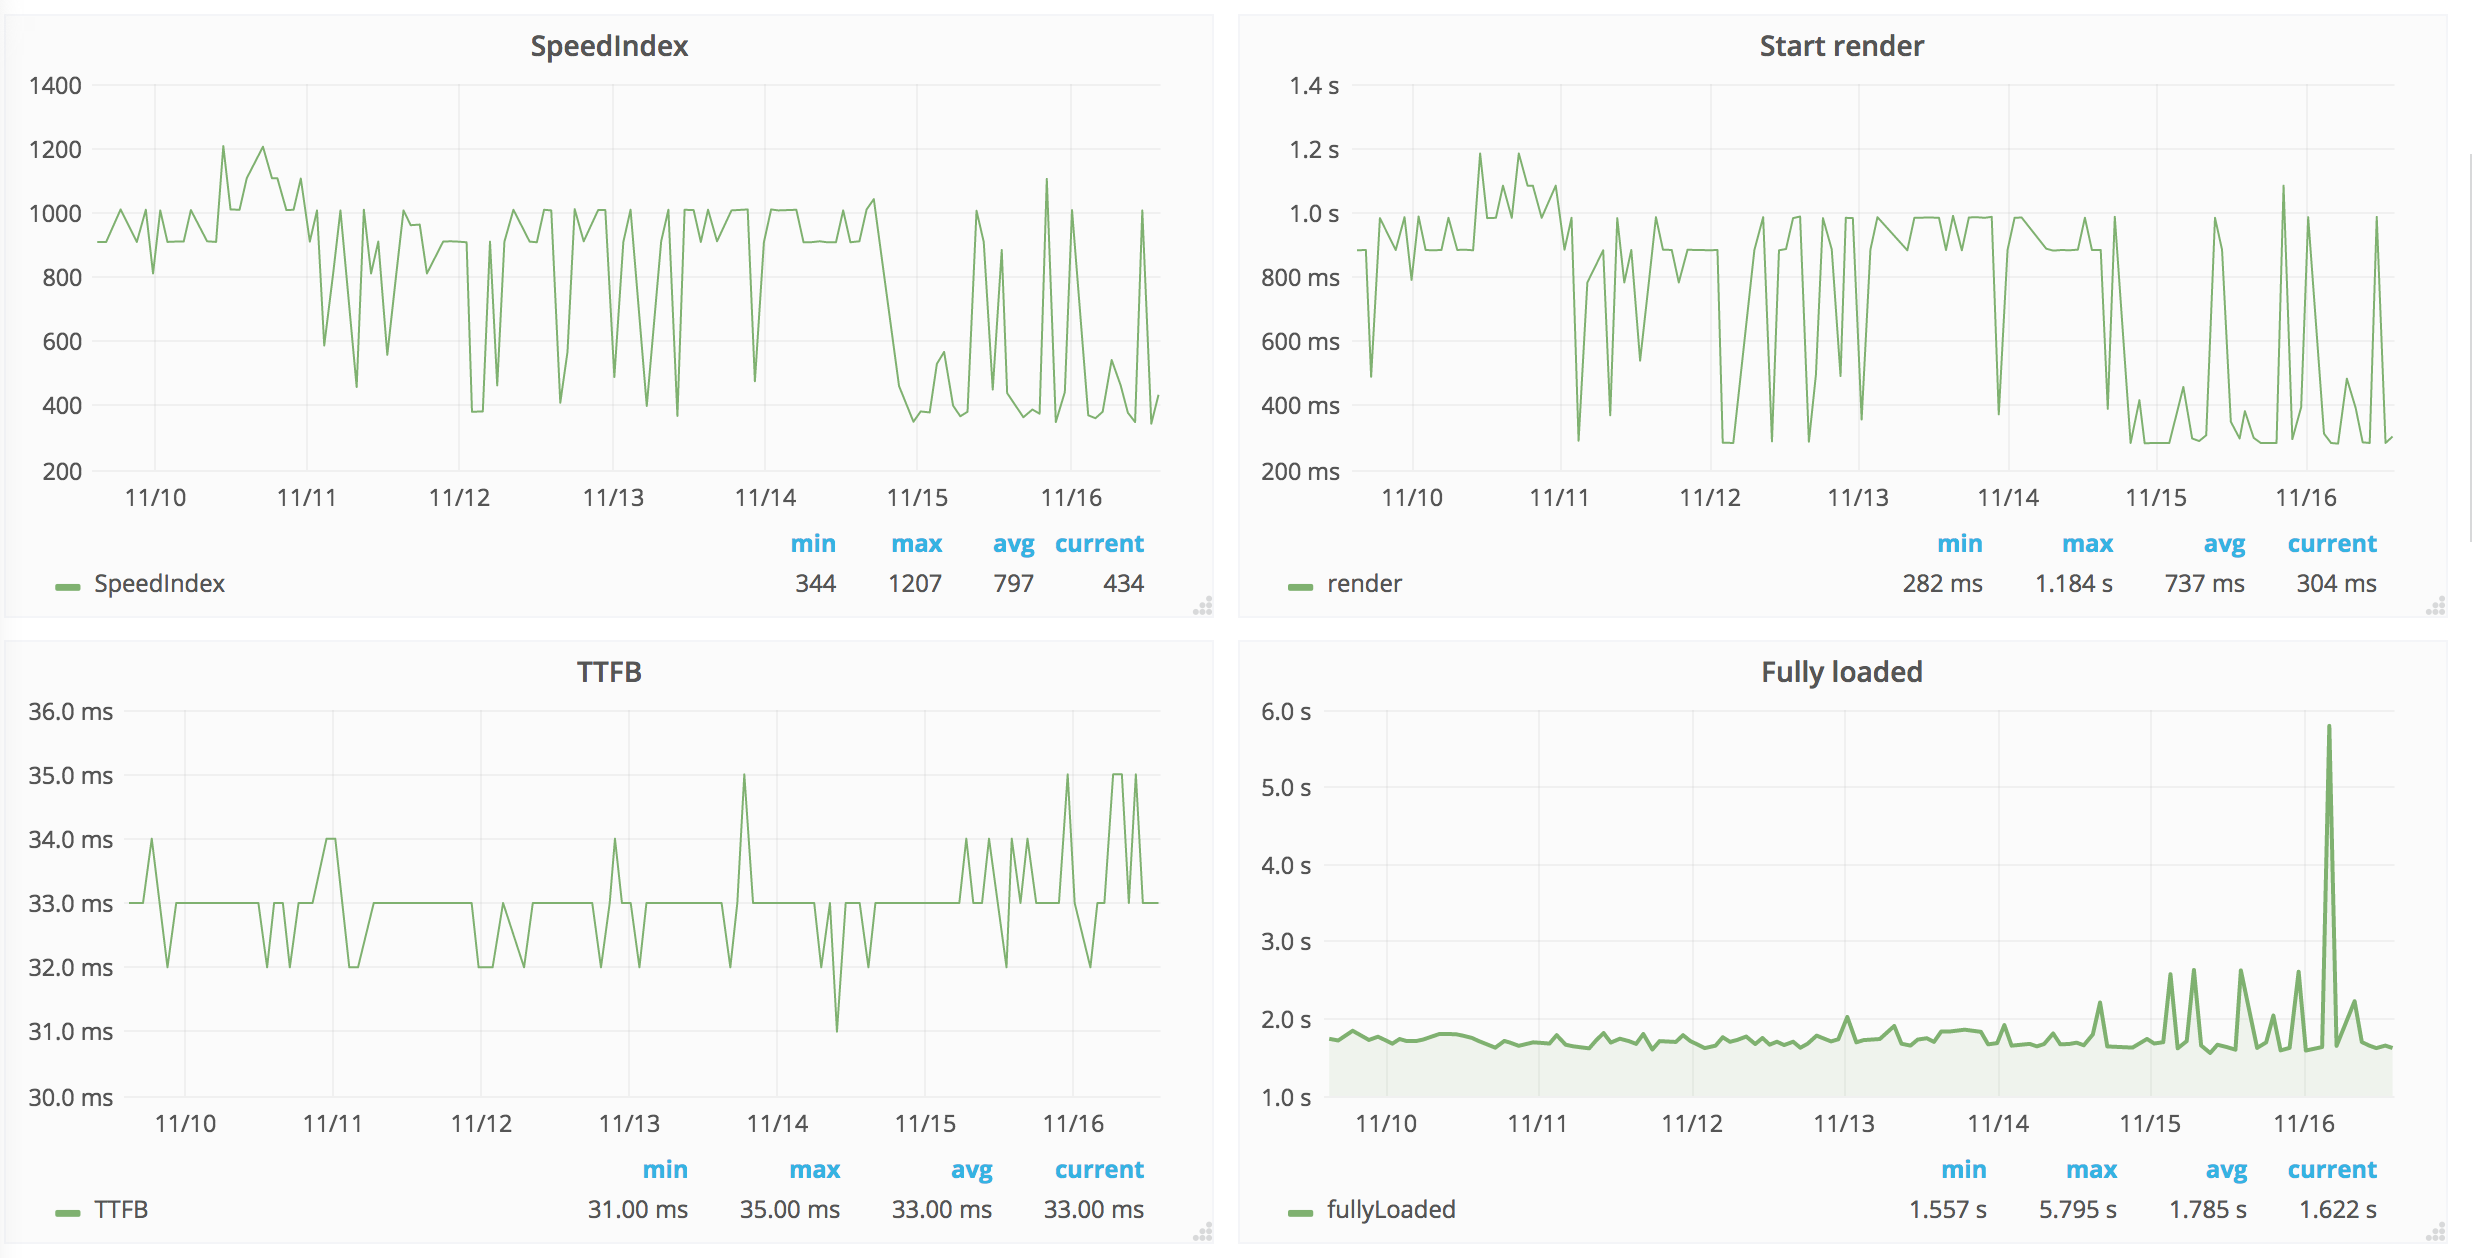
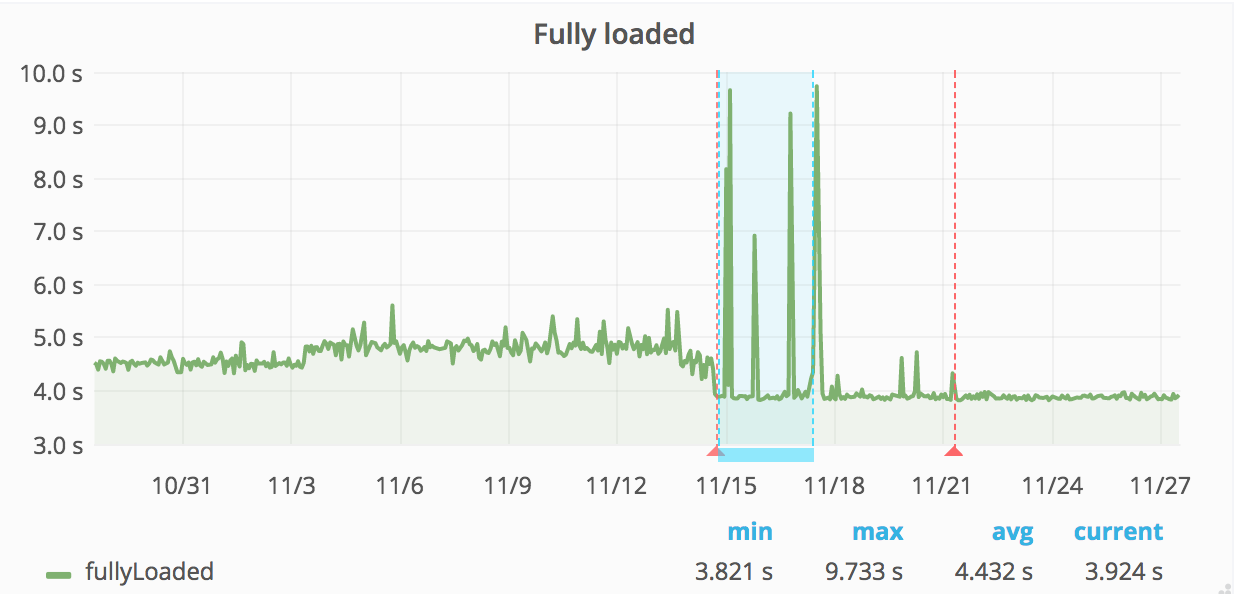
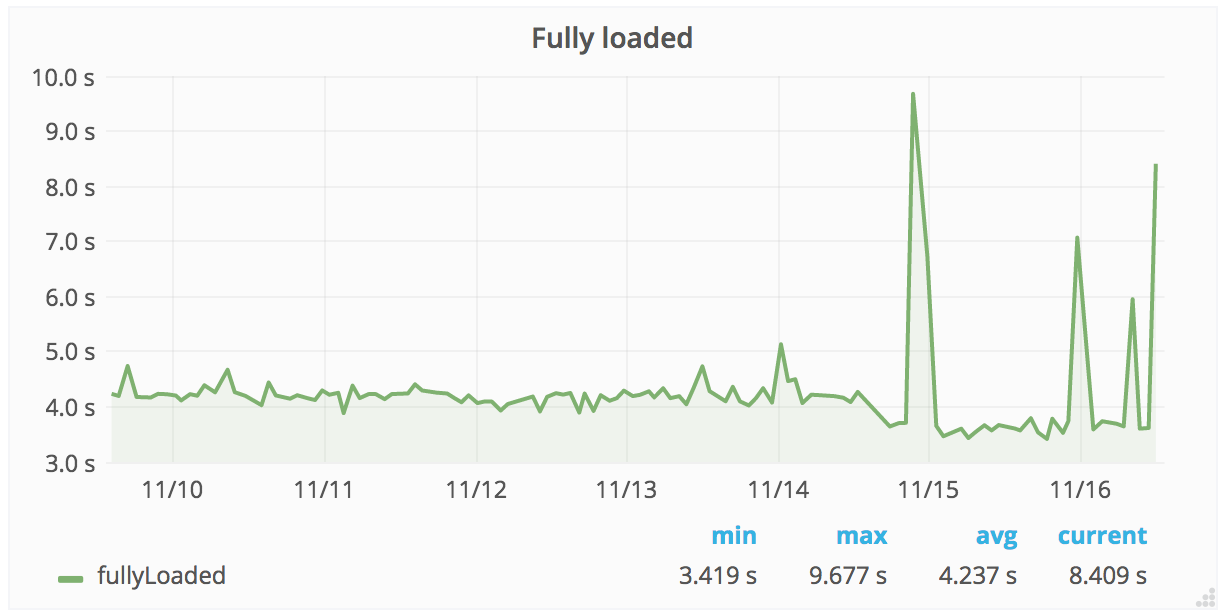
It seems like fully loaded is better in 57 across the board. For our Facebook page we can also here see a regression (WPT picked up 57 late the 14th):

Screen Shot 2017-11-16 at 2.19.36 PM.png (612×1 px, 89 KB)

Fully loaded looks better but we have high measurements that we haven't seen before:

Screen Shot 2017-11-16 at 2.21.01 PM.png (616×1 px, 84 KB)

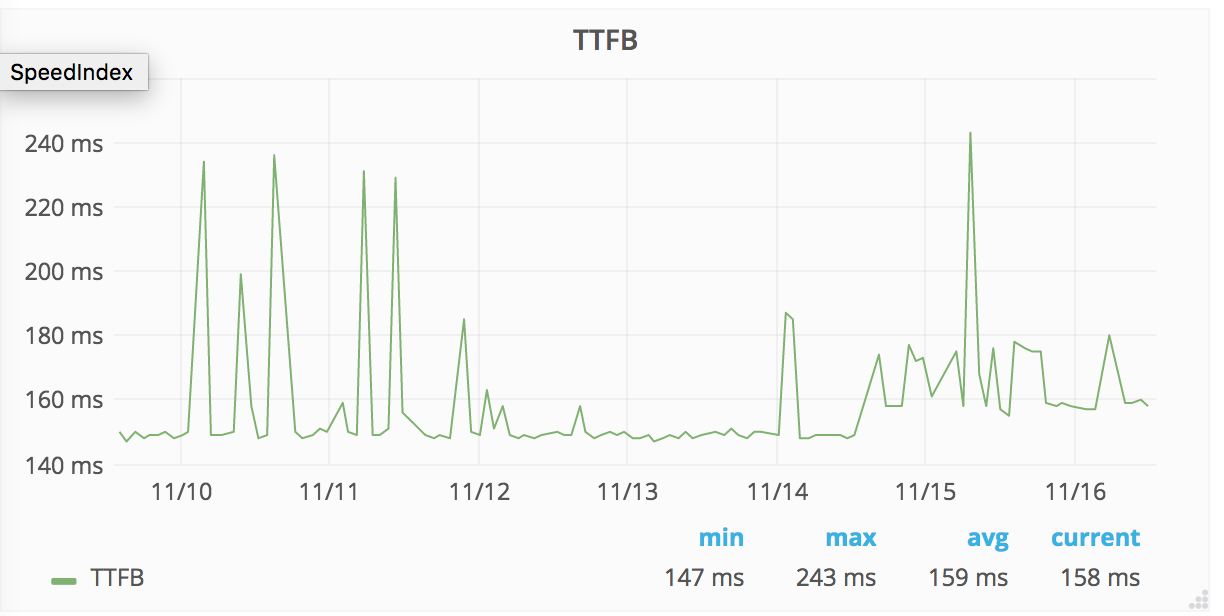
It also looks like reported TTFB increased (but that I guess it can depend on how WPT measure it):

Screen Shot 2017-11-16 at 2.22.34 PM.png (616×1 px, 92 KB)

For Sweden we can see better metrics on SpeedIndex & first visual change but the big change happened there before 57 was released:

Screen Shot 2017-11-16 at 2.29.52 PM.png (636×2 px, 170 KB)

See: https://bugzilla.mozilla.org/show_bug.cgi?id=1418013

Event Timeline

Also adding what we have on second view for Firefox (second view = hit one page, then go to another page):

Facebook first visit https://en.wikipedia.org/wiki/Main_Page then wait 30s and go to https://en.wikipedia.org/wiki/Facebook - better fully loaded else no change.

Screen Shot 2017-11-16 at 3.05.56 PM.png (1×2 px, 327 KB)

Elizabeth first visit https://en.wikipedia.org/wiki/Edward_VI_of_England then wait 30s then go to https://en.wikipedia.org/wiki/Elizabeth_I_of_England - woho here it looks like SpeedIndex and start render is getting better. We sometimes have the same value as before but often much faster. Fully loaded is better too but we also have those really high numbers sometimes.

Screen Shot 2017-11-16 at 3.10.28 PM.png (1×2 px, 348 KB)

It looks like the second view has potential to be much faster but it is hidden in the unstable values, let me change the tests on the other server and see what it looks like.

I've seen this https://bugzilla.mozilla.org/show_bug.cgi?id=1418013 and Pat pushed a change yesterday but no change in the metrics, I'm building a new container now with some updated preferences to see if the metrics change. If not lets wait to see how we should do to disable the TP. I'm not completely sure about the impact though since we have the same result for when we test two URLs.

Sorry the push was for the WPT agent, I pushed a PR now for the Windows version.

Timings for FF57 went down 200-500 ms removing the calling home. I've also removed trace logging for Chrome in the graphs, that shaved off 200 ms.

Is the task description up-to-date in regards to that bugfix? I.e. are regressions you initially saw on FF57 still true?

It's not 100% easy to say since we've been running banners back and forth. The fix Pat did on WebPageTest (stop downloading tracking protection files) didn't make any change. For Browsertime it did but I also turned of the heartbeat at the same time. It would be super if they could share any numbers/benchmarks themselves. I've seen the Navigation Tests they blogged about, but that test measure onload, don't use a constant connectivity speed, use averages + would probably not be correct if they hit the Navigation Timing bug I've reported.

That was not completely right: Turning off the tracking protection made fully loaded more stable:

Screen Shot 2017-11-27 at 1.59.33 PM.png (594×1 px, 93 KB)

But it's been recommended not to turn off the tracking protection since it will change behavior of Firefox, the recommended way (so far) is to populate the profile cache with the downloaded files. As a long term solution that will not work so good for us, because we will have a regression every time the cache is old, and need to be downloaded.

I think that's a non-issue, clearing the cache every time isn't "normal behavior" either. Saying that this particular feature needs to be on for things to be realistic is just cherry-picking.

I agree but they say it also disables two new Quantum optimizations https://bugzilla.mozilla.org/show_bug.cgi?id=1418013#c9

Does WPT allow you to select the FF profile that you're running under? Would it be worth running two sets of tests, one with Tracking Protection turned on, one with Tracking Protection turned off?

If that's not possible/doesn't make sense, I'd be inclined to say that we should turn it off. Otherwise it makes observations of the thing that we want to measure (performance of our software/site) dependent on something that we can't control.

@Imarlier it is turned off right now in WebPageTest. Adding to the cache, I think Pat will fix that but the issue stalled over thanksgiving and the weekend. @Gilles has asked now about the optimizations. Also I asked before if they can help us provide a best practice how they think Firefox should be setup.

Peter renamed this task from Firefox 57 improvement/regressions to Firefox 57 improvement.Nov 30 2017, 10:35 AM

I've checked now and values are better than 54 after turning of downloading of tracking protection files. I'll add that to the upstream bug and also again ask about preferred setup.

I'll close it since there's no action for us to fix.