Per T184942#4083351 and T184942#4087564, I think we now have all the data we need in Prometheus.
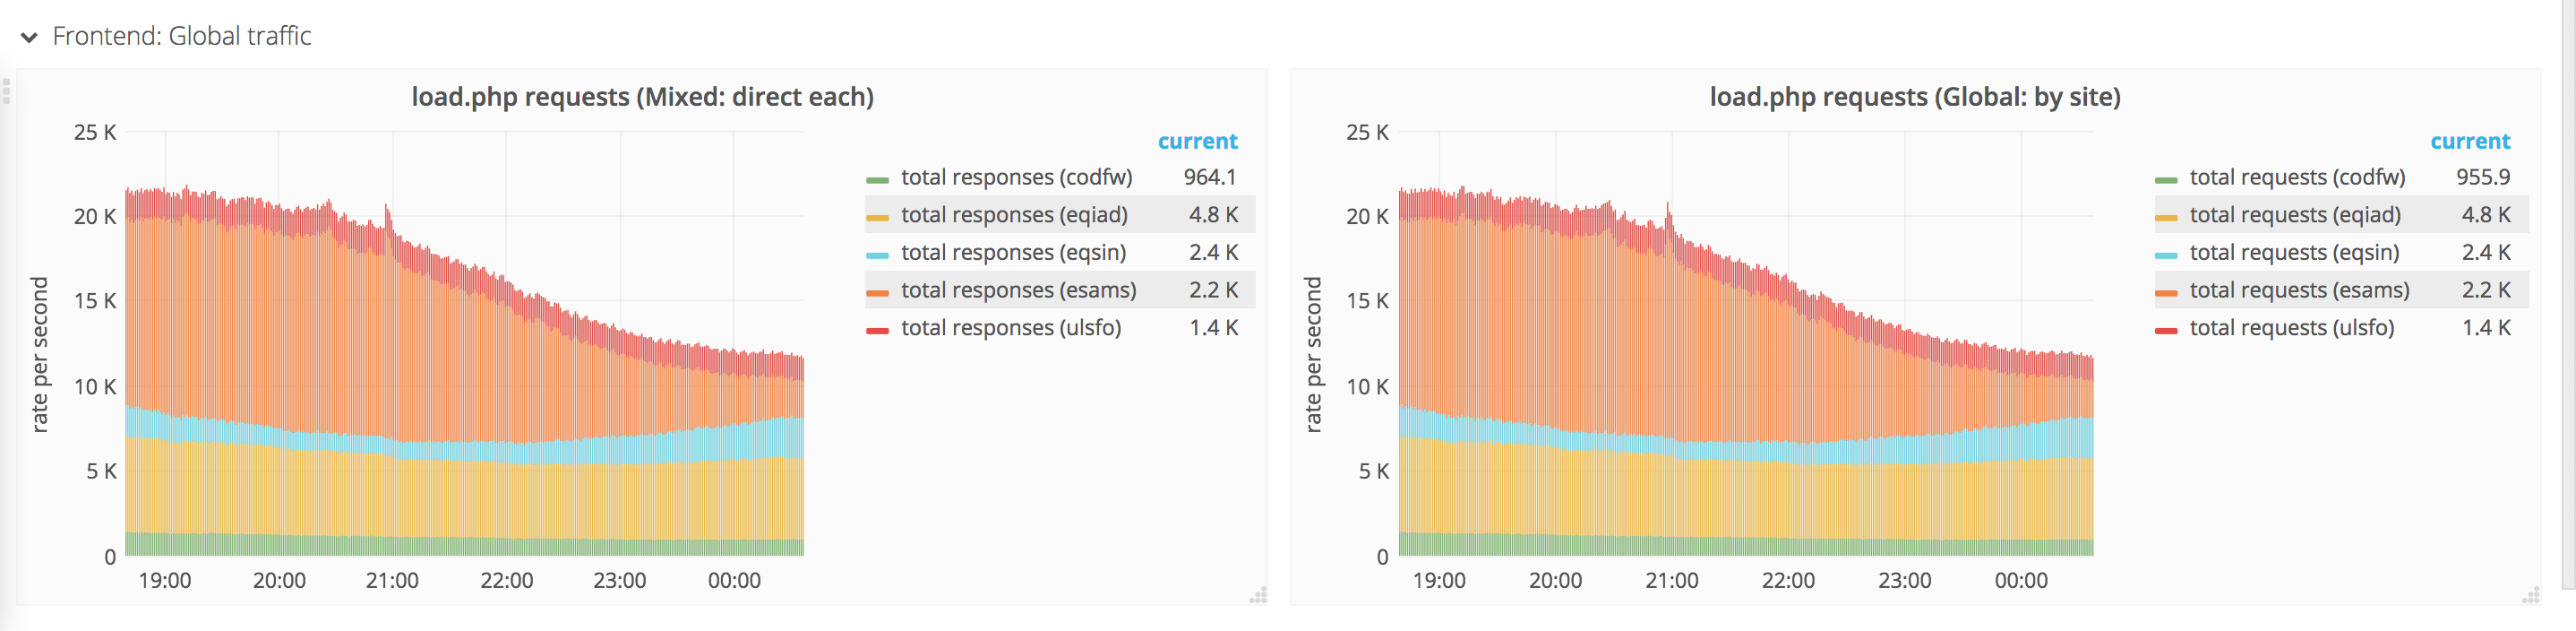
- https://grafana-admin.wikimedia.org/dashboard/db/resourceloader
- https://grafana-admin.wikimedia.org/dashboard/db/resourceloader-alerts
There is also the https://grafana.wikimedia.org/dashboard/db/resourceloadermodule dashboard but it only uses MediaWiki/ResourceLoader internal metrics that aren't affected by the move the Prometheus right now. Only the Varnish metrics are being moved, used by the main and alert dashboards.