Profile
Name: Rammanoj Potla
Email: rammanojpotla1608@gmail.com
MediaWiki Username: Rammanojpotla
Github: rammanoj
Gerrit: rammanoj
IRC Username: rammanoj__
Time zone: UTC + 5:30 (IST)
Location: Kerala, India
Working Hours (in IST): Weekdays - 17:00 to 23:30 and Weekends- 09:00 to 23:30
Summary
Due to a large list of users contributing to MediaWiki, it is difficult to track an individual’s activities. Currently, the contributor’s activity is tracked using Bitergia's analytics.
The project aims to develop a tool (from scratch) to track the activities of contributors by the event organizers. The tool uses APIs of Gerrit and Phabricator and fetches the contributions of the user. The fetched contributions of a contributor will be displayed in the form of graphs.
Mentors: @srishakatux, @D3r1ck01, @Tuxology, @samuelguebo
Deliverables
- Adding the username:
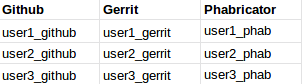
- User can upload the list of usernames from Gerrit, GitHub and Phabricator (CSV formatted data).
- The contents of uploaded CSV file are read and the corresponding API calls are made with usernames in CSV file.
- Then fetched data of all the users are displayed in the specified format.
- Fetch user contributions Individually:
- Whenever an event organizer queries about a contributor or a list of contributors (along with the platform like Gerrit/Phabricator). An API call is made to fetch the information and display on the screen.
- When querying about the contributions of a user, either single platform can be selected or multiple platforms can be selected.
- Personalized filters can be added while fetching the data from the API, to improve usability.
- Some of these filters can be like:
- Status - Indicates the present status of the issue (i.e merged, needs review etc).
- time frame - fetches the contributions of a user the specified timestamp.
- Project - By the project the user worked with (i.e may be the extension).
- Display the user data (fetched using the API):
- There can be different formats in which the data can be displayed like:
- List format
- Histograms
- Pie charts
- Users can select one of the above formats to display the fetched information according to the need.
- There can be different formats in which the data can be displayed like:
Implementation
- Fetch the details of a large list of users by CSV:
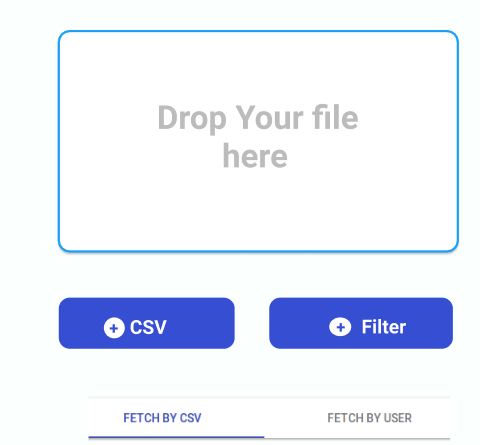
- In this phase, a CSV file containing the list of different users can be uploaded. The CSV file has to be uploaded in a certain format. The contents of the uploaded CSV file can be read and API calls are made to Gerrit and MediaWiki Conduit API to fetch the user contributions.
- The API calls are asynchronous (i.e the API requests does not wait for the response of the previous calls), once the response to the initial API call is received the result will be rendered on the screen. In a similar manner, the above process repeats until the contributions of all the users are fetched.
- There can be an option provided to download the result in the form of PDF
- The CSV file format:
- Below attached are some sample mockups of fetch details by CSV
Mockup I
Mockup II
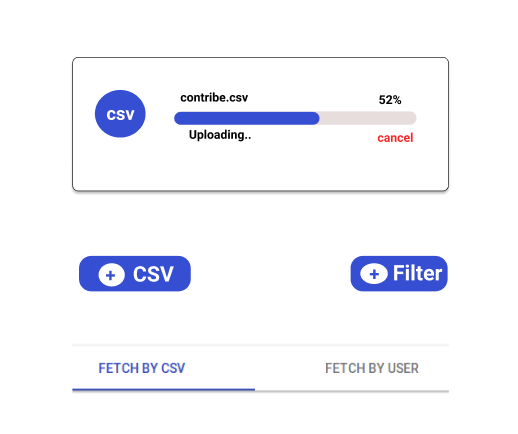
In the above mockup, the process of uploading a CSV file is shown.
- Fetch user contributions Individually:
- A specific username or a group of usernames can be given here along with the platform from which the contributions has to be fetched. There are also the filters provided specifically to platform selected. So that the user contributions can be fetched from the APIs
- The API calls are asynchronous, once the response to the first API call is received the result will be rendered on the screen. In a similar manner, this repeats until the contributions of all the users are fetched.
- Below attached are some sample mockups of fetch details individually by usernames
Mockup III
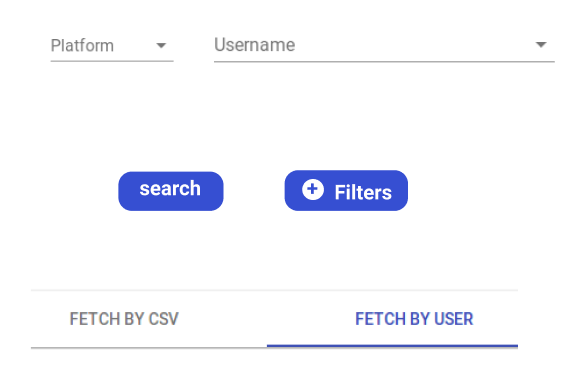
To fetch by a single user or group of users
Mockup IV
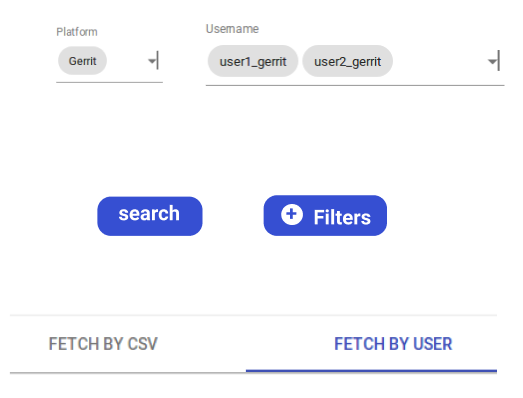
As shown above, for a selected platform, multiple users can be selected (i.e small list of users)
- Display the user data (fetched using the API):
- Once the user data is fetched from the corresponding APIs, the details will be displayed default in the list view.
- Users will be given different options to visualize the data. In the case of graphical views, some of the chart plotting libraries (like CanvasJS) can be used. -So, in the case of charts, they can be plotted as no. of contributions vs time.
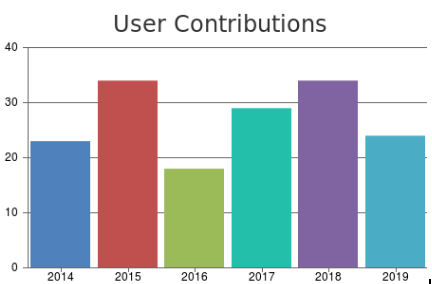
- In the case of a bar graph, each bar can be represented as years. So, if a specific bar is clicked, a new graph is plotted with all the contributions made in that specific year, each bar representing a month. This can even proceed for the days in the month.
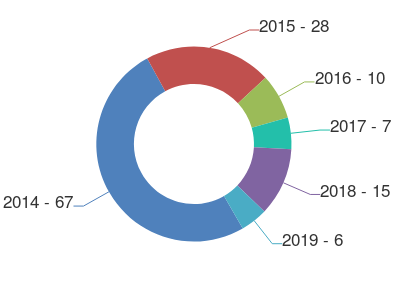
- This can be the basic mockup for the design:
Bar Graph:
Pie Graph:
Tech stack (possibly used): Python (Django/Flask), React.JS, CanvasJs
Timeline
| Tasks to be completed | Time Period |
|---|---|
| Community bonding period: In this stage, I will discuss with the mentors about the exact technologies used in developing the tool and their suggestions to move forward in the project. I will be occupied with final exams for ten days. I can not work from 7th May to 17th May. Apart from that, I can spend all my time working on the project. | May 17th - May 27th [7+ hrs per day] [30+ hrs per week] |
| Start with the first phase of the project and focus more on implementing the functionality part of the first task in this phase. Implement the feature of basic CSV file uploads and fetching the information | May 27th - June 7th [8 hrs per day][35+ hrs per week] |
| Add some other features to the above functionality like uploading multiple files once etc. Implement the complete UI to the above functionality and getting it reviewed from the mentor. | June 8th - June 17th [8 hrs per day][35+ hrs per week] |
| Fix all the bugs in the above functionality, along with minor UI changes. | June 18th - June 23rd [8 hrs per day][35+ hrs per week] |
| Phase I Evaluation, get the suggestions from the mentor about the above functionalities and fix them all. | June 24th - June 28th [8 hrs per day][35+ hrs per week] |
| Implement a feature the second functionality of recommending the usernames on typing the partial text in the search bar (inefficient manner). Also, work with the UI of the feature. Add the feature to select the platform from which the contributions have to be displayed. | June 29th - July 6th [6 hrs per day][25+ hrs per week] |
| Add some additional filters for getting more precise information. Implement the actual API request and fetch the information. The API requests will be implemented as asynchronous ones. So, if there are a number of requests to be made, multiple ones can be made simultaneously without any delay. | July 7th - July 13th [7 hrs per day][30+ hrs per week] |
| Finally, test all the above features added. Update the UI according to the requirements specified | July 14th - July 21st [7 hrs per day][30+ hrs per week] |
| Phase II Evaluation, get the suggestions from the mentor about all the above-implemented functionalities and UI and fix them all. | July 22nd - July 26th [7 hrs per day][30+ hrs per week] |
| As the final functionality of the project, display the fetched information in the form of the listview. Also, add the better UI to the list view. | July 26th - August 1st [7 hrs per day][30+ hrs per week] |
| The user can select the format in which the data can be viewed. Chart library will be integrated into the project. The user will be provided with the option to specify the data in the form of pie and bar graphs | August 2nd - August 11th [7 hrs per day][30+ hrs per week] |
| Fix all the bugs in UI for the above functionality | August 12th -August 18th [7 hrs per day][30+ hrs per week] |
| Phase III evaluation. | August 19th- August 26th |
About Me
I am a Junior student in Computer Science and Engineering at Amrita University, Amritapuri, India. Apart from academics, I contribute to Free and Open Source Softwares. I am a member of the FOSS club of our university, FOSS@Amrita. I have solid experience with Git, Gerrit and various other OSS tool. I also have hands-on experience in designing and developing a full-fledged responsive web-based application from scratch. With more than one year of experience in contributing to MediaWiki, I have fixed 16 bugs across various extensions and Vector skins. With my past experience of contributing to MediaWiki and curiosity to explore more features of it, I’m eagerly looking forward to starting contributing to this project as part of GSoC 2019.
Previous Experience
- Designed school management software:Designed a web application for schools. This includes an admin panel where marks, attendance of students along with current activities and announcements, can be hosted. This also contains a parent portal through which parents can get access to their wards marks and attendance. Apart from HTML and CSS, I mainly used JavaScript, JQuery, Bootstrap for the front-end design of the site. For the back-end, PHP and MySQL were used.
- Developed a Medical HealthCare project: As a part of the SLAC hackathon, We developed a project that implements some ML algorithms and predicts the diseases from the given scope of symptoms. There can be rating associated with each and every search result. This app is mainly for doctors, each doctor can add experience for the diagnosis he/she performed. Finally, we were second in the hackathon.
- Designed a Shopping cart:Designed a simple shopping cart application where the users can view, cart and buy items. There is a simple login panel where the users have to log in to access the above features. This login page validation is done using AngularJS. I mainly used HTML, CSS, javascript and AngularJS in this application. Github: repo
Technical Skills
Programming Languages: Python, JavaScript, PHP, Java, C, C++(Beginner)
Other Languages: HTML, CSS
Frameworks: ReactJS, ReactJS-material, AngularJS(Beginner) JQuery, Bootstrap, Python-Django, Flask(Beginner)
Databases: MySQL, SQLite, Postgresql, MongoDB(Beginner)
Operating systems: Windows, Linux
Queries
Have you participated in the Google Summer of Code in the past?
Yes, I have participated in GSoC last year. I applied for MediaWiki.
Are you applying to any other organizations this year?
No, I am not applying to any other organisations except MediaWiki
Micro Tasks:
- Task-1: Using the Gerrit API to fetch user contributions [0]
- Task-2: Using the Phabricator API to fetch all the user subscriptions in a timeframe, [1]
- Task-3: To design some basic mockups to the tool, The mockups are added along with the proposal.
[0] - https://github.com/rammanoj/Mediawiki_micro_task/blob/master/task1.py
[1] - https://github.com/rammanoj/Mediawiki_micro_task/blob/master/task2.py
Note: All the above images provided are just wireframes. The colour standards may change according to the design requirements.
Mediawiki Merged patches:
- Fix HTML table format breakage
- Extension: Wikidata Query UI
- Gerrit link: https://gerrit.wikimedia.org/r/#/c/wikidata/query/gui/+/426756/
- Add an option to download WDQS results in HTML table format
- Extension: Wikidata Query UI
- Gerrit link: https://gerrit.wikimedia.org/r/#/c/wikidata/query/gui/+/423339/
- Fix text and image name truncation in image grid
- Extension: Wikidata Query UI
- Gerrit link: https://gerrit.wikimedia.org/r/#/c/wikidata/query/gui/+/420236/
- Translate "Filter" and "show" buttons dynamically
- Extension: Wikidata Query UI
- Gerrit link: https://gerrit.wikimedia.org/r/#/c/wikidata/query/gui/+/420172/
- Enable "limit" button to translate
- Extension: Wikidata Query UI
- Gerrit link: https://gerrit.wikimedia.org/r/#/c/wikidata/query/gui/+/417825/
- Enable non-ascii letters in expression error
- Extension: Parser functions
- Gerrit link: https://gerrit.wikimedia.org/r/#/c/mediawiki/extensions/ParserFunctions/+/407596/
- Improve "Submit" button of Special: ViewData to look better
- Extension: Cargo
- Gerrit link: https://gerrit.wikimedia.org/r/#/c/mediawiki/extensions/Cargo/+/410104/
- Enable all categories in Parent category drop-down.
- Extension: Page Forms
- Gerrit link: https://gerrit.wikimedia.org/r/#/c/mediawiki/extensions/PageForms/+/410098/
- Vector: Flip horizontal nav elements with CSS
- Skin: Vector
- Gerrit link: https://gerrit.wikimedia.org/r/#/c/mediawiki/skins/Vector/+/379577/
- Tabs (Read / View Source / Search) collapsed under more in resolution < 700px
- Skin: Vector
- Gerrit link: https://gerrit.wikimedia.org/r/#/c/mediawiki/skins/Vector/+/368803/
- Proper indentation applied to horizontal links in the vector skin
- Skin: Vector
- Gerrit link: https://gerrit.wikimedia.org/r/#/c/mediawiki/skins/Vector/+/344976/
- Audit/update headers in files
- Extension: Pdf Handler
- Gerrit link: https://gerrit.wikimedia.org/r/#/c/mediawiki/extensions/PdfHandler/+/352122/
- Audit/update headers in files
- Extension: Page Triage
- Gerrit link: https://gerrit.wikimedia.org/r/#/c/mediawiki/extensions/PageTriage/+/352120/
- Audit/update headers in files
- Extension: Page Triage
- Gerrit link: https://gerrit.wikimedia.org/r/#/c/mediawiki/selenium/+/348935/
- mediawiki_selenium should document SauceLabs usage
- Extension: Selenium
- Gerrit link: https://gerrit.wikimedia.org/r/#/c/mediawiki/extensions/PageTriage/+/352120/
- Ruby gem documentation should state license
- Audit/update headers in files
- Ruby gem documentation should state license
- Extension: Selenium
- Gerrit link: https://gerrit.wikimedia.org/r/#/c/mediawiki/selenium/+/348222/
Tools used for mockups:
https://www.figma.com/ (for designing some mockups)
https://dribbble.com/ (To view the available ones).