Page MenuHomePhabricator

Research performance changes on prometheus-mysqld-exporter after buster/mariadb upgrade
Closed, ResolvedPublic

Assigned To
Authored By
Kormat
May 14 2020, 11:47 AM
Referenced Files
F31819369: Screenshot_20200515_104816.png
May 15 2020, 8:50 AM
F31819371: Screenshot_20200515_104841.png
May 15 2020, 8:50 AM
F31819291: Screenshot_20200515_093003.png
May 15 2020, 7:31 AM
F31819289: Screenshot_20200515_092903.png
May 15 2020, 7:31 AM
F31819261: latency.png
May 15 2020, 7:21 AM
F31819250: latency.png
May 15 2020, 7:15 AM

Description

The upgrade happened yesterday (2020-05-13), and pc1007 was brought back as pc1 master at roughly 10:16.

https://grafana.wikimedia.org/d/000000273/mysql?orgId=1&var-dc=eqiad%20prometheus%2Fops&var-server=pc1007&var-port=9104&from=1589374049007&to=1589455278350

The dashboard shows that:

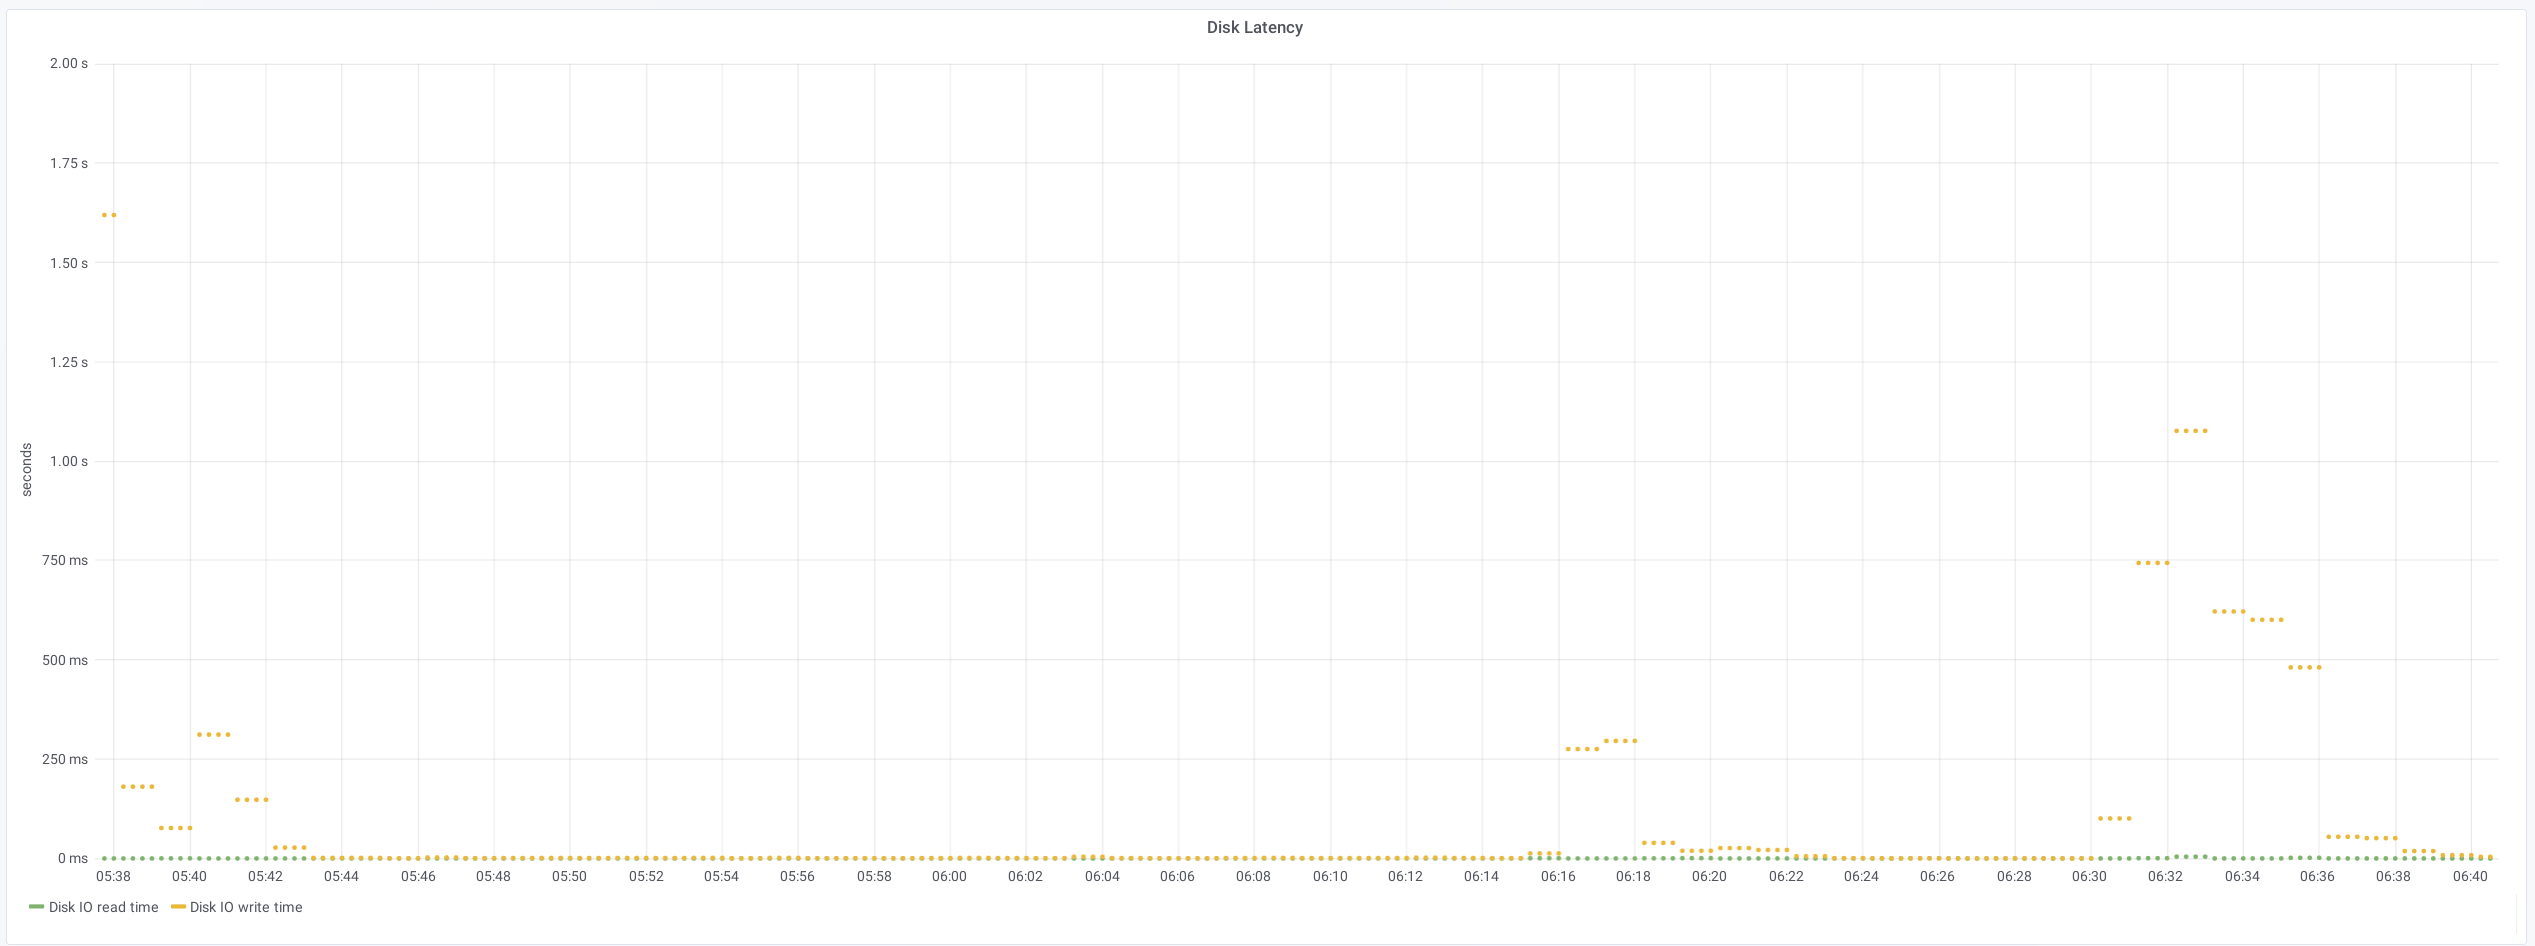
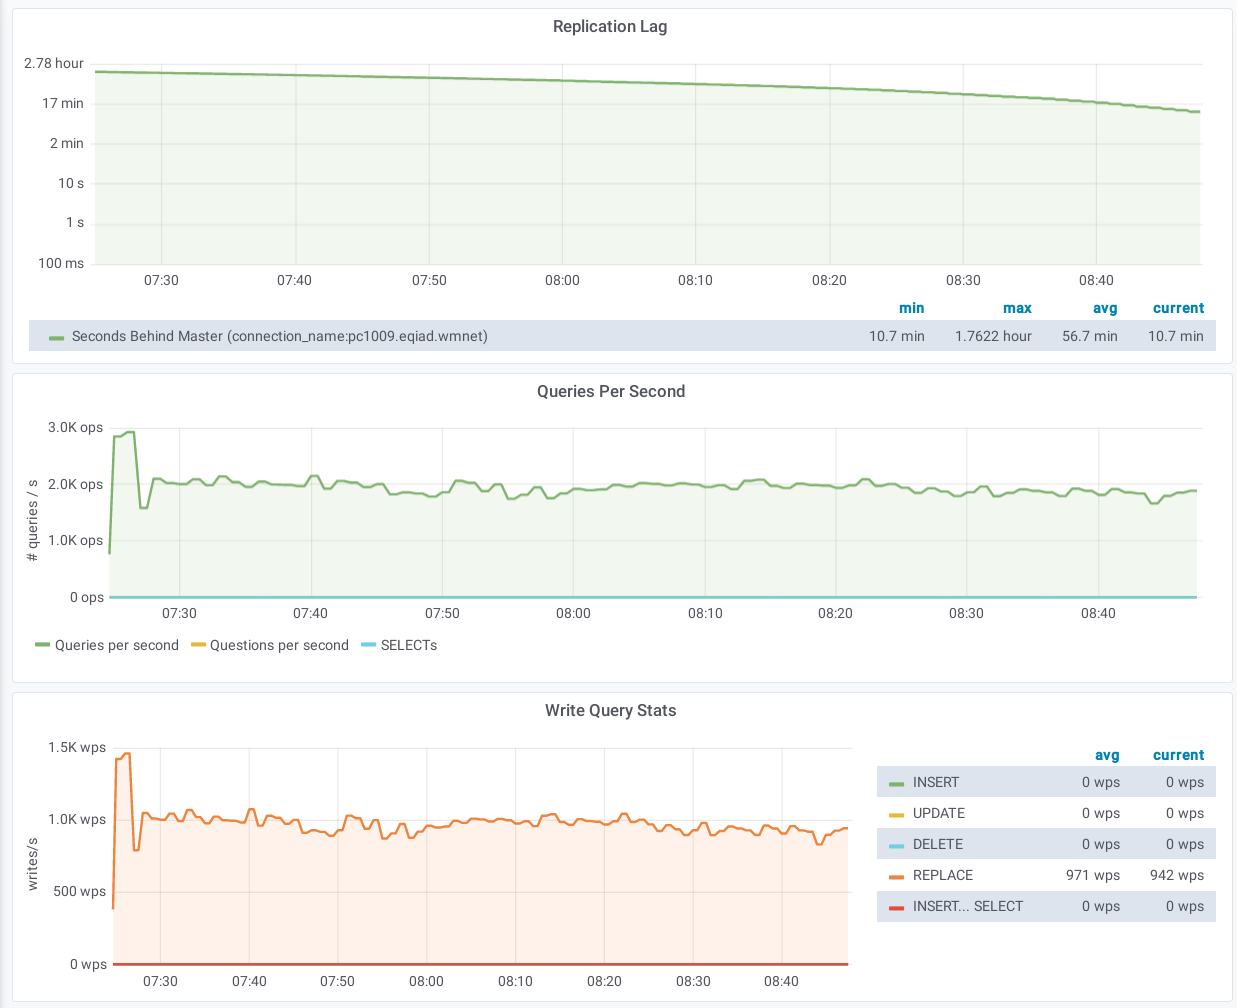
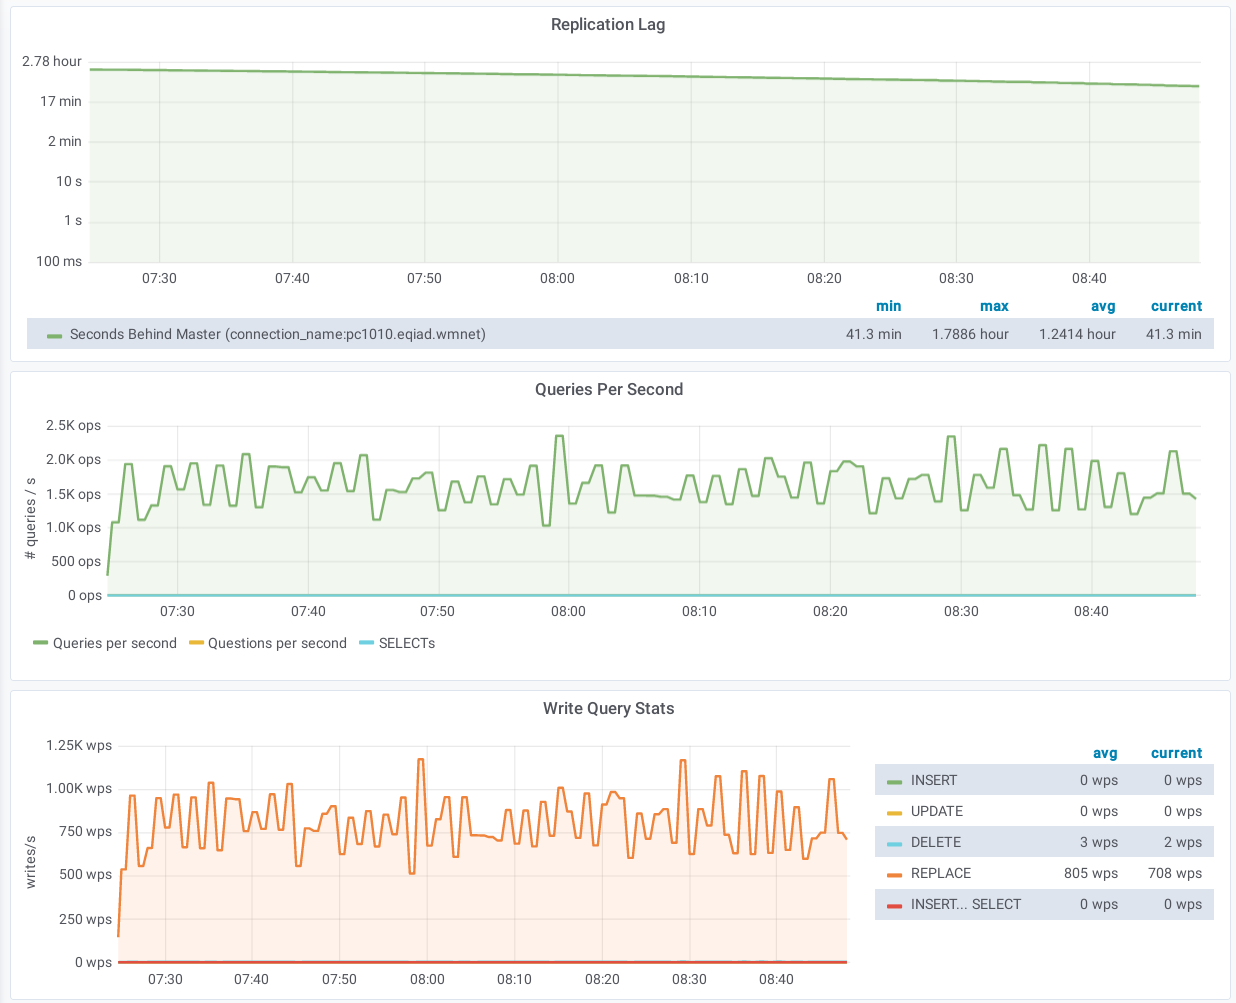
  • the monitoring queries latency has gone from sub-50ms to spiking frequently to 1-2s
  • the disk write latency has gone from about 4s to 12-20s

One thing we've noticed is that the io scheduler has changed between stretch and buster:

# buster
kormat@pc1007:~(0:0)$ cat /sys/block/sda/queue/scheduler 
[mq-deadline] none
# stretch
kormat@pc1009:~(0:0)$ cat /sys/block/sda/queue/scheduler
noop [deadline] cfq

Event Timeline

Mentioned in SAL (#wikimedia-operations) [2020-05-14T11:47:46Z] <kormat> changed iosched on pc1010 to none as a test T252761

Running a diff between the /sys/block/sda/queue dirs on stretch vs buster gives this:

--- stretch-pc1009	2020-05-14 14:18:21.659819745 +0200
+++ buster-pc1007	2020-05-14 14:18:21.655819689 +0200
@@ -1,2 +1,3 @@
 /sys/block/sda/queue/add_random:1
+/sys/block/sda/queue/chunk_sectors:0
 /sys/block/sda/queue/dax:0
@@ -6,4 +7,6 @@
 /sys/block/sda/queue/discard_zeroes_data:0
+/sys/block/sda/queue/fua:0
 /sys/block/sda/queue/hw_sector_size:512
-/sys/block/sda/queue/io_poll:0
+/sys/block/sda/queue/io_poll:1
+/sys/block/sda/queue/io_poll_delay:-1
 /sys/block/sda/queue/iosched/fifo_batch:16
@@ -15,2 +18,3 @@
 /sys/block/sda/queue/logical_block_size:512
+/sys/block/sda/queue/max_discard_segments:1
 /sys/block/sda/queue/max_hw_sectors_kb:256
@@ -22,3 +26,3 @@
 /sys/block/sda/queue/nomerges:0
-/sys/block/sda/queue/nr_requests:128
+/sys/block/sda/queue/nr_requests:256
 /sys/block/sda/queue/optimal_io_size:0
@@ -28,4 +32,7 @@
 /sys/block/sda/queue/rq_affinity:1
-/sys/block/sda/queue/scheduler:noop [deadline] cfq 
+/sys/block/sda/queue/scheduler:[mq-deadline] none
+/sys/block/sda/queue/wbt_lat_usec:75000
 /sys/block/sda/queue/write_cache:write through
 /sys/block/sda/queue/write_same_max_bytes:0
+/sys/block/sda/queue/write_zeroes_max_bytes:0
+/sys/block/sda/queue/zoned:none

Mentioned in SAL (#wikimedia-operations) [2020-05-14T12:22:18Z] <kormat> reverted iosched on pc1010 to mq-deadline T252761

Maybe this is metric's related?
The writes tests done on pc1008 showed the same performance as on the rest of pc once the raid was recreated at T247787#5978444
We've not seen any general latency (coming from the app layer) increase (which would be expected if we had real latency issues on the DBs), so maybe just the way it's been measured has changed?
On the other hand, if that's changed, we'd have seen it on all the other hosts we've migrated (core hosts).

From what I see we did io benchmarks. I would like to know if real sql queries are affected, maybe MariaDB, on memory-limited hosts with loose disk consistency (pc) now generate more io (but that is ok, if it means no extra client latency). I proposed to do some sysbench (sql) of write intensive queries and see if there is a difference between pc hosts with 10.1 and those with 10.4. If it is a metrics/db behaviour change but doesn't really impact queries, we can ignore it (resolve).

On the other hand, if that's changed, we'd have seen it on all the other hosts we've migrated (core hosts).

It is there on the graphs, however those are mostly memory only and with thousands of (smaller) fsyncs, so maybe it doesn't affect those as much?

From what I see we did io benchmarks. I would like to know if real sql queries are affected, maybe MariaDB, on memory-limited hosts with loose disk consistency (pc) now generate more io (but that is ok, if it means no extra client latency). I proposed to do some sysbench (sql) of write intensive queries and see if there is a difference between pc hosts with 10.1 and those with 10.4. If it is a metrics/db behaviour change but doesn't really impact queries, we can ignore it (resolve).

+1

I did a quick metric's format check and...:

root@pc1009:~# lsb_release -a
No LSB modules are available.
Distributor ID:	Debian
Description:	Debian GNU/Linux 9.12 (stretch)
Release:	9.12
Codename:	stretch
root@pc1009:~#  curl -s localhost:9100/metrics | grep write | grep time
# HELP node_disk_write_time_seconds_total This is the total number of seconds spent by all writes.
# TYPE node_disk_write_time_seconds_total counter
node_disk_write_time_seconds_total{device="dm-0"} 2.62941556e+06
node_disk_write_time_seconds_total{device="sda"} 4.278513832e+06


root@pc1007:~# lsb_release -a
No LSB modules are available.
Distributor ID:	Debian
Description:	Debian GNU/Linux 10 (buster)
Release:	10
Codename:	buster
root@pc1007:~# curl -s localhost:9100/metrics | grep write | grep time
# HELP node_disk_write_time_seconds_total This is the total number of seconds spent by all writes.
# TYPE node_disk_write_time_seconds_total counter
node_disk_write_time_seconds_total{device="dm-0"} 433862.88
node_disk_write_time_seconds_total{device="sda"} 904328.557

Quick test does show difference on performance on the disks but not on the latency:
pc1007:

root@pc1007:/srv/tmp# ioping  -D -i 0.5 . -c 100 -q -L -WWW


--- . (xfs /dev/dm-0) ioping statistics ---
99 requests completed in 56.9 ms, 24.8 MiB written, 1.74 k iops, 435.2 MiB/s
generated 100 requests in 49.5 s, 25 MiB, 2 iops, 517.1 KiB/s
min/avg/max/mdev = 122.9 us / 574.5 us / 15.4 ms / 1.90 ms

pc1009:

root@pc1009:/srv/tmp# ioping  -D -i 0.5 . -c 100 -q -L -WWW

--- . (xfs /dev/dm-0) ioping statistics ---
99 requests completed in 19.9 ms, 24.8 MiB written, 4.96 k iops, 1.21 GiB/s
generated 100 requests in 49.5 s, 25 MiB, 2 iops, 517.2 KiB/s
min/avg/max/mdev = 143.4 us / 201.4 us / 369.8 us / 29.6 us

On the other hand, pc2009 (Stretch) shows kinda the same result as Buster:

root@pc2009:/srv/tmp# ioping  -D -i 0.5 . -c 100 -q -L -WWW

--- . (xfs /dev/dm-0) ioping statistics ---
99 requests completed in 78.3 ms, 24.8 MiB written, 1.26 k iops, 316.1 MiB/s
generated 100 requests in 49.5 s, 25 MiB, 2 iops, 517.2 KiB/s
min/avg/max/mdev = 138.2 us / 790.8 us / 15.7 ms / 2.54 ms

So not sure how accurate this is.
Maybe the sysbench result can give us a better picture of how this is affecting mysql query latency itself (if it is really doing so)

Maybe the sysbench result can give us a better picture of how this is affecting mysql query latency itself (if it is really doing so)

Yeah, my hope it is a just a metrics/behavior change on MariaDB 10.4. But want to test it.

Mentioned in SAL (#wikimedia-operations) [2020-05-15T05:35:44Z] <jynus> stop replication on pc2009, pc2010 for benchmarking T252761

For memory-only read only traffic, regression seems to be only of 5%, which was around what we expected. Note pc1010 had a 13% average extra latency from client, so it is within the margin of error (test had to be done from network to prevent software version differences).

These are my findings:

average latency (ms)		percentile 95 latency (ms)		read requests per second		write requests per second	
VERSION	10.1	10.4	10.1	10.4	10.1	10.4	10.1	10.4
ro, low concurrency	5.23	5.83	5.65	6.38	21384.53	19195.52	0.00	0.00
ro	15.78	15.99	17.06	17.90	56782.46	56027.81	0.00	0.00
mixed rw	19.50	19.34	21.14	21.48	45943.38	46316.48	16408.35	16541.59
rw, high concurrency	4.54	3.48	7.07	4.93	0.00	0.00	141059.31	183871.83

root@cumin2001:~$ mysql.py -h pc2009 -e "SELECT @@version"
+-----------------+
| @@version       |
+-----------------+
| 10.1.43-MariaDB |
+-----------------+
root@cumin2001:~$ mysql.py -h pc2010 -e "SELECT @@version"  
+---------------------+
| @@version           |
+---------------------+
| 10.4.12-MariaDB-log |
+---------------------+

root@cumin2001:~$ ping pc2009.codfw.wmnet
PING pc2009.codfw.wmnet (10.192.32.10) 56(84) bytes of data.
64 bytes from pc2009.codfw.wmnet (10.192.32.10): icmp_seq=1 ttl=63 time=0.220 ms
64 bytes from pc2009.codfw.wmnet (10.192.32.10): icmp_seq=2 ttl=63 time=0.197 ms
64 bytes from pc2009.codfw.wmnet (10.192.32.10): icmp_seq=3 ttl=63 time=0.203 ms
64 bytes from pc2009.codfw.wmnet (10.192.32.10): icmp_seq=4 ttl=63 time=0.179 ms
64 bytes from pc2009.codfw.wmnet (10.192.32.10): icmp_seq=5 ttl=63 time=0.206 ms
64 bytes from pc2009.codfw.wmnet (10.192.32.10): icmp_seq=6 ttl=63 time=0.198 ms
64 bytes from pc2009.codfw.wmnet (10.192.32.10): icmp_seq=7 ttl=63 time=0.207 ms
64 bytes from pc2009.codfw.wmnet (10.192.32.10): icmp_seq=8 ttl=63 time=0.213 ms
^C64 bytes from pc2009.codfw.wmnet (10.192.32.10): icmp_seq=9 ttl=63 time=0.175 ms
^C
--- pc2009.codfw.wmnet ping statistics ---
9 packets transmitted, 9 received, 0% packet loss, time 8159ms
rtt min/avg/max/mdev = 0.175/0.199/0.220/0.022 ms
root@cumin2001:~$ ping pc2010.codfw.wmnet
PING pc2010.codfw.wmnet (10.192.48.14) 56(84) bytes of data.
64 bytes from pc2010.codfw.wmnet (10.192.48.14): icmp_seq=1 ttl=64 time=0.240 ms
64 bytes from pc2010.codfw.wmnet (10.192.48.14): icmp_seq=2 ttl=64 time=0.220 ms
64 bytes from pc2010.codfw.wmnet (10.192.48.14): icmp_seq=3 ttl=64 time=0.220 ms
64 bytes from pc2010.codfw.wmnet (10.192.48.14): icmp_seq=4 ttl=64 time=0.218 ms
64 bytes from pc2010.codfw.wmnet (10.192.48.14): icmp_seq=5 ttl=64 time=0.229 ms
64 bytes from pc2010.codfw.wmnet (10.192.48.14): icmp_seq=6 ttl=64 time=0.228 ms
64 bytes from pc2010.codfw.wmnet (10.192.48.14): icmp_seq=7 ttl=64 time=0.227 ms
64 bytes from pc2010.codfw.wmnet (10.192.48.14): icmp_seq=8 ttl=64 time=0.220 ms
^C
--- pc2010.codfw.wmnet ping statistics ---
8 packets transmitted, 8 received, 0% packet loss, time 7136ms
rtt min/avg/max/mdev = 0.218/0.225/0.240/0.012 ms

root@cumin2001:~$ sysbench --test=oltp --oltp-table-size=1000000 --mysql-host=pc2009.codfw.wmnet --mysql-db=test --mysql-user=root --mysql-password='x' --max-time=120 --oltp-read-only=on --max-requests=0 --num-threads=8 run      
sysbench 0.4.12:  multi-threaded system evaluation benchmark

No DB drivers specified, using mysql
Running the test with following options:
Number of threads: 8

Doing OLTP test.
Running mixed OLTP test
Doing read-only test
Using Special distribution (12 iterations,  1 pct of values are returned in 75 pct cases)
Using "BEGIN" for starting transactions
Using auto_inc on the id column
Threads started!
Time limit exceeded, exiting...
(last message repeated 7 times)
Done.

OLTP test statistics:
    queries performed:
        read:                            2566144
        write:                           0
        other:                           366592
        total:                           2932736
    transactions:                        183296 (1527.41 per sec.)
    deadlocks:                           0      (0.00 per sec.)
    read/write requests:                 2566144 (21383.74 per sec.)
    other operations:                    366592 (3054.82 per sec.)

Test execution summary:
    total time:                          120.0045s
    total number of events:              183296
    total time taken by event execution: 958.9527
    per-request statistics:
         min:                                  3.93ms
         avg:                                  5.23ms
         max:                                 42.66ms
         approx.  95 percentile:               5.65ms

Threads fairness:
    events (avg/stddev):           22912.0000/65.70
    execution time (avg/stddev):   119.8691/0.00

root@cumin2001:~$ sysbench --test=oltp --oltp-table-size=1000000 --mysql-host=pc2010.codfw.wmnet --mysql-db=test --mysql-user=root --mysql-password='x' --max-time=120 --oltp-read-only=on --max-requests=0 --num-threads=8 run  
sysbench 0.4.12:  multi-threaded system evaluation benchmark

No DB drivers specified, using mysql
Running the test with following options:
Number of threads: 8

Doing OLTP test.
Running mixed OLTP test
Doing read-only test
Using Special distribution (12 iterations,  1 pct of values are returned in 75 pct cases)
Using "BEGIN" for starting transactions
Using auto_inc on the id column
Threads started!
Time limit exceeded, exiting...
(last message repeated 7 times)
Done.

OLTP test statistics:
    queries performed:
        read:                            2303462
        write:                           0
        other:                           329066
        total:                           2632528
    transactions:                        164533 (1371.07 per sec.)
    deadlocks:                           0      (0.00 per sec.)
    read/write requests:                 2303462 (19194.93 per sec.)
    other operations:                    329066 (2742.13 per sec.)

Test execution summary:
    total time:                          120.0036s
    total number of events:              164533
    total time taken by event execution: 959.0468
    per-request statistics:
         min:                                  3.80ms
         avg:                                  5.83ms
         max:                                 18.33ms
         approx.  95 percentile:               6.38ms

Threads fairness:
    events (avg/stddev):           20566.6250/356.80
    execution time (avg/stddev):   119.8808/0.00

root@cumin2001:~$ sysbench --test=oltp --oltp-table-size=1000000 --mysql-host=pc2009.codfw.wmnet --mysql-db=test --mysql-user=root --mysql-password='x' --max-time=300 --oltp-read-only=on --max-requests=0 --num-threads=64 run    
sysbench 0.4.12:  multi-threaded system evaluation benchmark

No DB drivers specified, using mysql
Running the test with following options:
Number of threads: 64

Doing OLTP test.
Running mixed OLTP test
Doing read-only test
Using Special distribution (12 iterations,  1 pct of values are returned in 75 pct cases)
Using "BEGIN" for starting transactions
Using auto_inc on the id column
Threads started!
Time limit exceeded, exiting...
(last message repeated 63 times)
Done.

OLTP test statistics:
    queries performed:
        read:                            17034738
        write:                           0
        other:                           2433534
        total:                           19468272
    transactions:                        1216767 (4055.72 per sec.)
    deadlocks:                           0      (0.00 per sec.)
    read/write requests:                 17034738 (56780.05 per sec.)
    other operations:                    2433534 (8111.44 per sec.)

Test execution summary:
    total time:                          300.0127s
    total number of events:              1216767
    total time taken by event execution: 19195.0627
    per-request statistics:
         min:                                 11.45ms
         avg:                                 15.78ms
         max:                                 54.79ms
         approx.  95 percentile:              17.06ms

Threads fairness:
    events (avg/stddev):           19011.9844/72.16
    execution time (avg/stddev):   299.9229/0.00

root@cumin2001:~$ sysbench --test=oltp --oltp-table-size=1000000 --mysql-host=pc2010.codfw.wmnet --mysql-db=test --mysql-user=root --mysql-password='x' --max-time=300 --oltp-read-only=on --max-requests=0 --num-threads=64 run  
sysbench 0.4.12:  multi-threaded system evaluation benchmark

No DB drivers specified, using mysql
Running the test with following options:
Number of threads: 64

Doing OLTP test.
Running mixed OLTP test
Doing read-only test
Using Special distribution (12 iterations,  1 pct of values are returned in 75 pct cases)
Using "BEGIN" for starting transactions
Using auto_inc on the id column
Threads started!
Time limit exceeded, exiting...
(last message repeated 63 times)
Done.

OLTP test statistics:
    queries performed:
        read:                            16808344
        write:                           0
        other:                           2401192
        total:                           19209536
    transactions:                        1200596 (4001.82 per sec.)
    deadlocks:                           0      (0.00 per sec.)
    read/write requests:                 16808344 (56025.43 per sec.)
    other operations:                    2401192 (8003.63 per sec.)

Test execution summary:
    total time:                          300.0127s
    total number of events:              1200596
    total time taken by event execution: 19195.1629
    per-request statistics:
         min:                                  9.83ms
         avg:                                 15.99ms
         max:                                222.59ms
         approx.  95 percentile:              17.90ms

Threads fairness:
    events (avg/stddev):           18759.3125/92.86
    execution time (avg/stddev):   299.9244/0.00

root@cumin2001:~$ sysbench --test=oltp --oltp-table-size=1000000 --mysql-host=pc2009.codfw.wmnet --mysql-db=test --mysql-user=root --mysql-password='x' --max-time=300 --oltp-read-only=off --max-requests=0 --num-threads=64 run  
sysbench 0.4.12:  multi-threaded system evaluation benchmark

No DB drivers specified, using mysql
Running the test with following options:
Number of threads: 64

Doing OLTP test.
Running mixed OLTP test
Using Special distribution (12 iterations,  1 pct of values are returned in 75 pct cases)
Using "BEGIN" for starting transactions
Using auto_inc on the id column
Threads started!
Time limit exceeded, exiting...
(last message repeated 63 times)
Done.

OLTP test statistics:
    queries performed:
        read:                            13783014
        write:                           4922505
        other:                           1969002
        total:                           20674521
    transactions:                        984501 (3281.51 per sec.)
    deadlocks:                           0      (0.00 per sec.)
    read/write requests:                 18705519 (62348.68 per sec.)
    other operations:                    1969002 (6563.02 per sec.)

Test execution summary:
    total time:                          300.0147s
    total number of events:              984501
    total time taken by event execution: 19195.3572
    per-request statistics:
         min:                                  9.36ms
         avg:                                 19.50ms
         max:                                 85.39ms
         approx.  95 percentile:              21.14ms

Threads fairness:
    events (avg/stddev):           15382.8281/124.35
    execution time (avg/stddev):   299.9275/0.00

root@cumin2001:~$ sysbench --test=oltp --oltp-table-size=1000000 --mysql-host=pc2010.codfw.wmnet --mysql-db=test --mysql-user=root --mysql-password='x' --max-time=300 --oltp-read-only=off --max-requests=0 --num-threads=64 run  
sysbench 0.4.12:  multi-threaded system evaluation benchmark

No DB drivers specified, using mysql
Running the test with following options:
Number of threads: 64

Doing OLTP test.
Running mixed OLTP test
Using Special distribution (12 iterations,  1 pct of values are returned in 75 pct cases)
Using "BEGIN" for starting transactions
Using auto_inc on the id column
Threads started!
Time limit exceeded, exiting...
(last message repeated 63 times)
Done.

OLTP test statistics:
    queries performed:
        read:                            13894944
        write:                           4962477
        other:                           1984991
        total:                           20842412
    transactions:                        992495 (3308.15 per sec.)
    deadlocks:                           1      (0.00 per sec.)
    read/write requests:                 18857421 (62854.96 per sec.)
    other operations:                    1984991 (6616.31 per sec.)

Test execution summary:
    total time:                          300.0149s
    total number of events:              992495
    total time taken by event execution: 19195.2116
    per-request statistics:
         min:                                 11.25ms
         avg:                                 19.34ms
         max:                                 58.22ms
         approx.  95 percentile:              21.48ms

Threads fairness:
    events (avg/stddev):           15507.7344/66.83
    execution time (avg/stddev):   299.9252/0.00

root@cumin2001:~$ sysbench --test=oltp --oltp-table-size=1000000 --mysql-host=pc2009.codfw.wmnet --mysql-db=test --mysql-user=root --mysql-password='x' --max-time=300 --oltp-read-only=off --oltp-point-selects=0 --oltp-simple-ranges=0 --oltp-sum-ranges=0 --oltp-order-ranges=0 --oltp-distinct-ranges=0 --oltp-index-updates=1 --oltp-non-index-updates=1 --max-requests=0 --num-threads=128 run
sysbench 0.4.12:  multi-threaded system evaluation benchmark

No DB drivers specified, using mysql
Running the test with following options:
Number of threads: 128

Doing OLTP test.
Running mixed OLTP test
Using Special distribution (12 iterations,  1 pct of values are returned in 75 pct cases)
Using "BEGIN" for starting transactions
Using auto_inc on the id column
Threads started!
Time limit exceeded, exiting...
(last message repeated 127 times)
Done.

OLTP test statistics:
    queries performed:
        read:                            0
        write:                           42317792
        other:                           16927117
        total:                           59244909
    transactions:                        8463557 (28211.59 per sec.)
    deadlocks:                           3      (0.01 per sec.)
    read/write requests:                 42317792 (141057.97 per sec.)
    other operations:                    16927117 (56423.19 per sec.)

Test execution summary:
    total time:                          300.0028s
    total number of events:              8463557
    total time taken by event execution: 38386.3118
    per-request statistics:
         min:                                  1.07ms
         avg:                                  4.54ms
         max:                                352.58ms
         approx.  95 percentile:               7.07ms

Threads fairness:
    events (avg/stddev):           66121.5391/2614.81
    execution time (avg/stddev):   299.8931/0.00

root@cumin2001:~$ sysbench --test=oltp --oltp-table-size=1000000 --mysql-host=pc2010.codfw.wmnet --mysql-db=test --mysql-user=root --mysql-password='x' --max-time=300 --oltp-read-only=off --oltp-point-selects=0 --oltp-simple-ranges=0 --oltp-sum-ranges=0 --oltp-order-ranges=0 --oltp-distinct-ranges=0 --oltp-index-updates=1 --oltp-non-index-updates=1 --max-requests=0 --num-threads=128 run  
sysbench 0.4.12:  multi-threaded system evaluation benchmark

No DB drivers specified, using mysql
Running the test with following options:
Number of threads: 128

Doing OLTP test.
Running mixed OLTP test
Using Special distribution (12 iterations,  1 pct of values are returned in 75 pct cases)
Using "BEGIN" for starting transactions
Using auto_inc on the id column
Threads started!
Time limit exceeded, exiting...
(last message repeated 127 times)
Done.

OLTP test statistics:
    queries performed:
        read:                            0
        write:                           55161550
        other:                           22064620
        total:                           77226170
    transactions:                        11032306 (36774.02 per sec.)
    deadlocks:                           8      (0.03 per sec.)
    read/write requests:                 55161550 (183870.18 per sec.)
    other operations:                    22064620 (73548.07 per sec.)

Test execution summary:
    total time:                          300.0027s
    total number of events:              11032306
    total time taken by event execution: 38382.5818
    per-request statistics:
         min:                                  0.98ms
         avg:                                  3.48ms
         max:                                442.89ms
         approx.  95 percentile:               4.93ms

Threads fairness:
    events (avg/stddev):           86189.8906/837.47
    execution time (avg/stddev):   299.8639/0.00

latency.png (1×1 px, 84 KB)

There is a difference in replication "performance" (pc1010 is spikier and lower):

Screenshot_20200515_104816.png (1×1 px, 88 KB)

Screenshot_20200515_104841.png (1×1 px, 114 KB)

But the comparison is not fair for the 10.4 host, as it replicates from an intermediate master and thus it replicates serially due to using a conservative replication config.

Disk latency mentrics are indeed higher, but client sql latency is significantly lower.

Makes sense that the SQL client isn't seeing anything, certainly 20 seconds of latency for writes wouldn't have gone unnoticed, we'd have had errors all over the place for pc1008 (which is the one that has been using 10.4 for weeks).
We already saw those issues when it had disk performance problems, which increased the latency of MW a lot and we end up having an emergency.
I don't think what grafana shows as 20 seconds of latency is real.

TODO: investigate if changing the version and config of prometheus-mysql-exporter has had a major impact on performance.

I have done a quick check and looks like this is what prometheus executes:

	158534 Connect	prometheus@localhost as anonymous on
		158535 Connect	prometheus@localhost as anonymous on
		158535 Query	SET lock_wait_timeout=2
		158534 Query	SET lock_wait_timeout=2
		158535 Query	SHOW GLOBAL VARIABLES
		158534 Query	SHOW GLOBAL VARIABLES
		158534 Query	SHOW ALL SLAVES STATUS
		158535 Query	SHOW ALL SLAVES STATUS
		158534 Query	SHOW GLOBAL STATUS
		158535 Query	SELECT COALESCE(command,''),COALESCE(state,''),count(*),sum(time)
		  FROM information_schema.processlist
		  WHERE ID != connection_id()
		    AND TIME >= 0
		  GROUP BY command,state
		  ORDER BY null
		158535 Query	SHOW GLOBAL STATUS
		158534 Query	SELECT COALESCE(command,''),COALESCE(state,''),count(*),sum(time)
		  FROM information_schema.processlist
		  WHERE ID != connection_id()
		    AND TIME >= 0
		  GROUP BY command,state
		  ORDER BY null
		158534 Quit
		158535 Quit

There might be more, I just did a quick check on the host itself.

Another interesting test to see what happens to the disk latency and query latency would be on pc2007:

  • stop slave - leave it for a few hours (pt-heartbeat will be running unless we kill it)
  • stop mysql - leave it for a few hours.

I don't know if it's relevant, but mariadb changed the default value of lock_wait_timeout in 10.2: https://mariadb.com/docs/reference/es/system-variables/lock_wait_timeout/

pc2007 (buster/10.4)

Variable_name: lock_wait_timeout
        Value: 86400

pc2009 (stretch/10.1):

Variable_name: lock_wait_timeout
        Value: 31536000

That's probably not an issue for this troubleshooting.

As a followup of T161296 we need to research the changes on buster to understand new metrics making scrapping slower, plus if we should enable or disable more metrics for buster.

I would like to proceed with this task next week and finish moving parsercache to 10.4 (we can create an specific task to follow up and investigate why the exporter is reporting such high latencies which do not correspond to the real performance these hosts are having for real)

jcrespo renamed this task from Degraded performance on parsercache with buster/mariadb upgrade to Research changes on prometheus-mysql-exporter after buster/mariadb upgrade.Jun 3 2020, 2:54 PM
jcrespo renamed this task from Research changes on prometheus-mysql-exporter after buster/mariadb upgrade to Research changes on prometheus-mysqld-exporter after buster/mariadb upgrade.
Kormat triaged this task as Medium priority.Jul 27 2020, 1:46 PM

A workaround was created because after prometheus upgrade for buster, prometheus-exporter demanded a password for its mysql user. This was reported to debian at: https://bugs.debian.org/cgi-bin/bugreport.cgi?bug=953040

In theory this has been fixed on the latest packages- we have to test it and remove the workaround if it works again with an empty password (using socket based auth).

Update to my last comment, the previous Debian ticket was marked as resolved, the fix is to change how we authenticate and doing it like this, DATA_SOURCE_NAME="prometheus@unix(/run/mysqld/mysqld.sock)" according to the patch (but I have not tested it).

This was the original workaround:
https://gerrit.wikimedia.org/r/c/operations/puppet/+/576398/4/modules/prometheus/manifests/mysqld_exporter/instance.pp

Another thought here - if we want the exporter to be automatically restarted if mysqld is restarted, then we should be able to get systemd to do this for us.

I think we want Requisite= and After= dependencies declared (presumably using an override .conf file) on the mysqld service.

https://www.freedesktop.org/software/systemd/man/systemd.unit.html documents the various possibilities, but it's not the clearest ever.

Another thought here - if we want the exporter to be automatically restarted if mysqld is restarted, then we should be able to get systemd to do this for us.

I think we want Requisite= and After= dependencies declared (presumably using an override .conf file) on the mysqld service.

That'd be very nice to have!

Kormat renamed this task from Research changes on prometheus-mysqld-exporter after buster/mariadb upgrade to Research performance changes on prometheus-mysqld-exporter after buster/mariadb upgrade.Aug 9 2021, 4:29 PM
Kormat updated the task description. (Show Details)

I've split the systemd bits into a separate task - T289488

I am going to close this as fixed. The latency on all parsercache hosts are around 2 seconds. I don't think this latency was real anyways, as 10-20 seconds would've created issues on MW level.
We don't really know what caused it and what actually fixed it, but we've installed new pc hosts, with faster disks...