During T247788 we observed pc1008 was performing worse than the rest of the hosts, with having around 4 or 5 times more connections than the rest of the hosts (pc1007, pc1009).
We pooled pc1010 instead of pc1008 and pc1010 had more or less the same amount of connections than pc1007 and pc1009.
Something might be different within pc1008
Description
Description
Details
Details
Customize query in gerrit
Related Objects
Related Objects
Event Timeline
Comment Actions
MySQL config is the same:
12 config differences
Variable                  pc1008                    pc1007
========================= ========================= =========================
general_log_file          pc1008.log                pc1007.log
gtid_binlog_pos           0-171970580-40563008990   0-171966644-40587916466
gtid_binlog_state         0-171978926-3609321205... 0-171978926-2744376873...
gtid_current_pos          0-171970580-40563008990   0-171966644-40587916466
gtid_slave_pos            0-171978926-36093212054   0-171978926-27443768734
hostname                  pc1008                    pc1007
log_bin_basename          /srv/sqldata-cache/pc1... /srv/sqldata-cache/pc1...
log_bin_index             /srv/sqldata-cache/pc1... /srv/sqldata-cache/pc1...
pid_file                  /srv/sqldata-cache/pc1... /srv/sqldata-cache/pc1...
server_id                 171970580                 171966644
slow_query_log_file       pc1008-slow.log           pc1007-slow.log
wsrep_node_name           pc1008                    pc1007
Comment Actions
Raid configuration is the same (included the cache policy):
--- pc1007.raid	2020-03-17 06:45:54.531009723 +0000
+++ pc1008.raid	2020-03-17 06:45:34.174998635 +0000
@@ -34,7 +34,7 @@
 Drive's position: DiskGroup: 0, Span: 0, Arm: 0
 Enclosure position: 1
 Device Id: 0
 Sequence Number: 2
 Media Error Count: 0
 Other Error Count: 0
@@ -54,7 +54,7 @@
 Successful diagnostics completion on :  N/A
 SAS Address(0): 0x4433221106000000
 Connected Port Number: 2(path0)
 FDE Capable: Not Capable
 FDE Enable: Disable
 Secured: Unsecured
@@ -64,7 +64,7 @@
 Device Speed: 6.0Gb/s
 Link Speed: 6.0Gb/s
 Media Type: Solid State Device
-Drive Temperature :33C (91.40 F)
+Drive Temperature :25C (77.00 F)
 PI Eligibility:  No
 Drive is formatted for PI information:  No
 PI: No PI
@@ -83,7 +83,7 @@
 Drive's position: DiskGroup: 0, Span: 0, Arm: 1
 Enclosure position: 1
 Device Id: 1
 Sequence Number: 2
 Media Error Count: 0
 Other Error Count: 0
@@ -103,7 +103,7 @@
 Successful diagnostics completion on :  N/A
 SAS Address(0): 0x4433221107000000
 Connected Port Number: 3(path0)
 FDE Capable: Not Capable
 FDE Enable: Disable
 Secured: Unsecured
@@ -113,7 +113,7 @@
 Device Speed: 6.0Gb/s
 Link Speed: 6.0Gb/s
 Media Type: Solid State Device
-Drive Temperature :32C (89.60 F)
+Drive Temperature :25C (77.00 F)
 PI Eligibility:  No
 Drive is formatted for PI information:  No
 PI: No PI
@@ -132,7 +132,7 @@
 Drive's position: DiskGroup: 0, Span: 0, Arm: 2
 Enclosure position: 1
 Device Id: 2
 Sequence Number: 2
 Media Error Count: 0
 Other Error Count: 0
@@ -152,7 +152,7 @@
 Successful diagnostics completion on :  N/A
 SAS Address(0): 0x4433221105000000
 Connected Port Number: 1(path0)
 FDE Capable: Not Capable
 FDE Enable: Disable
 Secured: Unsecured
@@ -162,7 +162,7 @@
 Device Speed: 6.0Gb/s
 Link Speed: 6.0Gb/s
 Media Type: Solid State Device
-Drive Temperature :30C (86.00 F)
+Drive Temperature :24C (75.20 F)
 PI Eligibility:  No
 Drive is formatted for PI information:  No
 PI: No PI
@@ -181,7 +181,7 @@
 Drive's position: DiskGroup: 0, Span: 0, Arm: 3
 Enclosure position: 1
 Device Id: 3
 Sequence Number: 2
 Media Error Count: 0
 Other Error Count: 0
@@ -201,7 +201,7 @@
 Successful diagnostics completion on :  N/A
 SAS Address(0): 0x4433221104000000
 Connected Port Number: 0(path0)
 FDE Capable: Not Capable
 FDE Enable: Disable
 Secured: Unsecured
@@ -211,7 +211,7 @@
 Device Speed: 6.0Gb/s
 Link Speed: 6.0Gb/s
 Media Type: Solid State Device
-Drive Temperature :29C (84.20 F)
+Drive Temperature :24C (75.20 F)
 PI Eligibility:  No
 Drive is formatted for PI information:  No
 PI: No PI
No disks with SMART alert:
root@pc1008:~# megacli -LdPdInfo -a0 | grep alert
Drive has flagged a S.M.A.R.T alert : No
Drive has flagged a S.M.A.R.T alert : No
Drive has flagged a S.M.A.R.T alert : No
Drive has flagged a S.M.A.R.T alert : No
Same kernel:
4 hosts will be targeted:
pc[1007-1010].eqiad.wmnet
Confirm to continue [y/n]? y
===== NODE GROUP =====
(4) pc[1007-1010].eqiad.wmnet
----- OUTPUT of 'uname -r' -----
4.9.0-11-amd64
Same uptime pretty much:
===== NODE GROUP =====
(1) pc1008.eqiad.wmnet
----- OUTPUT of 'uptime' -----
 06:52:10 up 89 days, 11 min,  2 users,  load average: 0.00, 0.00, 0.00
===== NODE GROUP =====
(1) pc1009.eqiad.wmnet
----- OUTPUT of 'uptime' -----
 06:52:10 up 88 days, 42 min,  0 users,  load average: 2.28, 2.05, 2.06
===== NODE GROUP =====
(1) pc1007.eqiad.wmnet
----- OUTPUT of 'uptime' -----
 06:52:10 up 90 days, 30 min,  1 user,  load average: 2.03, 2.22, 2.17
===== NODE GROUP =====
(1) pc1010.eqiad.wmnet
----- OUTPUT of 'uptime' -----
 06:52:10 up 95 days, 22:45,  2 users,  load average: 5.17, 4.44, 3.99
Same version:
4 hosts will be targeted:
pc[1007-1010].eqiad.wmnet
Confirm to continue [y/n]? y
===== NODE GROUP =====
(4) pc[1007-1010].eqiad.wmnet
----- OUTPUT of 'mysql -e "select @@version"' -----
@@version
10.1.43-MariaDB
================
No HW alerts for pc1008, these are the latest entries, quite old already:
-------------------------------------------------------------------------------
Record:      16
Date/Time:   10/31/2019 11:57:43
Source:      system
Severity:    Critical
Description: The power input for power supply 2 is lost.
-------------------------------------------------------------------------------
Record:      17
Date/Time:   10/31/2019 11:57:44
Source:      system
Severity:    Critical
Description: Power supply redundancy is lost.
-------------------------------------------------------------------------------
Record:      18
Date/Time:   10/31/2019 11:59:38
Source:      system
Severity:    Ok
Description: The input power for power supply 2 has been restored.
-------------------------------------------------------------------------------
Record:      19
Date/Time:   10/31/2019 11:59:39
Source:      system
Severity:    Ok
Description: The power supplies are redundant.
-------------------------------------------------------------------------------
Comment Actions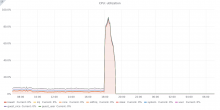
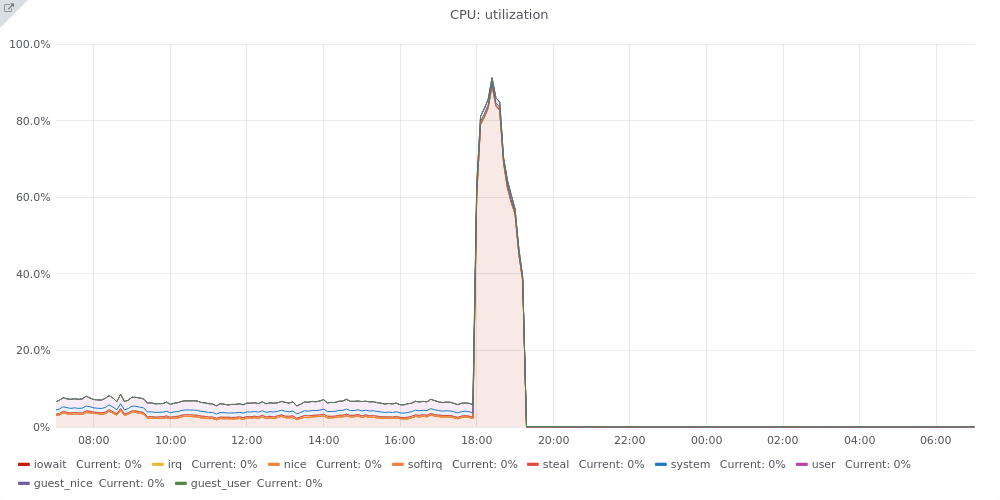
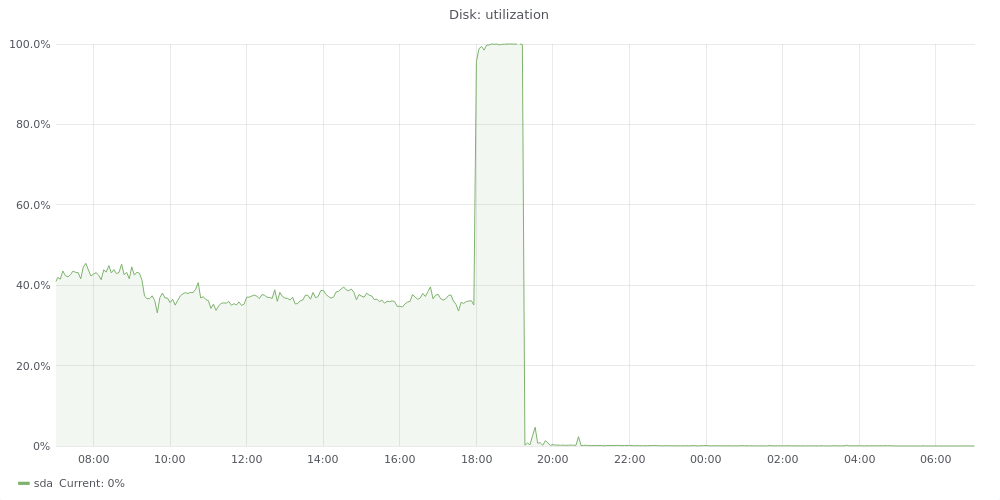
From what I can see on the graphs, none of the hosts reached disk or CPU saturation, but pc1008 did:
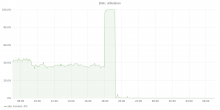
This host seems to be having memory saturation for a few days, while the others do not show this behaviour:
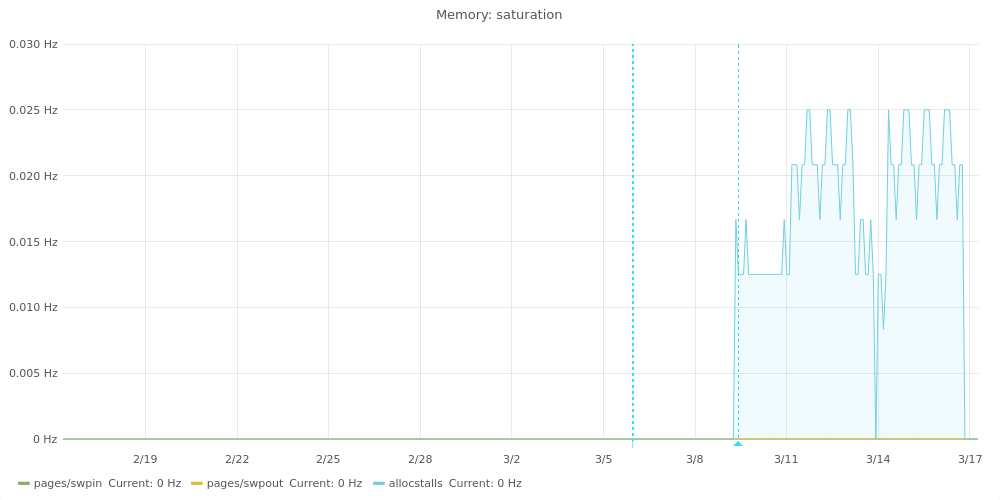
Memory DIMMs do not show any alert and the number of present RAM on the host is correct. Same goes for the amount and speed of CPUs.
Comment Actions
I don't see any obvious issues on the host itself or its database itself.
Ideas:
- Upgrade to buster + 10.4 and start testing it on parsercache
- Reimage on stretch and 10.1 (destroying its data), make the host replicate from pc1010 and after a few days, pool it back.
- Just do a full-upgrade (get onto 10.1.44), reboot and place the host back
- Upgrade to 10.1.44 and rebuild all the tables with an ALTER and pool it back
I think I would prefer option #1 or #2
Thoughts?
Comment Actions
@jcrespo has suggested to do a disk performance testing just in case there's some sort of performance degradation not revealed by HW logs or similar. So I am going to work on that before reimaging.
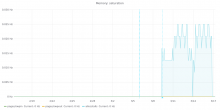
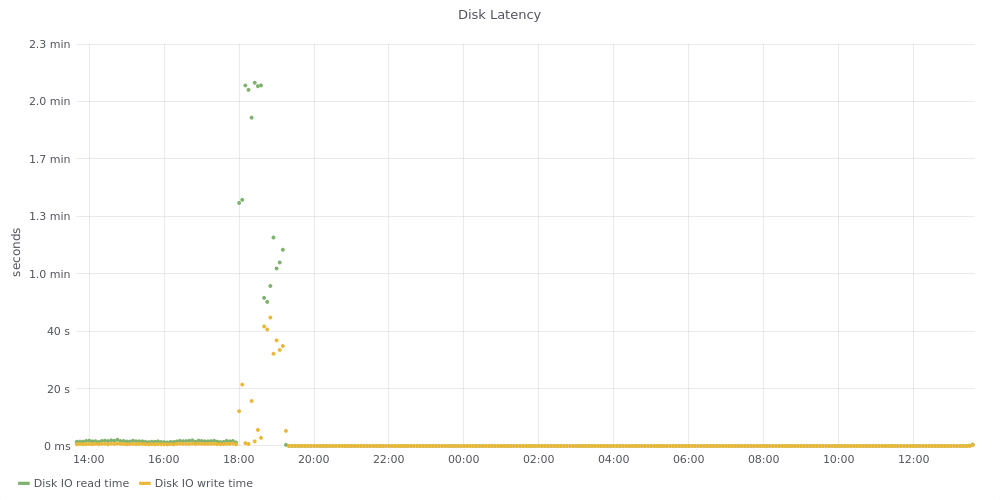
The host's disk read latency sky rocketed during the issues, so it might indeed have some underlying issue:
https://grafana.wikimedia.org/d/000000273/mysql?from=1584366221698&to=1584407142161&var-dc=eqiad%20prometheus%2Fops&var-server=pc1008&var-port=9104&orgId=1
Comment Actions
So from some tests, it looks like that pc1008's disk do perform worse for some reason:
Random reads pc1007 vs pc1008:
fio --name=randread --rw=randread --direct=1 --ioengine=libaio --bs=8k --numjobs=16 --size=1G --runtime=600 --group_reporting
pc1007
read : io=16384MB, bw=498743KB/s, iops=62342, runt= 33639msec
pc1008
read : io=16384MB, bw=289168KB/s, iops=36145, runt= 58019msec
pc1008 is doing half the IOPS, and pc1008 at the moment has 0 load (it is not replicating and not having reads).
Random writes pc1007 vs pc1008:
fio --name=randwrite --rw=randwrite --direct=1 --ioengine=libaio --bs=64k --numjobs=8 --size=512m --runtime=600 --group_reporting
pc1007
write: io=4096.0MB, bw=221476KB/s, iops=3460, runt= 18938msec
pc1008
write: io=4096.0MB, bw=57018KB/s, iops=890, runt= 73561msec
The writes performance is quite different as well, again, pc1007 is serving production traffic and pc1008 isn't.
Random writes/reads pc1007 vs pc1008:
pc1007
read : io=7369.2MB, bw=255896KB/s, iops=15993, runt= 29488msec
write: io=842736KB, bw=28579KB/s, iops=1786, runt= 29488msec
pc1008
read : io=7369.2MB, bw=98398KB/s, iops=6149, runt= 76687msec
write: io=842736KB, bw=10989KB/s, iops=686, runt= 76687msec
Pretty big difference here as well.
For the record, I ran echo 3 > /proc/sys/vm/drop_caches before each test.
Other basic performance tests with hdparm also reveal differences:
pc1007: Timing buffered disk reads: 4280 MB in  3.01 seconds = 1421.39 MB/sec
pc1008:  Timing buffered disk reads: 2720 MB in  3.00 seconds = 906.36 MB/sec
Not sure what can be causing this, maybe bad RAID controller?
All the disks seem fine:
root@pc1008:/srv/tmp# megacli -LdPdInfo -a0 | grep -i count
Media Error Count: 0
Other Error Count: 0
Predictive Failure Count: 0
Shield Counter: 0
Media Error Count: 0
Other Error Count: 0
Predictive Failure Count: 0
Shield Counter: 0
Media Error Count: 0
Other Error Count: 0
Predictive Failure Count: 0
Shield Counter: 0
Media Error Count: 0
Other Error Count: 0
Predictive Failure Count: 0
Shield Counter: 0
And everything on a controller level looks good:
root@pc1008:~# megacli -ShowSummary -aAll

System
	Operating System:  Linux version 4.9.0-11-amd64
	Driver Version: 07.700.00.00-rc1
	CLI Version: 8.07.14

Hardware
        Controller
                 ProductName       : PERC H730P Adapter(Bus 0, Dev 0)
                 SAS Address       : 5d0946609064bd00
                 FW Package Version: 25.5.5.0005
                 Status            : Optimal
        BBU
                 BBU Type          : BBU
                 Status            : Healthy
        Enclosure
                 Product Id        : BP14G+
                 Type              : SES
                 Status            : OK

        PD
                Connector          : 00<Internal><Encl Pos 1 >: Slot 0
                Vendor Id          : ATA
                Product Id         : THNSF81D60CSE
                State              : Online
                Disk Type          : SATA,Solid State Device
                Capacity           : 1.454 TB
                Power State        : Active

                Connector          : 00<Internal><Encl Pos 1 >: Slot 1
                Vendor Id          : ATA
                Product Id         : THNSF81D60CSE
                State              : Online
                Disk Type          : SATA,Solid State Device
                Capacity           : 1.454 TB
                Power State        : Active

                Connector          : 00<Internal><Encl Pos 1 >: Slot 2
                Vendor Id          : ATA
                Product Id         : THNSF81D60CSE
                State              : Online
                Disk Type          : SATA,Solid State Device
                Capacity           : 1.454 TB
                Power State        : Active

                Connector          : 00<Internal><Encl Pos 1 >: Slot 3
                Vendor Id          : ATA
                Product Id         : THNSF81D60CSE
                State              : Online
                Disk Type          : SATA,Solid State Device
                Capacity           : 1.454 TB
                Power State        : Active

Storage

       Virtual Drives
                Virtual drive      : Target Id 0 ,VD name
                Size               : 4.364 TB
                State              : Optimal
                RAID Level         : 5
Last controller's logs:
seqNum: 0x000004c2
Time: Tue Jan 14 01:29:55 2020

Code: 0x000000a3
Class: 0
Locale: 0x08
Event Description: Current capacity of the battery is above threshold
Event Data:
===========
None


seqNum: 0x000004c3
Time: Tue Jan 14 01:29:55 2020

Code: 0x00000098
Class: 0
Locale: 0x08
Event Description: Battery relearn in progress
Event Data:
===========
None


seqNum: 0x000004c4
Time: Tue Jan 14 02:06:45 2020

Code: 0x00000093
Class: 0
Locale: 0x08
Event Description: Battery started charging
Event Data:
===========
None


seqNum: 0x000004c5
Time: Tue Jan 14 02:55:30 2020

Code: 0x000000f2
Class: 0
Locale: 0x08
Event Description: Battery charge complete
Event Data:
===========
None
Maybe we should destroy and recreate the RAID and reimage the host?
@wiki_willy should we contact Dell to see if we can get a new RAID controller maybe even? This host is under warranty
Comment Actions
Change 580333 had a related patch set uploaded (by Marostegui; owner: Marostegui):
[operations/puppet@production] pc1008: Disable notifications
Comment Actions
Change 580333 merged by Marostegui:
[operations/puppet@production] pc1008: Disable notifications
Comment Actions
Mentioned in SAL (#wikimedia-operations) [2020-03-17T14:23:59Z] <marostegui> Stop mysql and restart pc1008 T247787
Comment Actions
Hi @Marostegui - can you create a dc-ops task for the raid controller replacement? We'll have to pull some logs to send over to Dell for the RMA. Thanks, Willy
Comment Actions
@wiki_willy keep in mind that I haven't been able to find any logs that shows a RAID controller malfunction unfortunately, it is a guess. All the numbers I have been able to put together are at T247787#5975506, which shows dramatic performance results compared to the other hosts (which were bought together).
Let me know if you still want me to create that specific task
Thank you
Comment Actions
Hi @Marostegui - we could try RMA'ing it (tho Dell will probably give us a hard time), if all other possibilities have been exhausted. Just let me know how you'd like to proceed, and we can have @Jclark-ctr take a look if needed. Thanks, Willy
Comment Actions
Maybe we can just:
- Destroy de RAID and recreate it again (I would probably need either @Jclark-ctr or @Cmjohnson to do it (I think it can be done remotely, but I always have high latencies on the idrac and I am unable to create it myself from the management iface).
Do you want me to create an specific task for the RAID recreation with its specifics (level, stripe size...)? Once it is recreated, I can reimage the host myself
- We can run the performance checks again
- If it shows that poor performance, try to talk to Dell and take it from there.
Does that sound good?
Comment Actions
Sure, that works for me @Marostegui . Feel free to shoot open a dc-ops task and assign to @Jclark-ctr . Thanks, Willy
Comment Actions
Mentioned in SAL (#wikimedia-operations) [2020-03-18T06:31:39Z] <marostegui> Reboot pc1008 to try to get its RAID redone - T247787
Comment Actions
Change 580697 had a related patch set uploaded (by Marostegui; owner: Marostegui):
[operations/puppet@production] install_server: Reimage pc1008
Comment Actions
I think I have managed to do it myself this time, as the idrac was fast enough and usable. If I need further help I will create that task. Thanks!
Comment Actions
Change 580697 merged by Marostegui:
[operations/puppet@production] install_server: Reimage pc1008
Comment Actions
Script wmf-auto-reimage was launched by marostegui on cumin1001.eqiad.wmnet for hosts:
['pc1008.eqiad.wmnet']
The log can be found in /var/log/wmf-auto-reimage/202003180654_marostegui_208849.log.
Comment Actions
Mentioned in SAL (#wikimedia-operations) [2020-03-18T08:44:15Z] <marostegui> Start replication pc1008 from pc1010 to get some of the new keys so it is not fully empty - T247787
Comment Actions
@wiki_willy I was able to destroy and recreate the RAID myself. So no further needs are expected at this point.
While the raid was still initializing, I ran the tests and I noticed that performance was now similar to pc1007 (from T247787#5975506):
fio --name=randread --rw=randread --direct=1 --ioengine=libaio --bs=8k --numjobs=16 --size=1G --runtime=600 --group_reporting
  read : io=16384MB, bw=483967KB/s, iops=60495, runt= 34666msec
fio --name=randwrite --rw=randwrite --direct=1 --ioengine=libaio --bs=64k --numjobs=8 --size=512m --runtime=600 --group_reporting
  write: io=4096.0MB, bw=572914KB/s, iops=8951, runt=  7321msec
Interestingly, this happened while one disk is in rebuilt state (probably as part of the RAID initialization process - as I went for full instead of fast) .
root@pc1008:~# megacli -ShowSummary -aAll

System
	Operating System:  Linux version 4.9.0-12-amd64
	Driver Version: 07.700.00.00-rc1
	CLI Version: 8.07.14

Hardware
        Controller
                 ProductName       : PERC H730P Adapter(Bus 0, Dev 0)
                 SAS Address       : 5d0946609064bd00
                 FW Package Version: 25.5.5.0005
                 Status            : Need Attention
        BBU
                 BBU Type          : BBU
                 Status            : Healthy
        Enclosure
                 Product Id        : BP14G+
                 Type              : SES
                 Status            : OK

        PD
                Connector          : 00<Internal><Encl Pos 1 >: Slot 0
                Vendor Id          : ATA
                Product Id         : THNSF81D60CSE
                State              : Online
                Disk Type          : SATA,Solid State Device
                Capacity           : 1.454 TB
                Power State        : Active

                Connector          : 00<Internal><Encl Pos 1 >: Slot 1
                Vendor Id          : ATA
                Product Id         : THNSF81D60CSE
                State              : Online
                Disk Type          : SATA,Solid State Device
                Capacity           : 1.454 TB
                Power State        : Active

                Connector          : 00<Internal><Encl Pos 1 >: Slot 2
                Vendor Id          : ATA
                Product Id         : THNSF81D60CSE
                State              : Online
                Disk Type          : SATA,Solid State Device
                Capacity           : 1.454 TB
                Power State        : Active

                Connector          : 00<Internal><Encl Pos 1 >: Slot 3
                Vendor Id          : ATA
                Product Id         : THNSF81D60CSE
                State              : Rebuild
                Disk Type          : SATA,Solid State Device
                Capacity           : 1.454 TB
                Power State        : Active
                Operation In Progress : Rebuild

Storage

       Virtual Drives
                Virtual drive      : Target Id 0 ,VD name tank
                Size               : 4.364 TB
                State              : Degraded
                RAID Level         : 5

root@pc1008:~# megacli -PDRbld -ShowProg -physdrv[32:3:1] -aALL

Rebuild Progress on Device at Enclosure 32, Slot 3 Completed 32% in 32 Minutes.
None of the disks came up with errors or degraded or anything:
root@pc1008:~# megacli -LdPdInfo -a0 | grep -i count
Media Error Count: 0
Other Error Count: 0
Predictive Failure Count: 0
Shield Counter: 0
Media Error Count: 0
Other Error Count: 0
Predictive Failure Count: 0
Shield Counter: 0
Media Error Count: 0
Other Error Count: 0
Predictive Failure Count: 0
Shield Counter: 0
Media Error Count: 0
Other Error Count: 0
Predictive Failure Count: 0
Shield Counter: 0
I did the tests once that disk [32:3:1 finished its rebuild status, just in case it was "ok" but not really ok underneath.
root@pc1008:/opt/wmf-mariadb101# megacli -LdPdInfo -a0 | grep -i firmw
Firmware state: Online, Spun Up
Device Firmware Level: DAC9
Firmware state: Online, Spun Up
Device Firmware Level: DAC9
Firmware state: Online, Spun Up
Device Firmware Level: DAC9
Firmware state: Online, Spun Up
Device Firmware Level: DAC9

root@pc1008:/opt/wmf-mariadb101# megacli -ShowSummary -aAll

System
	Operating System:  Linux version 4.9.0-12-amd64
	Driver Version: 07.700.00.00-rc1
	CLI Version: 8.07.14

Hardware
        Controller
                 ProductName       : PERC H730P Adapter(Bus 0, Dev 0)
                 SAS Address       : 5d0946609064bd00
                 FW Package Version: 25.5.5.0005
                 Status            : Optimal
        BBU
                 BBU Type          : BBU
                 Status            : Healthy
        Enclosure
                 Product Id        : BP14G+
                 Type              : SES
                 Status            : OK

        PD
                Connector          : 00<Internal><Encl Pos 1 >: Slot 0
                Vendor Id          : ATA
                Product Id         : THNSF81D60CSE
                State              : Online
                Disk Type          : SATA,Solid State Device
                Capacity           : 1.454 TB
                Power State        : Active

                Connector          : 00<Internal><Encl Pos 1 >: Slot 1
                Vendor Id          : ATA
                Product Id         : THNSF81D60CSE
                State              : Online
                Disk Type          : SATA,Solid State Device
                Capacity           : 1.454 TB
                Power State        : Active

                Connector          : 00<Internal><Encl Pos 1 >: Slot 2
                Vendor Id          : ATA
                Product Id         : THNSF81D60CSE
                State              : Online
                Disk Type          : SATA,Solid State Device
                Capacity           : 1.454 TB
                Power State        : Active

                Connector          : 00<Internal><Encl Pos 1 >: Slot 3
                Vendor Id          : ATA
                Product Id         : THNSF81D60CSE
                State              : Online
                Disk Type          : SATA,Solid State Device
                Capacity           : 1.454 TB
                Power State        : Active

Storage

       Virtual Drives
                Virtual drive      : Target Id 0 ,VD name tank
                Size               : 4.364 TB
                State              : Optimal
                RAID Level         : 5

root@pc1008:/opt/wmf-mariadb101#  megacli -LDPDInfo -aAll

Adapter #0

Number of Virtual Disks: 1
Virtual Drive: 0 (Target Id: 0)
Name                :tank
RAID Level          : Primary-5, Secondary-0, RAID Level Qualifier-3
Size                : 4.364 TB
Sector Size         : 512
Is VD emulated      : No
Parity Size         : 1.454 TB
State               : Optimal
Strip Size          : 256 KB
Number Of Drives    : 4
Span Depth          : 1
Default Cache Policy: WriteBack, ReadAhead, Direct, No Write Cache if Bad BBU
Current Cache Policy: WriteBack, ReadAhead, Direct, No Write Cache if Bad BBU
Default Access Policy: Read/Write
Current Access Policy: Read/Write
Disk Cache Policy   : Disk's Default
Encryption Type     : None
Default Power Savings Policy: Controller Defined
Current Power Savings Policy: None
Can spin up in 1 minute: No
LD has drives that support T10 power conditions: No
LD's IO profile supports MAX power savings with cached writes: No
Bad Blocks Exist: No
Is VD Cached: No
Number of Spans: 1
Span: 0 - Number of PDs: 4
No media or smart alerts after the whole rebuilt process either:
root@pc1008:/opt/wmf-mariadb101# megacli -LdPdInfo -a0 | egrep -i "count|alert"
Media Error Count: 0
Other Error Count: 0
Predictive Failure Count: 0
Shield Counter: 0
Drive has flagged a S.M.A.R.T alert : No
Media Error Count: 0
Other Error Count: 0
Predictive Failure Count: 0
Shield Counter: 0
Drive has flagged a S.M.A.R.T alert : No
Media Error Count: 0
Other Error Count: 0
Predictive Failure Count: 0
Shield Counter: 0
Drive has flagged a S.M.A.R.T alert : No
Media Error Count: 0
Other Error Count: 0
Predictive Failure Count: 0
Shield Counter: 0
Drive has flagged a S.M.A.R.T alert : No
And running the tests again (with the host already replicating from pc1010):
fio --name=randread --rw=randread --direct=1 --ioengine=libaio --bs=8k --numjobs=16 --size=1G --runtime=600 --group_reporting
  read : io=16384MB, bw=586534KB/s, iops=73316, runt= 28604msec


fio --name=randwrite --rw=randwrite --direct=1 --ioengine=libaio --bs=64k --numjobs=8 --size=512m --runtime=600 --group_reporting
  write: io=4096.0MB, bw=284379KB/s, iops=4443, runt= 14749msec
Those values are pretty similar than the ones on pc1007, so maybe recreating the RAID did the trick.
Comment Actions
So, given that pc1008 looks ok from those tests my proposal is:
- Let pc1008 (pc2008 replicates from pc1008) replicate for maybe 3 weeks from pc1010 (right now we purge every 30d).
- After 3 weeks or so, revert and place pc1008 back into pc2
- After a few days, purge old rows (or truncate) pc1010
- Reset pc1010 replication from pc1007
Comment Actions
Change 581328 had a related patch set uploaded (by Marostegui; owner: Marostegui):
[operations/mediawiki-config@master] db-eqiad.php: Update pc1008 situation
Comment Actions
Change 581328 merged by jenkins-bot:
[operations/mediawiki-config@master] db-eqiad.php: Update pc1008 situation
Comment Actions
Mentioned in SAL (#wikimedia-operations) [2020-03-19T07:07:45Z] <marostegui@deploy1001> Synchronized wmf-config/db-eqiad.php: Update pc1008 spare situation T247787 (duration: 01m 09s)
Comment Actions
Change 581895 had a related patch set uploaded (by Marostegui; owner: Marostegui):
[operations/puppet@production] install_server: Do not reimage pc1008
Comment Actions
Change 581895 merged by Marostegui:
[operations/puppet@production] install_server: Do not reimage pc1008
Comment Actions
I will reimage pc1008 as Buster with 10.4 and next week I will repool it back after 3 weeks since this incident so the keys replicated from pc1010 will be there so it is not as cold.
Comment Actions
Change 588203 had a related patch set uploaded (by Marostegui; owner: Marostegui):
[operations/puppet@production] pc[12]008: Enable notifications
Comment Actions
Change 588203 merged by Marostegui:
[operations/puppet@production] pc[12]008: Enable notifications
Comment Actions
Change 589188 had a related patch set uploaded (by Marostegui; owner: Marostegui):
[operations/mediawiki-config@master] db-eqiad.php: Restore pc1008 as pc2 master
Comment Actions
Let's move pc1008 back to pc2 master.
Also, as pc1010 is replicating still from pc1, its disk was around 88% full, I have cleaned up some binlogs for now. But it is about time to move pc1008 back to become a master.
Comment Actions
Change 589188 merged by jenkins-bot:
[operations/mediawiki-config@master] db-eqiad.php: Restore pc1008 as pc2 master
Comment Actions
Mentioned in SAL (#wikimedia-operations) [2020-04-16T08:18:23Z] <kormat@deploy1001> Synchronized wmf-config/db-eqiad.php: Repool pc1008 as pc2 master T247787 (duration: 01m 08s)
Comment Actions
Mentioned in SAL (#wikimedia-operations) [2020-04-16T08:33:54Z] <kormat> Disconnect pc1008 replication from pc1010 T247787
Comment Actions
pc1008 is back as pc2 master and pc1010 will be cleaned up, purged and then back to the spare pool
Comment Actions
Mentioned in SAL (#wikimedia-operations) [2020-04-16T13:36:30Z] <kormat> Optimizing all tables on pc1010 T247787
Comment Actions
Mentioned in SAL (#wikimedia-operations) [2020-04-17T09:54:01Z] <kormat> enabling replication from pc1007 to pc1010 T247787
Comment Actions
Mentioned in SAL (#wikimedia-operations) [2020-04-17T10:07:25Z] <kormat> change pc2010 to replicate from pc1010 T247787
Comment Actions
Magic happened:
- Optimized tables on pc1010 to free up some space (it halved disk usage)
- Moved pc1010 to replicate under pc1007
- Moved pc2010 to replicate under pc1010
Todo:
- Next week, purge the tables
Comment Actions
Mentioned in SAL (#wikimedia-operations) [2020-04-21T07:47:56Z] <kormat> dropping old data and optimizing tables on pc1010 and pc2010 T247787
Comment Actions
Mentioned in SAL (#wikimedia-operations) [2020-04-27T08:24:30Z] <kormat> Truncating and optimizing parsercache for pc1010 and pc2010 T247787
Comment Actions
Thank you!
For the record: the incident report for this is at: https://wikitech.wikimedia.org/wiki/Incident_documentation/20200319-parsercache (as of today it is in review state)