Page MenuHomePhabricator

integration instances suffer from high IO latency due to Ceph
Closed, ResolvedPublic

Description

For a couple weeks, at least, the CI job have shown signs of slowness. The most prominent one is when Docker terminates a container, some takes a few minutes to be deleted which blocks docker run until the container root fs has been deleted. I have been almost full time investigating that issue for the last two weeks in order to rule out any mistake we could have done in the runner (Quibble), Jenkins, our instances configuration, Docker / containerd versions. The glory details of the investigation are in T265615.

Eventually last night I have pointed out the issue is due to I/O being an order of magnitude slower. I have determined it by counting file related system calls on the Docker daemon while it was deleting a container. The output after a few seconds:

strace -C -e trace=file -f -p `pidof dockerd`
% time     seconds  usecs/call     calls    errors syscall
------ ----------- ----------- --------- --------- ----------------
 94.50    0.221674           2    145394     11771 unlinkat
  3.41    0.008000        2667         3         1 umount2
  1.71    0.004000        1000         4           fchmodat
  0.29    0.000674           0     11782           openat
  0.09    0.000220           0     11774         3 newfstatat
  0.00    0.000000           0         4           renameat
------ ----------- ----------- --------- --------- ----------------
100.00    0.234568                168961     11775 total

Some unlinkat calls even take 100 - 200 ms.

The instance in the integration project collected Linux metrics via Diamond which can be queried via Graphite. They all show a dramatic increase of I/O latency:

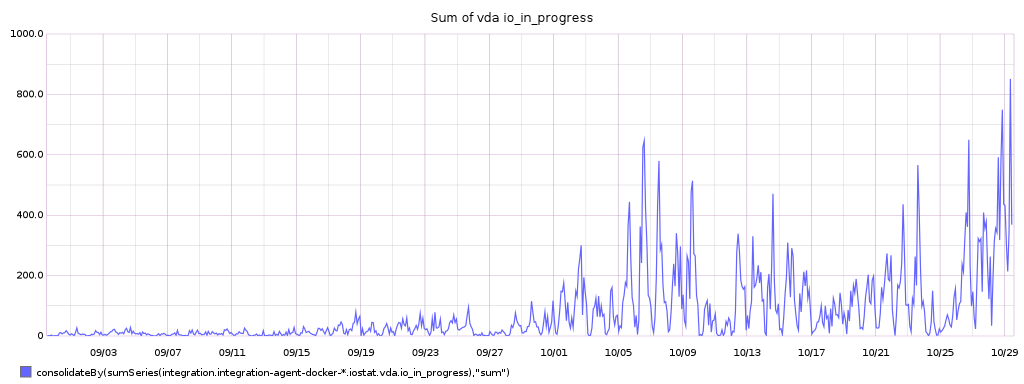
Gauge of io in progress, described in Linux Documentation/iostats.txt as:

The only field that should go to zero. Incremented as requests are given to appropriate struct request_queue and decremented as they finish.

One can see them as the number of IO operations in the queue:

sum_of_io_in_progress.png (384×1 px, 48 KB)

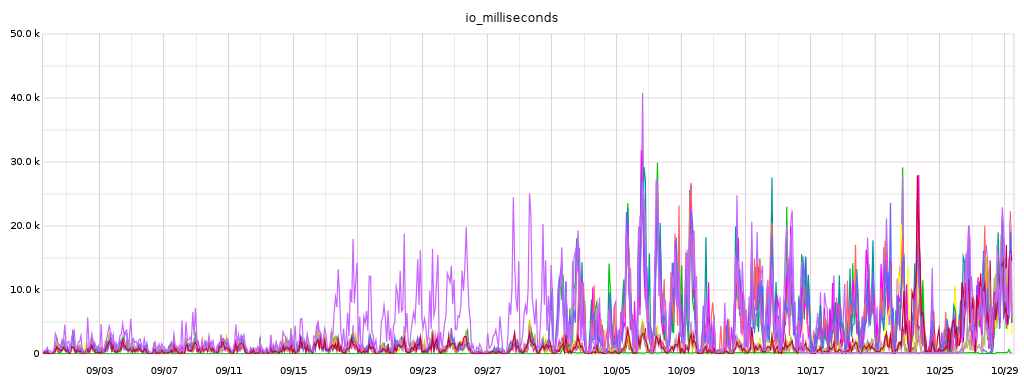
Sum of I/O milliseconds:

sum_of_io_milliseconds.png (384×1 px, 57 KB)

The number of I/O per second has not changed:

sum_of_iops.png (384×1 px, 71 KB)

Details for I/O milliseconds per hosts:

io_milliseconds.png (384×1 px, 118 KB)

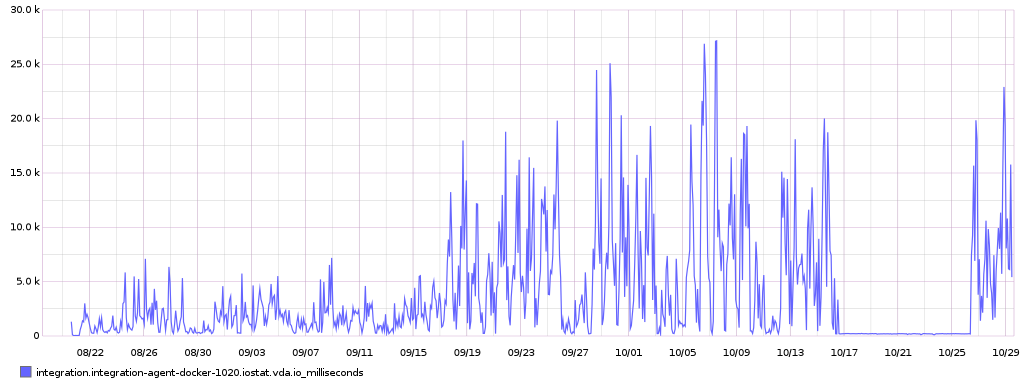
The purple one that stands out on 9/18 to 9/26 is integration-agent-docker-1020. That is the first instance that started using Ceph and got scheduled in August (T260916). I have added it with the aim of being able to assert the performances of moving to Ceph and if I remember properly it behaved fine in September when I looked at it.

A zoom at that host shows it was more or less fine (albeit still way slower than others), and starting 9/18 its performance degraded. The gap mid-october to 26/10 is when I have unpooled it while investigating the issue, it thus had no workload:

agent-1020.png (384×1 px, 66 KB)

It seems that all instances have been moved to Ceph despite including the CI ones which was supposed to be tracked at T260916.

Event Timeline

Restricted Application added a subscriber: Aklapper. · View Herald Transcript

If you have specific iops or throughput numbers that you need for proper performance you can create a quota request task and we can make a custom flavor with different limits.

We had a quick chat back in August about migrating the integration project. In that chat I have mentioned that CI instances do a bunch of disk io and thus moving to Ceph might slow down disk io. Given there were at the time no performance metrics I advised against making integration an early adopter. Surely moving to newer host and big CPU improvement is an incentive, but not at the expense of disk latency.

The same day I have:

  • added one instance which is Ceph based with the intent to compare its performance with the others.
  • filed a placeholder task for migrating the integration project (T260916)
  • warned I am unlikely to think about it anytime soon (if ever :D ) cause my schedule was pretty packed in September and October.

For the few times I have checked the instance in September: it behaved properly. I guess because it was one of the sole on the system or some tuning haven't been done yet on Ceph side.

I guess I was expecting some level of communication about the migration, potentially through the dedicated task or via a meeting. Instead all instances have been migrated without our knowledge and we end up with the situation I have warned early on: IO are throttled, the workload is affected with user facing issues.

I am in the dark regarding the Ceph system. I do not have any knowledge about the iops / throughput used, though potentially we could gather some from the metrics collected on Diamond, it seems more efficient to look at it from the infrastructure point of view. If Glance/Ceph have iops and bandwidth throttling, surely those metris are exposed somewhere on a per instance or per tenant basis and can be tuned up from there?

Our conversation in August was about whether or not Integration VMs should be early adopters of Ceph. The entire cloud was/is/has moved to Ceph; this was never in question.

There have been many announcements about this, all explaining that all VMs would be moved to ceph. Additionally there were specific scheduling announcements for each VM being moved (e.g. https://lists.wikimedia.org/pipermail/cloud-announce/2020-October/000326.html).

Since all storage is now network storage, there are bandwidth limits that apply to all disk access. The default limits are:

quota:disk_read_iops_sec='5000', quota:disk_total_bytes_sec='200000000', quota:disk_write_iops_sec='500'

I've resized integration-agent-docker-1020 to a flavor with increased IO throttles (4x the standard limits). Let's see what the graphs look like on Monday and we can determine if these limits are adequate or overkill or what.

I have drafted a quick dashboard for Diamond IO statistics: https://grafana-labs.wikimedia.org/d/Yj81kH2Gk/cloud-project-io-metrics it is imperfect, there are some metrics that are probably off somehow.

integration-agent-docker-1020 had the issue starting Sept. 17th 15:00 which is when its flavor got changed to one having the quota.

With the change you have made, the metrics look better indeed with the new quota. I also looked at the use case from the parent task, the large container gets deleted in ~ 30 seconds with the new quota (from a few minutes up to 6/7 minutes) which I guess is directly related to raising quota:disk_write_iops_sec. So that is definitely an improvement, can you generalize this to the other instances of the integration project please?

From the above dashboard, if I look at mostly idle instances such as integration-agent-qemu-1001 or bastion-eqiad1-01, they have spikes of write latency matching the puppet runs (every 30 minutes). That is less than a minute though, but still sounds concerning.

On some other busy instances such as integration-agent-1020, Diamond reports some latency spikes in the range of an hour. But that might be an oddity in the metrics collection, or maybe some counter overflowing :/

I was using the wrong metrics. Diamond gets the metrics from /proc/diskstats which are documented at https://www.kernel.org/doc/html/latest/admin-guide/iostats.html . I had the graphs showing the total time spent in IO, I have changed it in time / number of operations (await metrics computed by Diamond). That looks much better.

Here is a comparison of 1020 and 1016 instances: https://grafana-labs.wikimedia.org/d/Yj81kH2Gk/cloud-project-io-metrics?orgId=1&var-project=integration&var-server=integration-agent-docker-1020&var-server=integration-agent-docker-1016&var-disk=vda&var-disk=vdb

1016 is limited at 500 ops and has write latency up to ~ 200ms.

1020 spikes way higher (1.5k ops at least) but has write latency of ~ 40 ms.

So yeah that is definitely better \o/

From my digging into the code/documentation this afternoon. quota:disk_write_iops_sec ultimately maps to QEMU setting:

-drive option[,option[,option[,...]]]
...
iops=i,iops_rd=r,iops_wr=w
Specify request rate limits in requests per second, either for all request types or for reads or writes only.

And just below:

iops_max=bm,iops_rd_max=rm,iops_wr_max=wm
Specify bursts in requests per second, either for all request types or for reads or writes only. Bursts allow the guest I/O to spike above the limit temporarily.

That one is in OpenStack rocky / Nova 18.0.0+ and is exposed as disk_write_iops_sec_max:

I have no idea what is the bucket size in QEMU thought, but tentatively that should let some spikes pass.


And my last question for tonight: the CI instances don't really any permanent storage, we just discard the containers / workspaces etc at the end of each build. So they could be using an ephemeral storage directly on the Compute node (with io throttling for sure) but I guess they don't have much disk nowadays or it is maybe easier to have everything backed up by Ceph I guess.

And just below:

iops_max=bm,iops_rd_max=rm,iops_wr_max=wm
Specify bursts in requests per second, either for all request types or for reads or writes only. Bursts allow the guest I/O to spike above the limit temporarily.

That one is in OpenStack rocky / Nova 18.0.0+ and is exposed as disk_write_iops_sec_max:

Those docs are for Cinder so I think they'd be per-volume rather than per-VM?

I've adjusted the throttling rules for all integration-agent-docker-10xx nodes.

hashar lowered the priority of this task from Unbreak Now! to High.Nov 2 2020, 11:18 PM

Those docs are for Cinder so I think they'd be per-volume rather than per-VM?

No idea. At least the setting shows up in nova/virt/libvirt/config.py so maybe that is still passed to the VM when it is booted.

Lowering priority since the quota fixed it for one instance and got applied on the remaining instances. Will check the metrics tomorrow evening, most probably we can close this task and finely tune later as needed.

I have further tweaked the Grafana dashboard (example for integration).

The situation has vastly improved at least for the deletion of Docker images / containers. For the few I have looked at, that went from several minutes to under 30 seconds.

One that stands out is the job https://integration.wikimedia.org/ci/job/integration-quibble-fullrun/buildTimeTrend which went from 11 minutes to 22 minutes. It runs the Quibble test runner against mediawiki/core. Notably:

  • MediaWiki API tests go from 60 seconds to 110s
  • PHPUnit tests that requires a database access go from less than 5 minutes to more than 11 minutes.

Both make heavy use of the MySQL database and that job does not have it under a tmpfs. The database being write heavy, that show up in the stats. It is a defect of this specific job, it should use a tmpfs (filed as T267172). Still, it shows how the raised quota still affects performances. I would imagine the beta cluster has the same issue.

The heavy job wmf-quibble-selenium-php72-docker seems to behave more or less properly. It still slower than it used to be, but not by much (maybe 10% slower).

Change 654933 had a related patch set uploaded (by Hashar; owner: Hashar):
[integration/config@master] jjb: use tmpfs for MySQL in Quibble fullrun jobs

https://gerrit.wikimedia.org/r/654933

Change 654933 merged by jenkins-bot:
[integration/config@master] jjb: use tmpfs for MySQL in Quibble fullrun jobs

https://gerrit.wikimedia.org/r/654933

@hashar , are you getting adequate performance now? Can this be closed?

Change 668483 had a related patch set uploaded (by Hashar; owner: Hashar):
[integration/config@master] jjb: point db dir to the tmpfs in Quibble fullrun jobs

https://gerrit.wikimedia.org/r/668483

Change 668483 merged by jenkins-bot:
[integration/config@master] jjb: point db dir to the tmpfs in Quibble fullrun jobs

https://gerrit.wikimedia.org/r/668483

Andrew claimed this task.

Yes this task should have been marked solved immediately after Andrew raised the limits to 4 times the default. There are still some slowness but I will follow up on the parent task T265615 and this one is merely an historical archive.