In the past, the IRC notifications contained the name and a link to the originating Grafana dashboard.
Now, neither is present:
[#wikimedia-perf] <jinxer-wm> (Increased HTTP Error Responses) firing: Increased HTTP Error Responses - https://alerts.wikimedia.org
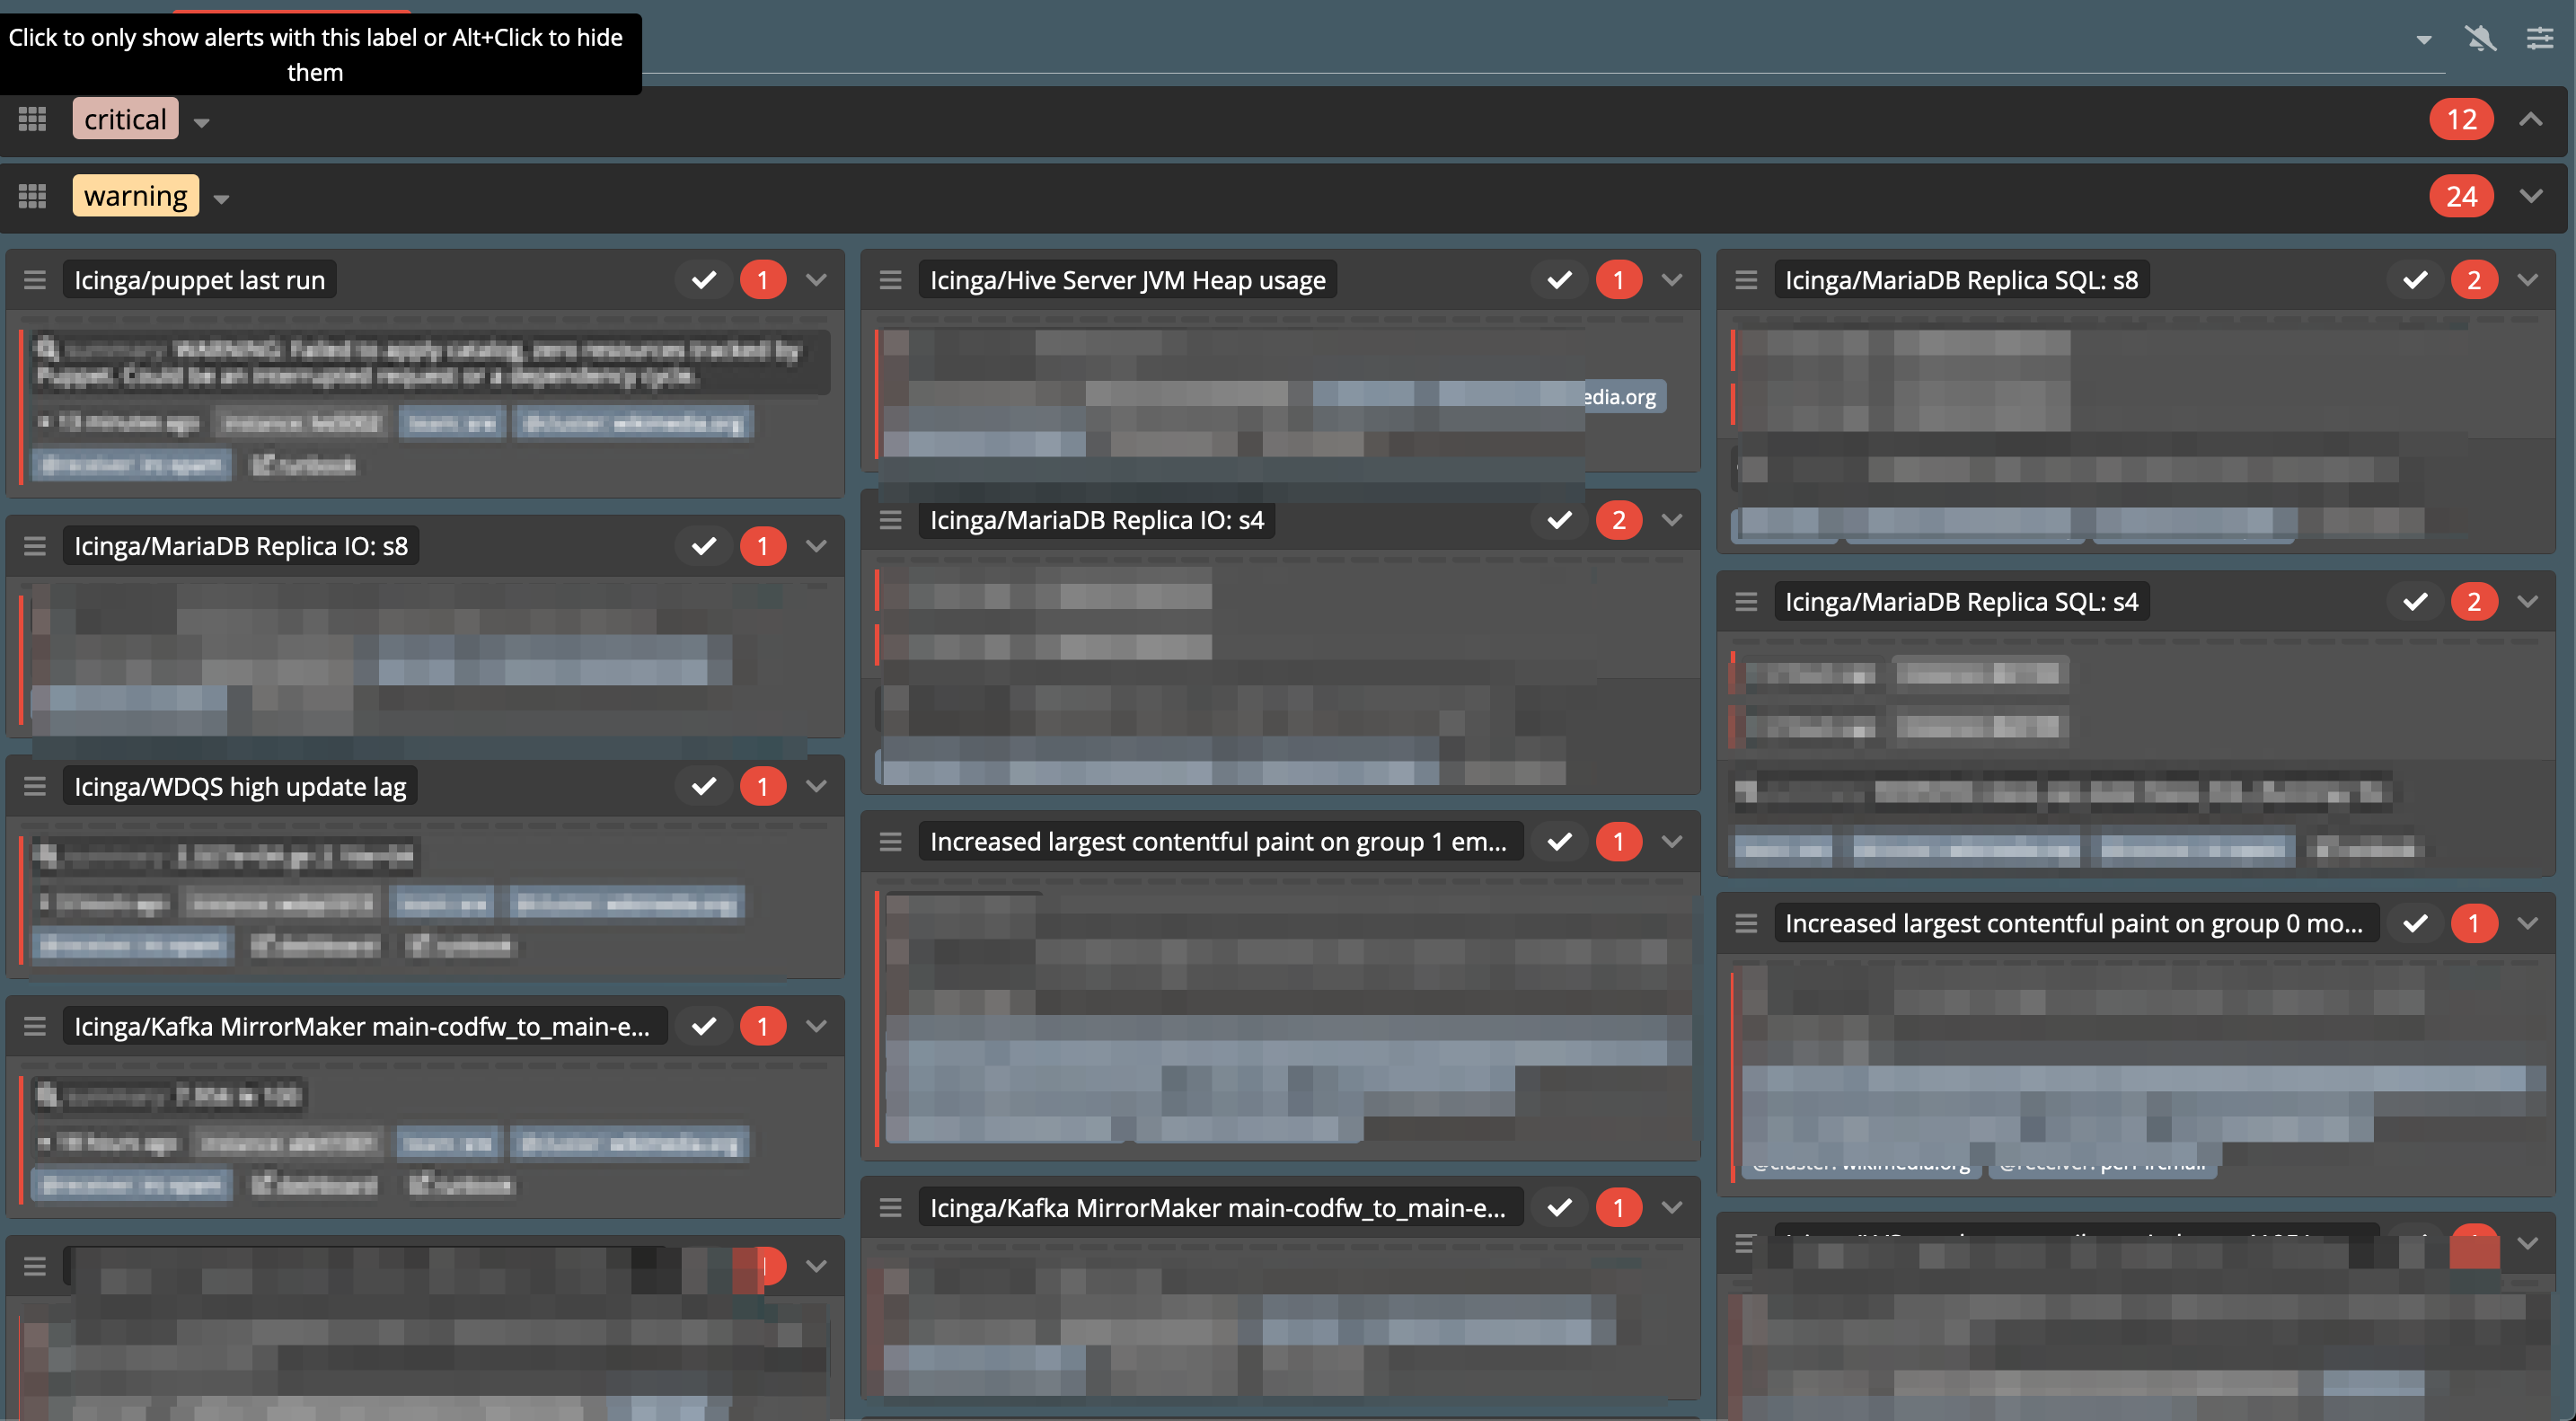
As it contains no service name or other context, it's prone to be ignored or post-poned if one's relevant domain keywords aren't mentioned. But if digging in regardless, the only link is to a busy AM homepage:
When carefully selecting the "relevant" part from the notification, copy-pasting it manually, and hoping there is only one obvious match (not always the case), then there may still be nothing, as often the spike may come and go:
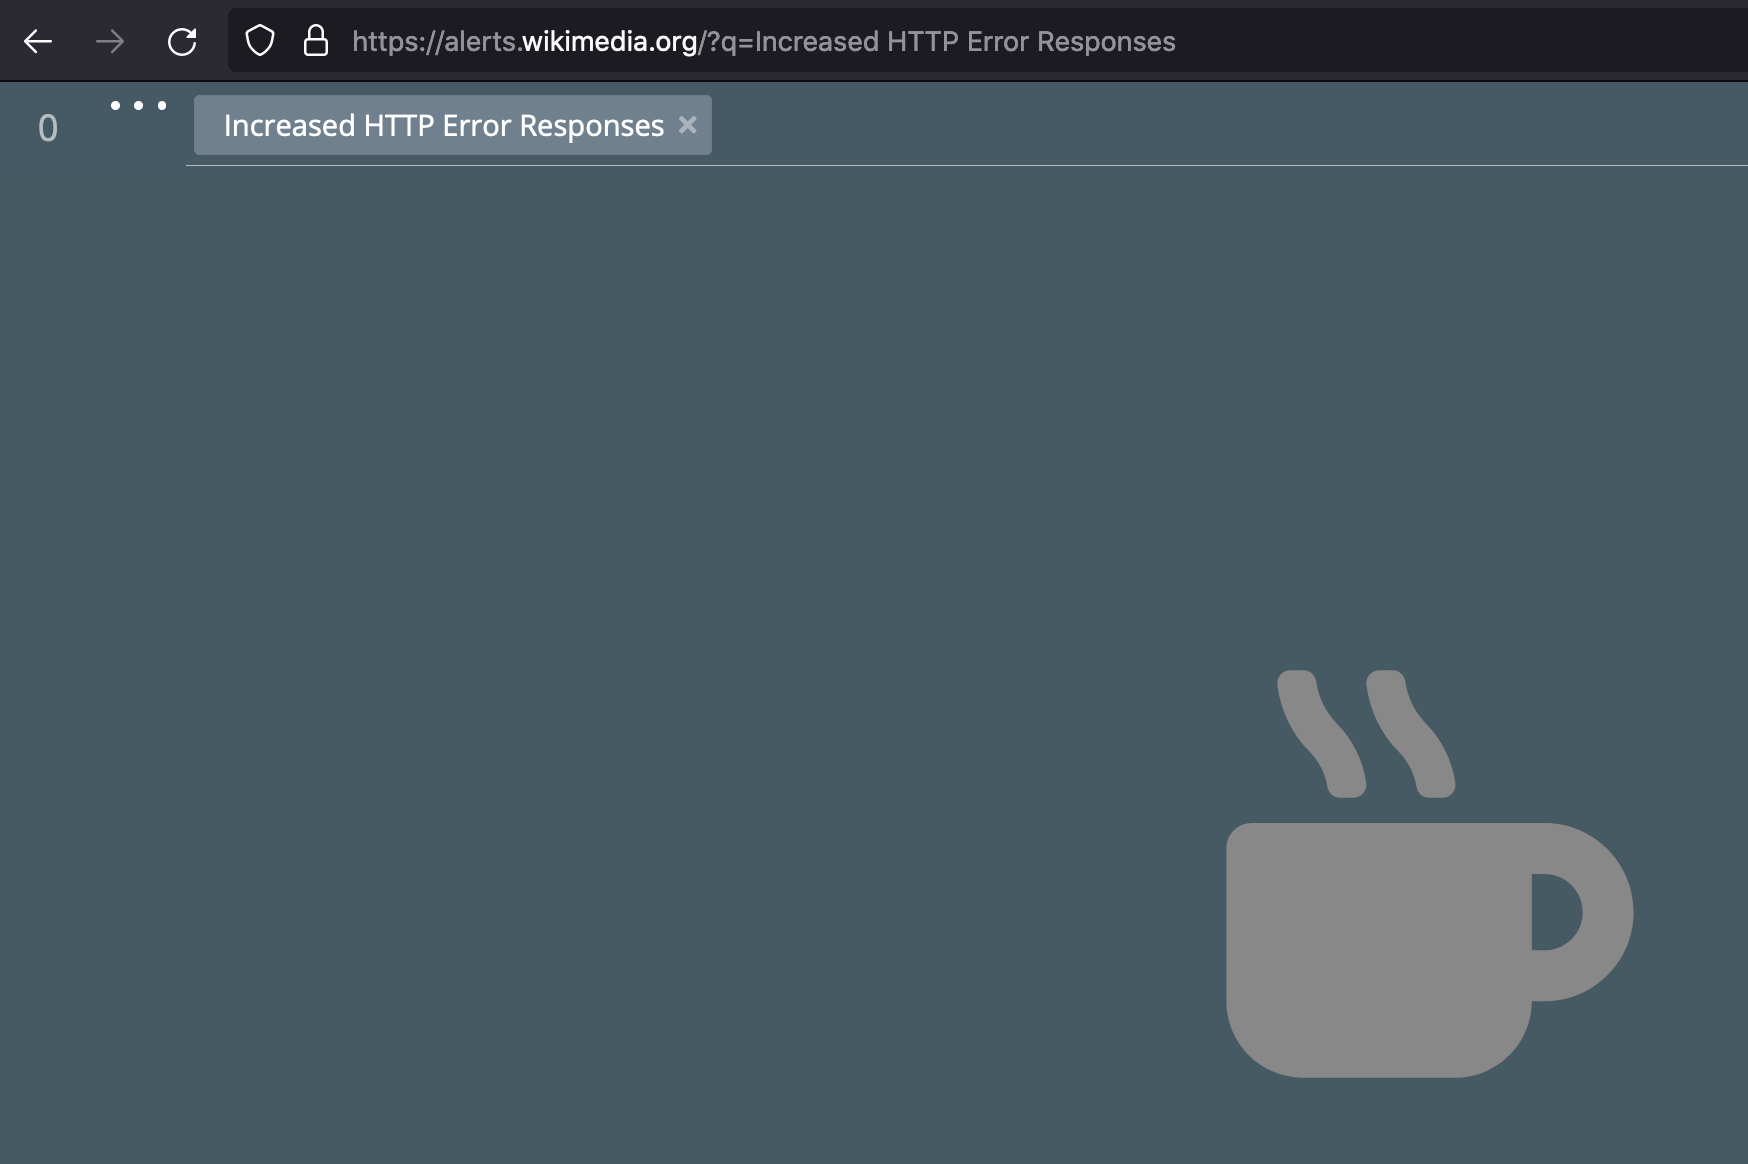
And so I'm left with:
- I don't know what service was affected.
- I can't explore the data in question.
In this case, after narrowing down the possibilities, I know it is about this panel on the "ResourceLoader Alerts" dashboard:
https://grafana.wikimedia.org/d/000000402/resourceloader-alerts?viewPanel=14
Having the origin "ResourceLoader Alerts" mentioned, and a link to the dashboard panel, would make these significantly more useful :)
Some of the alerts in #wikimedia-operations hande this so I think the primitives for this are there, but maybe we haven't connected the dots properly. For example, the first part of the notification in parenthesis seems like it might be intended for the service name but maybe it's missing for some reason so it's falling back to mentioning the local panel name twice. And the ops alerts seem to link to a Grafana dashboard as well, although those alerts come from Puppet afaik, so they are wired differently but at least the last mile seems to have support for it, so presumably there's a way to connect in a mostly-automated way from Grafana as well.