Page MenuHomePhabricator

Investigate high levels of garbage collection on new AQS nodes
Closed, ResolvedPublic

Assigned To
Authored By
BTullis
Jan 4 2022, 12:27 PM
Referenced Files
F34941248: image.png
Feb 3 2022, 10:21 AM
F34939480: image.png
Feb 1 2022, 2:29 PM
F34938220: image.png
Jan 31 2022, 4:36 PM
F34938213: image.png
Jan 31 2022, 4:36 PM
F34933940: image.png
Jan 28 2022, 10:22 AM
F34932607: Screenshot from 2022-01-27 09-45-04.png
Jan 27 2022, 9:54 AM
F34925884: image.png
Jan 21 2022, 4:18 PM
F34925851: image.png
Jan 21 2022, 3:58 PM

Description

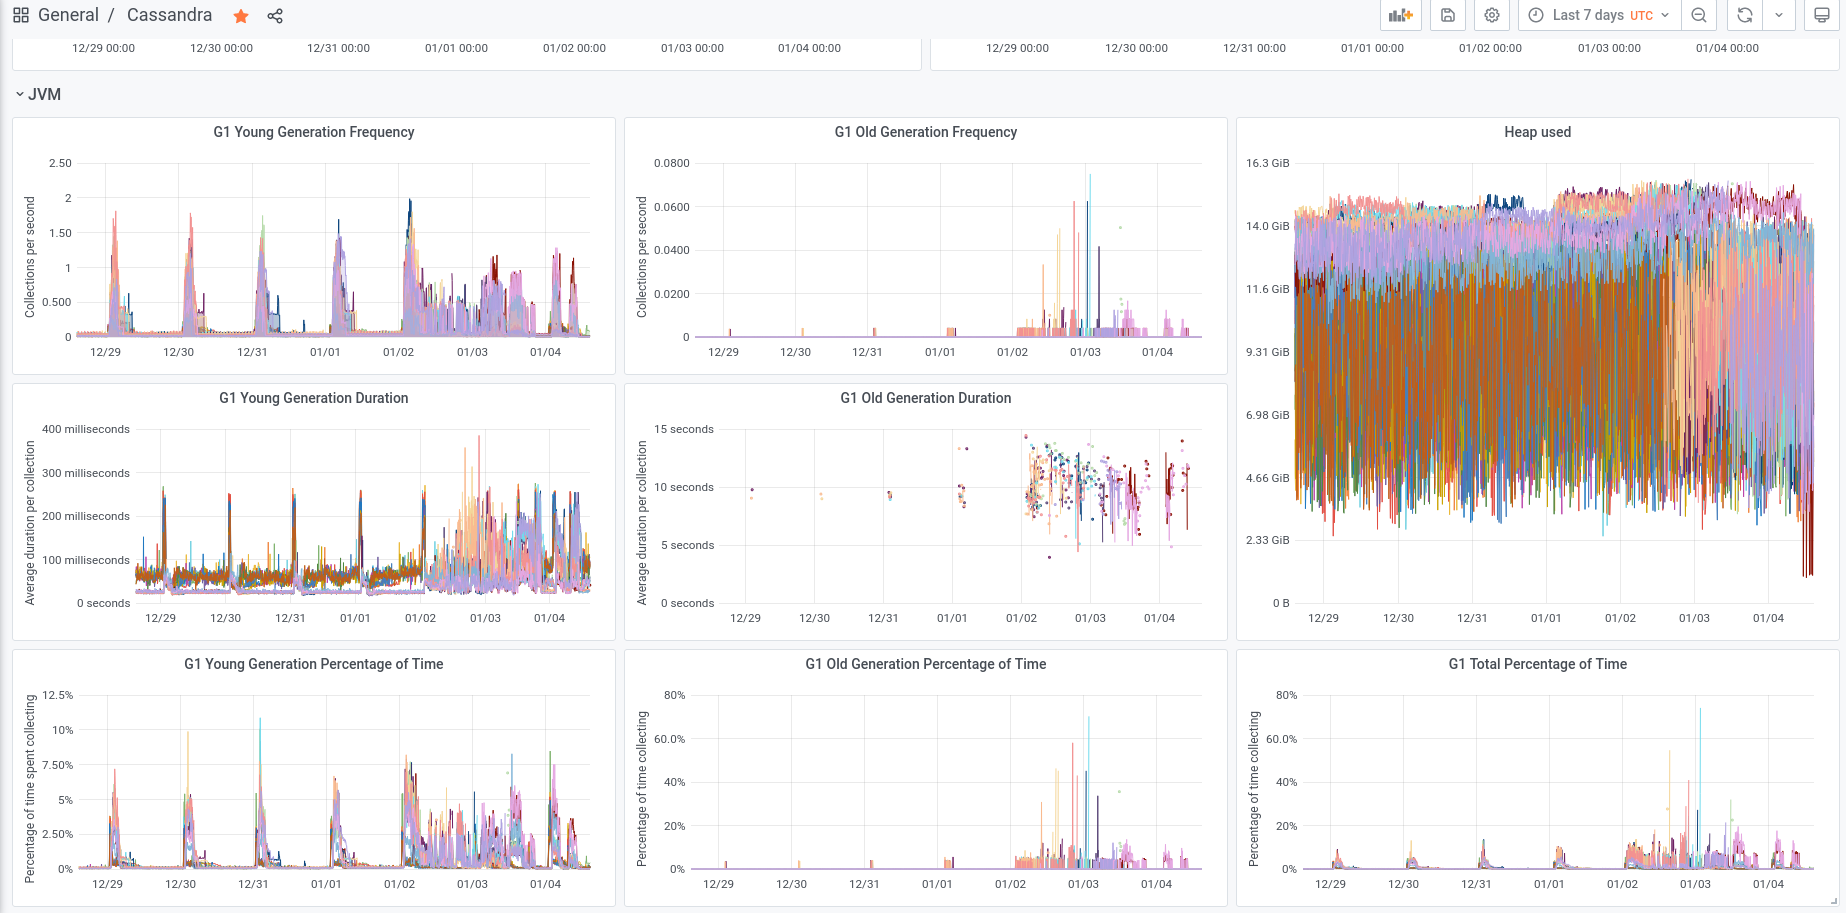
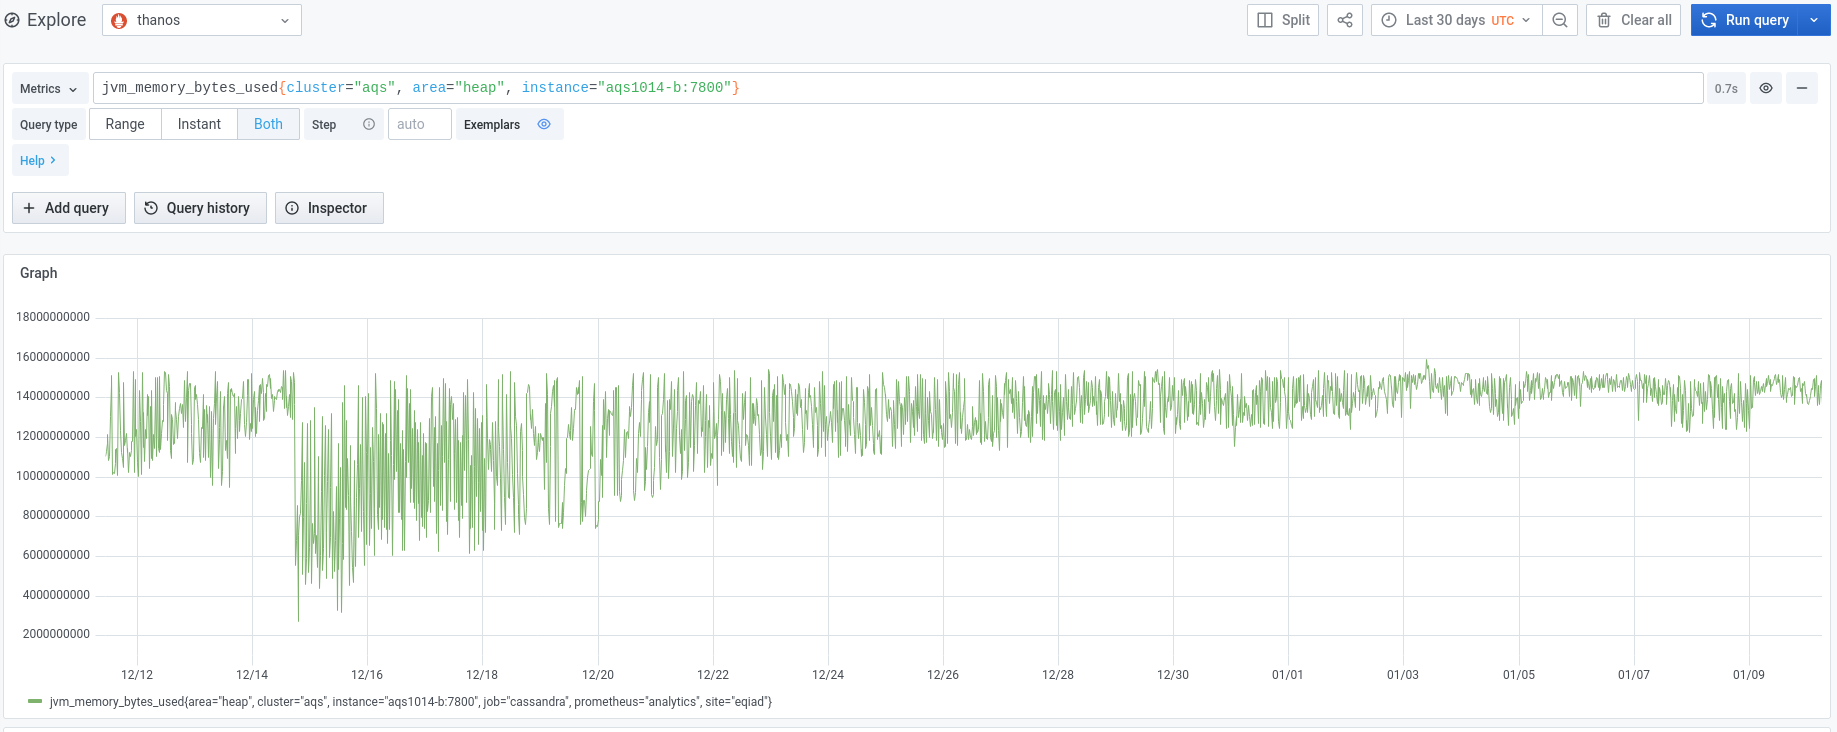
We experienced an incident on 2022/01/03 with two of the instances in the new AQS cluster.

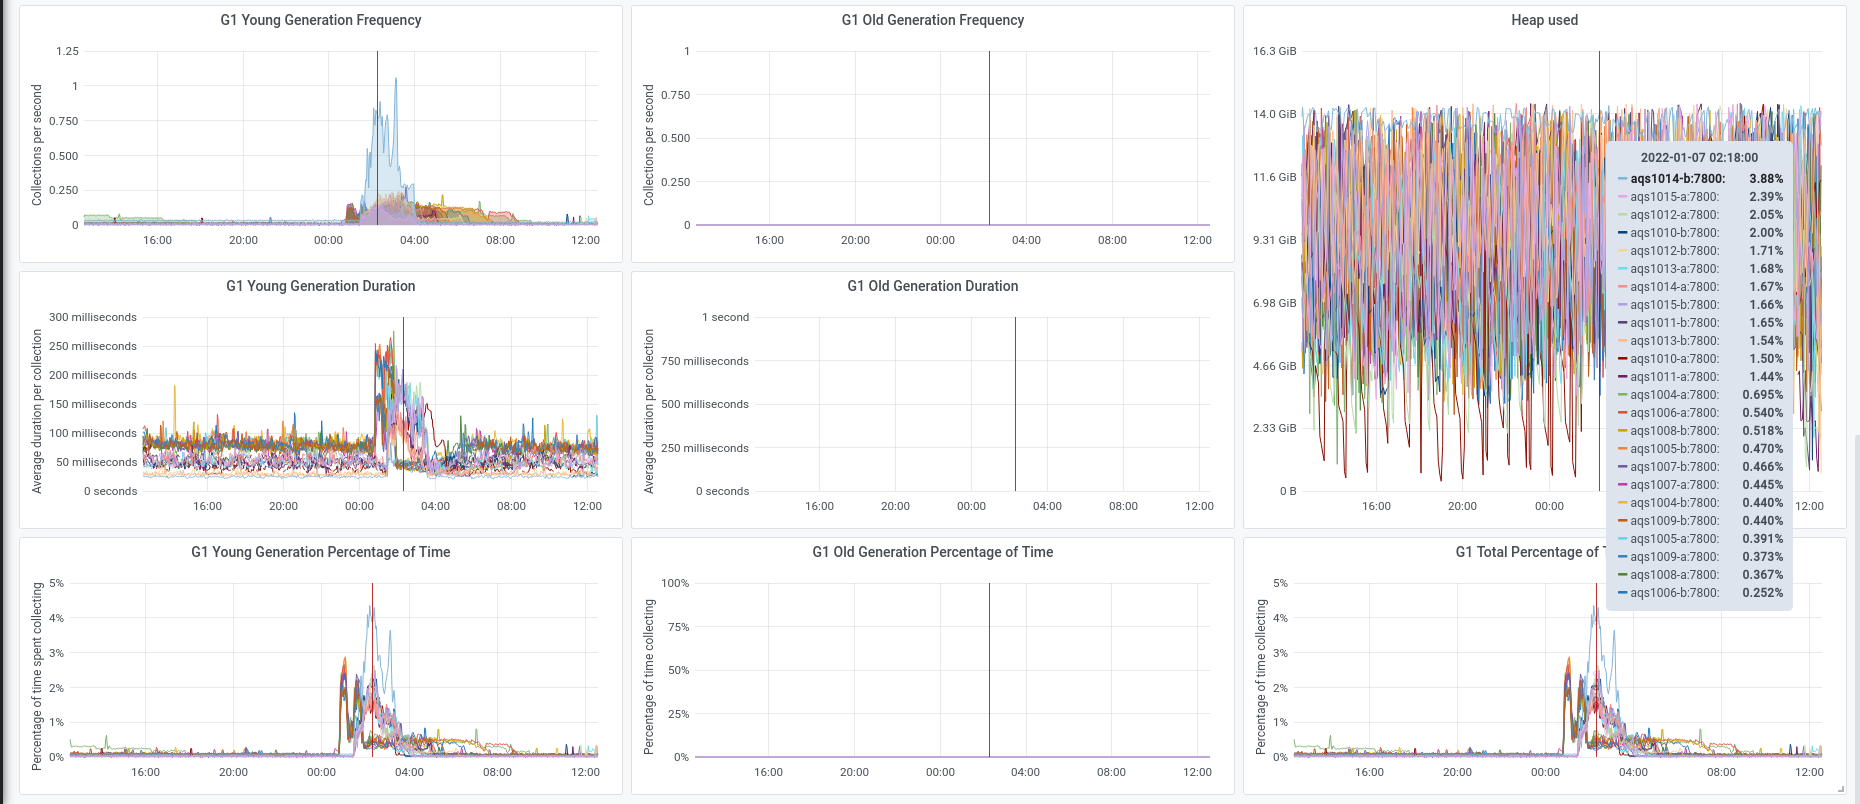
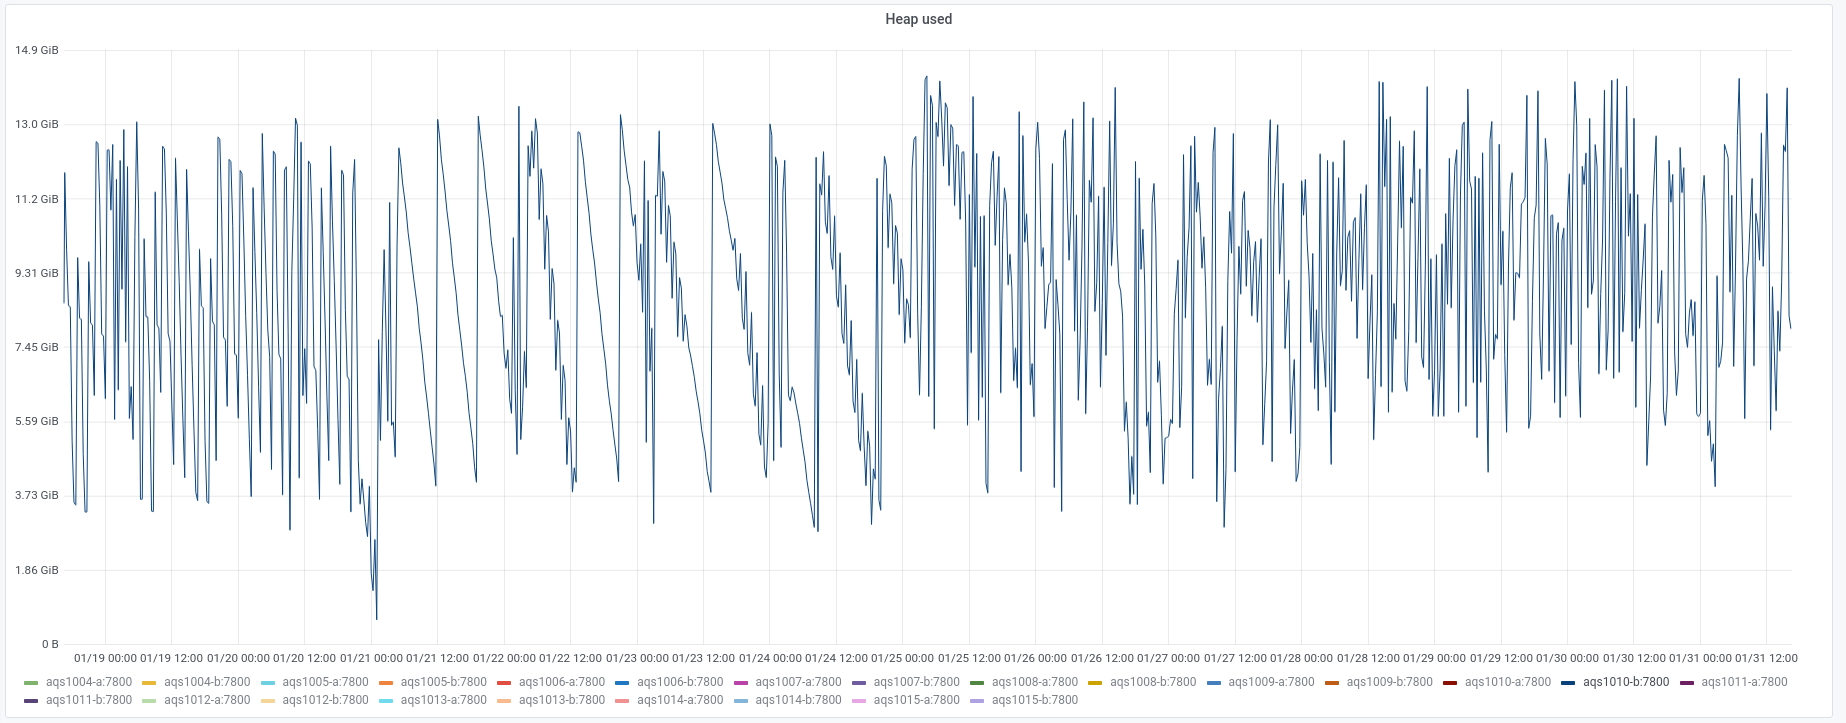
Initially aqs1010-b went into a DN state and seemed to be spending a lot of time in garbage collection.
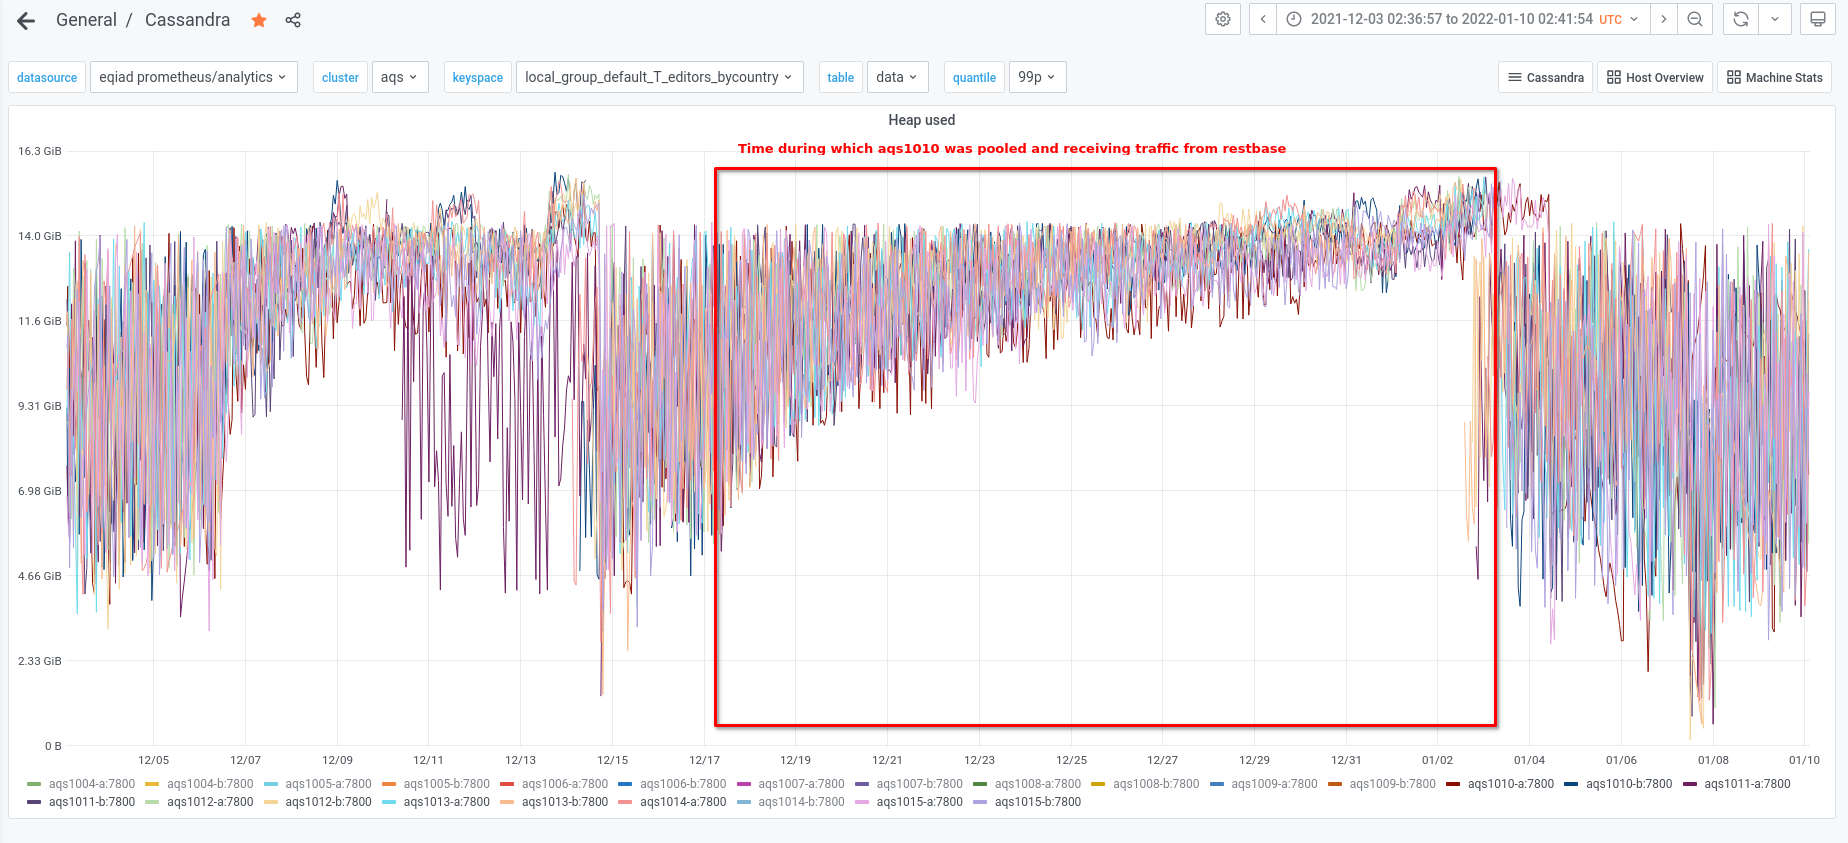
aqs1010 was the only node from the new cluster that was pooled and actively receiving traffic from the AQS web service at the time.

As per the SAL

  • The aqs1010 node was depooled from the aqs cluster at 10:34 UTC
  • The aqs1010-b instance was restarted at 11:16 UTC

Subsequently aqs1015-b stopped responding and went into a similar high GC state.

  • The aqs1015-b instance was restarted at 11:26 UTC

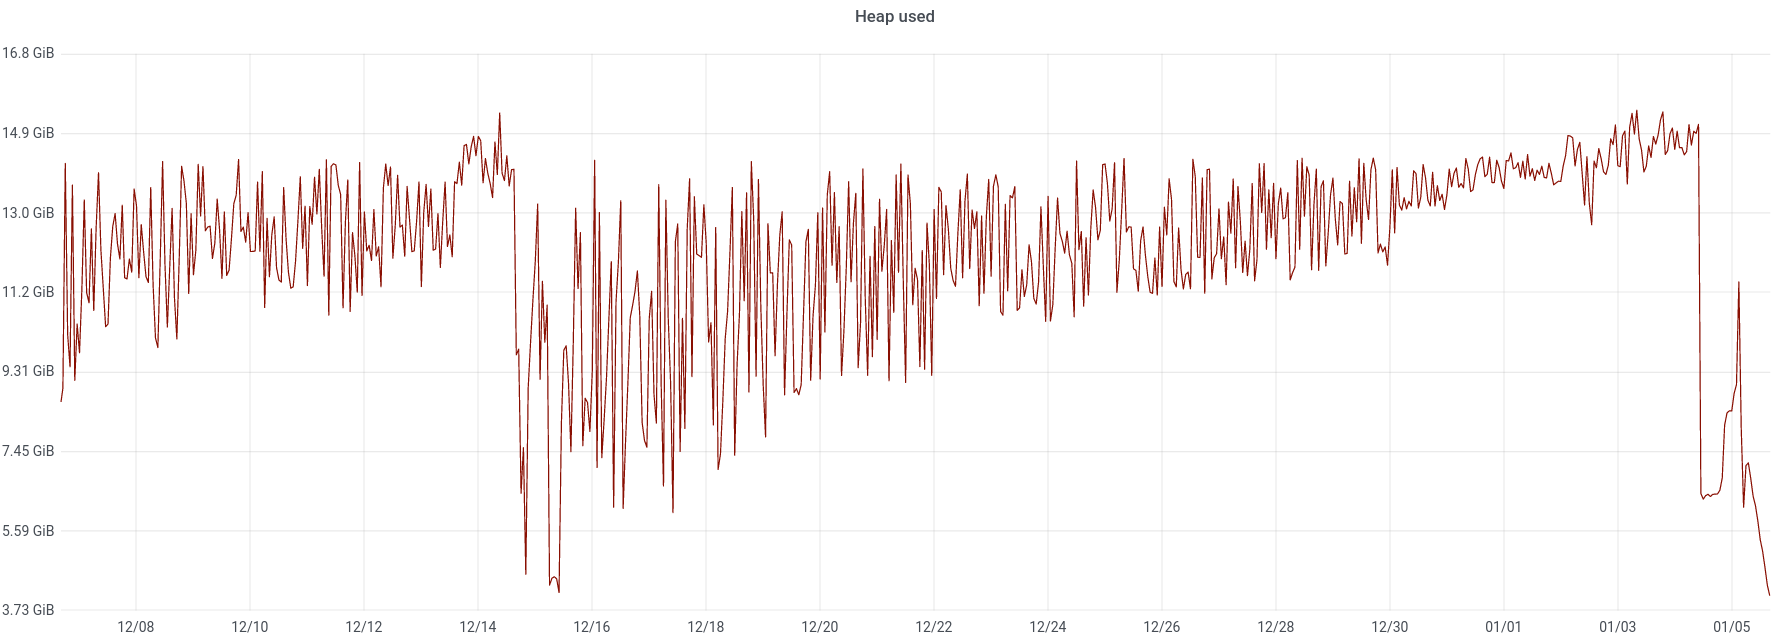
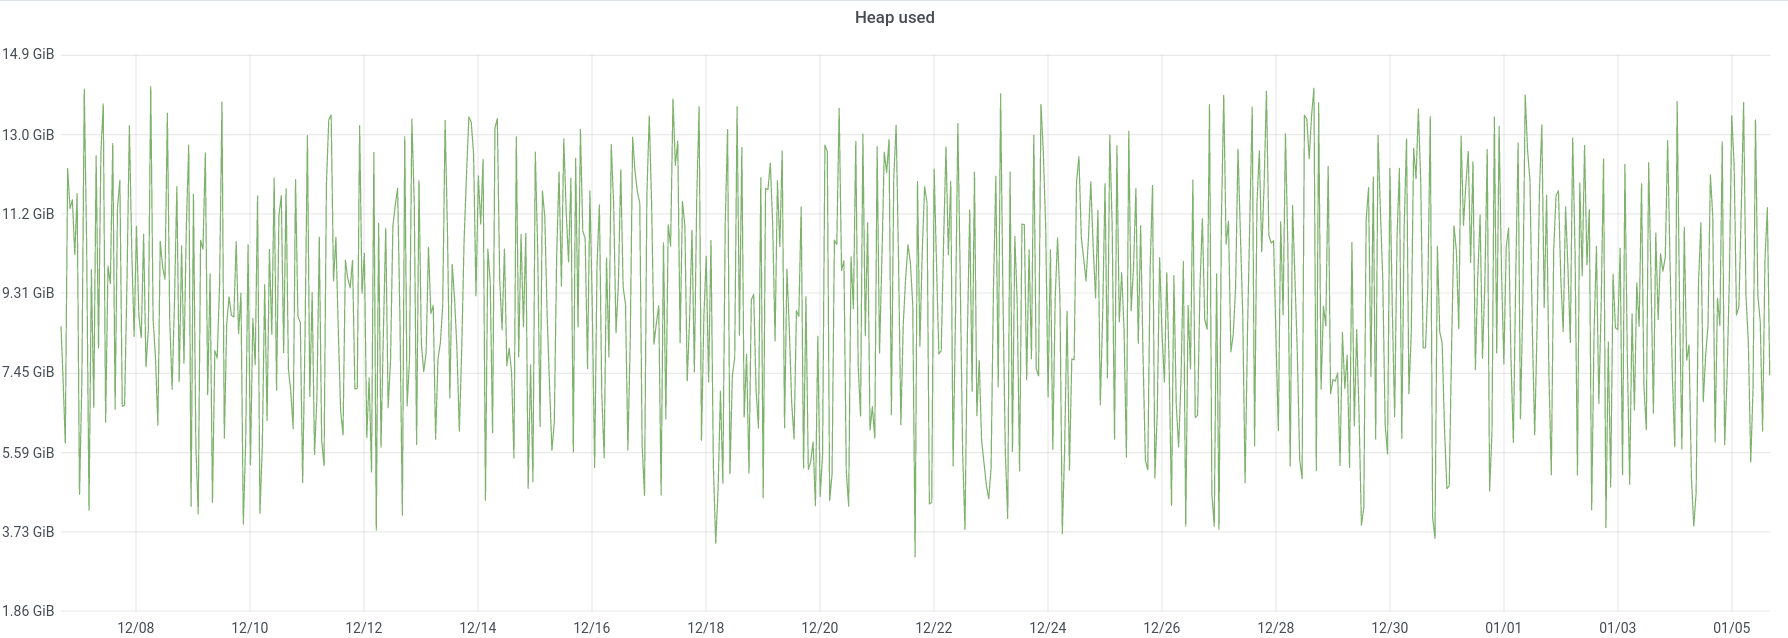
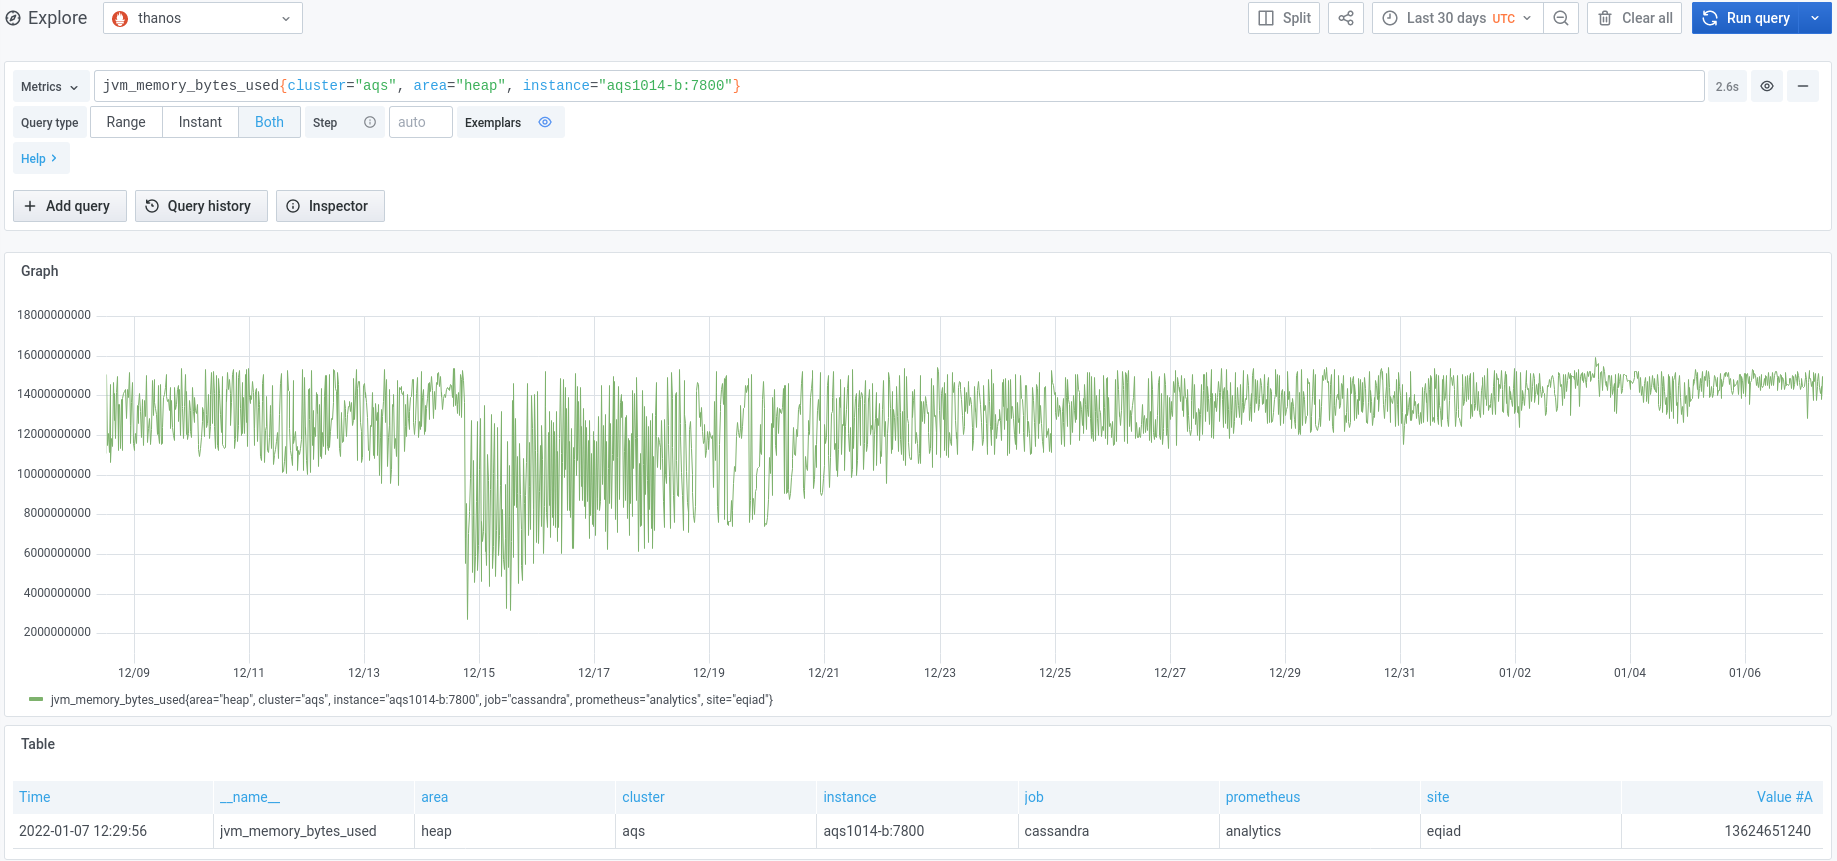
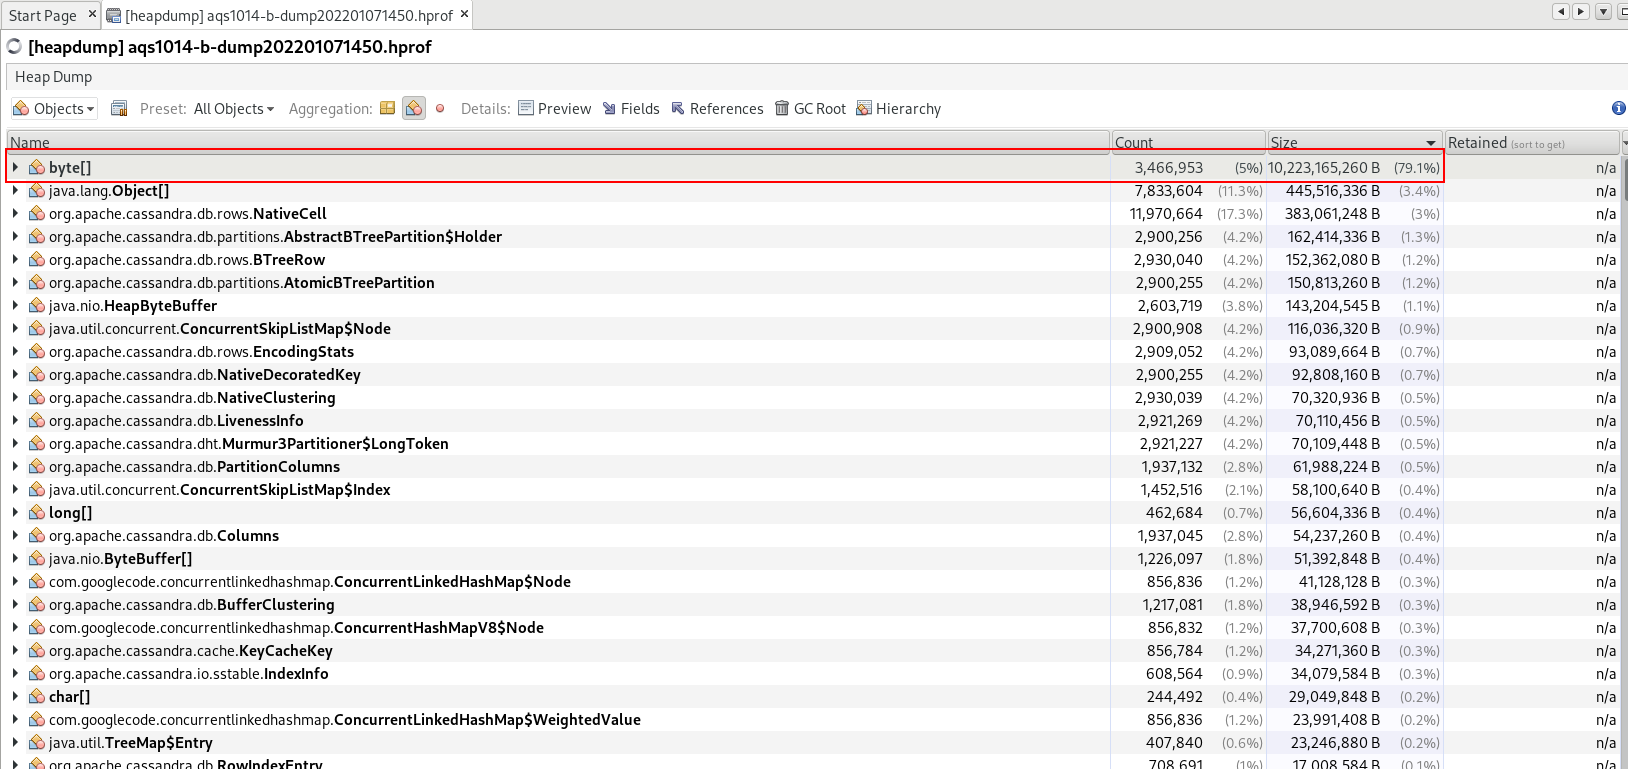
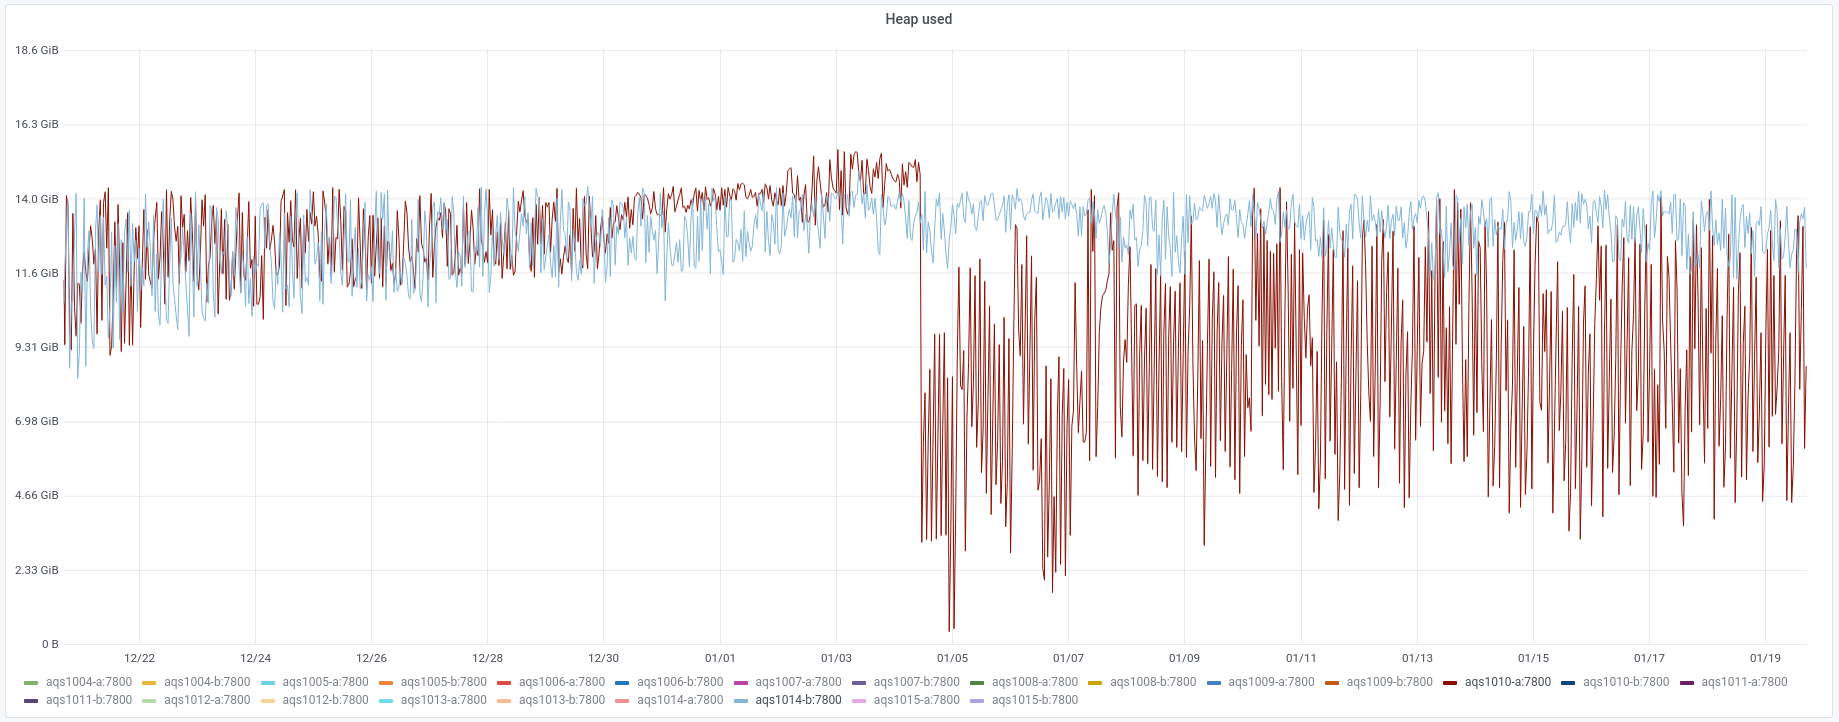
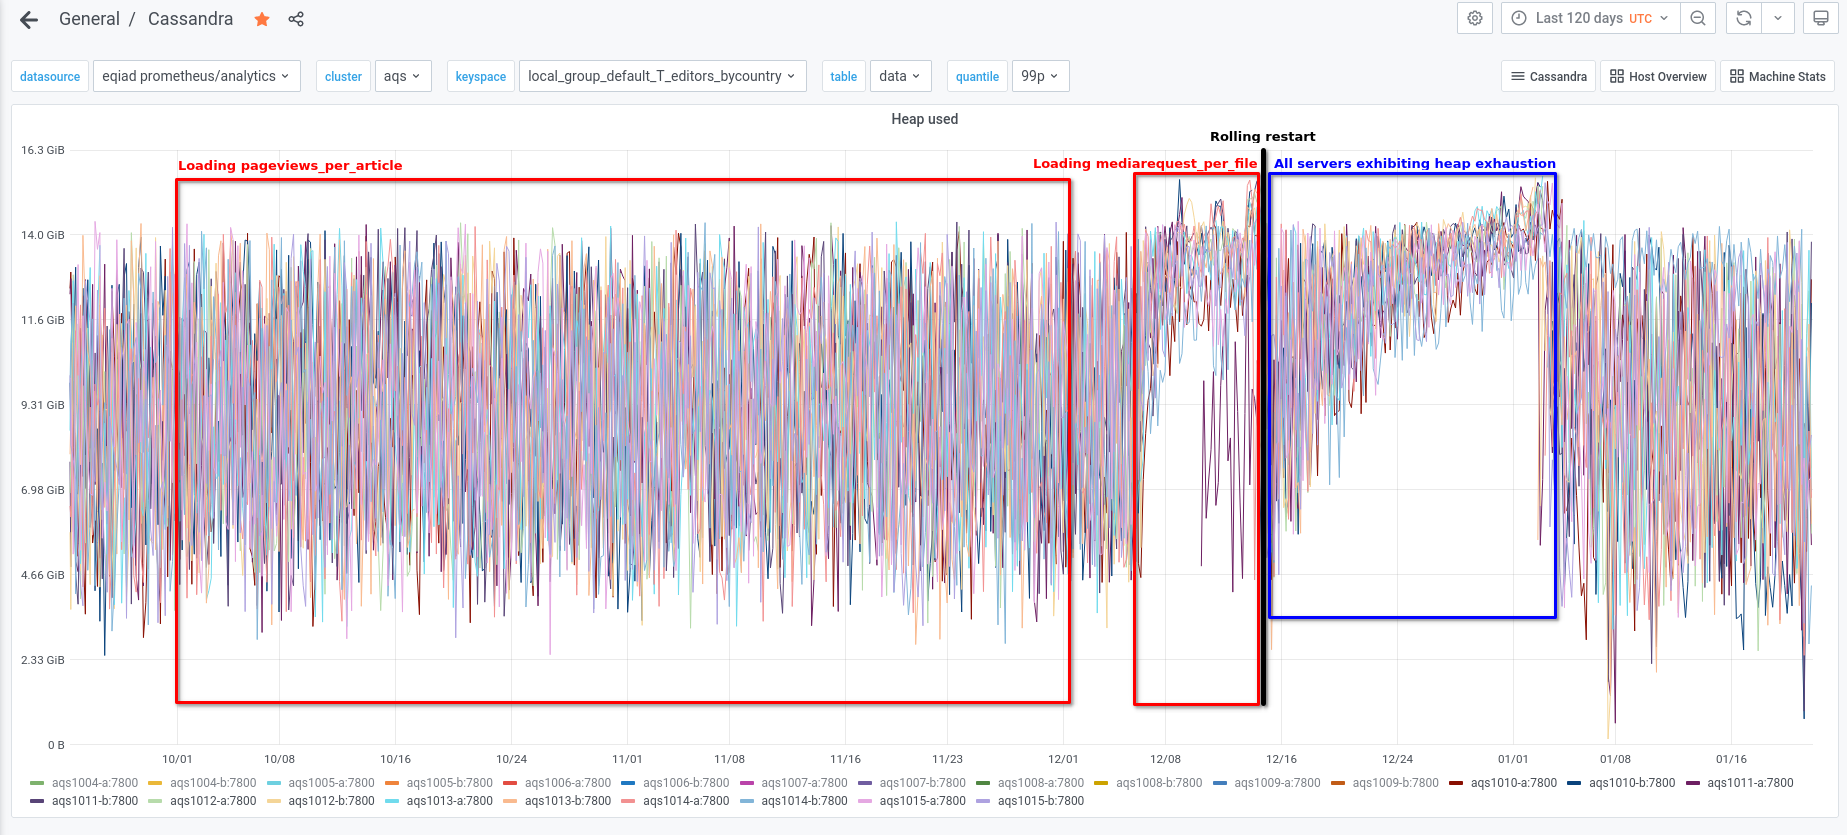
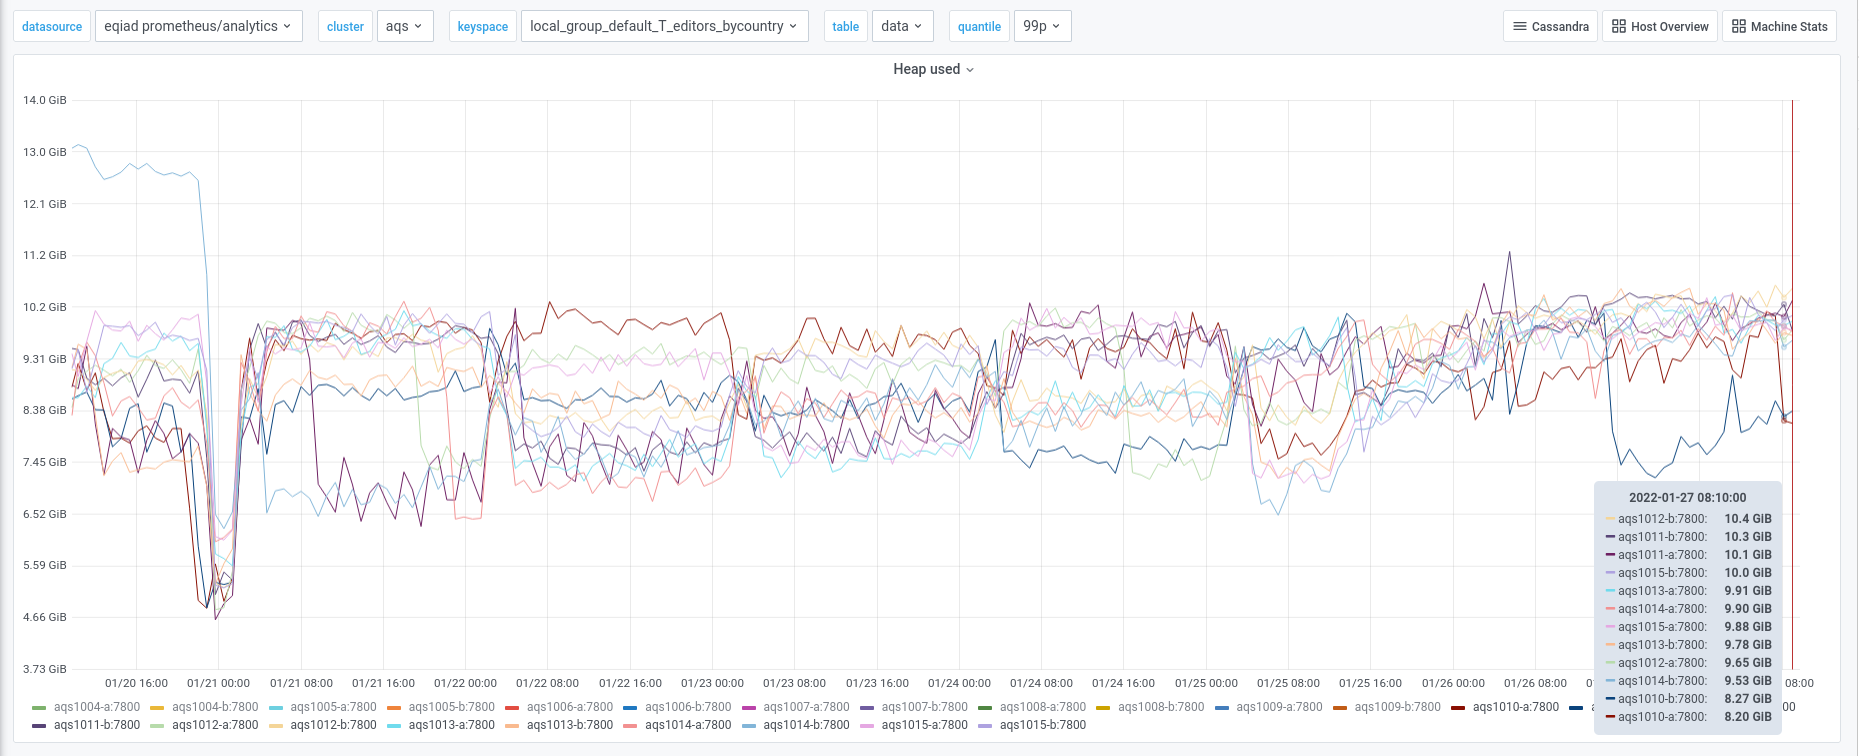
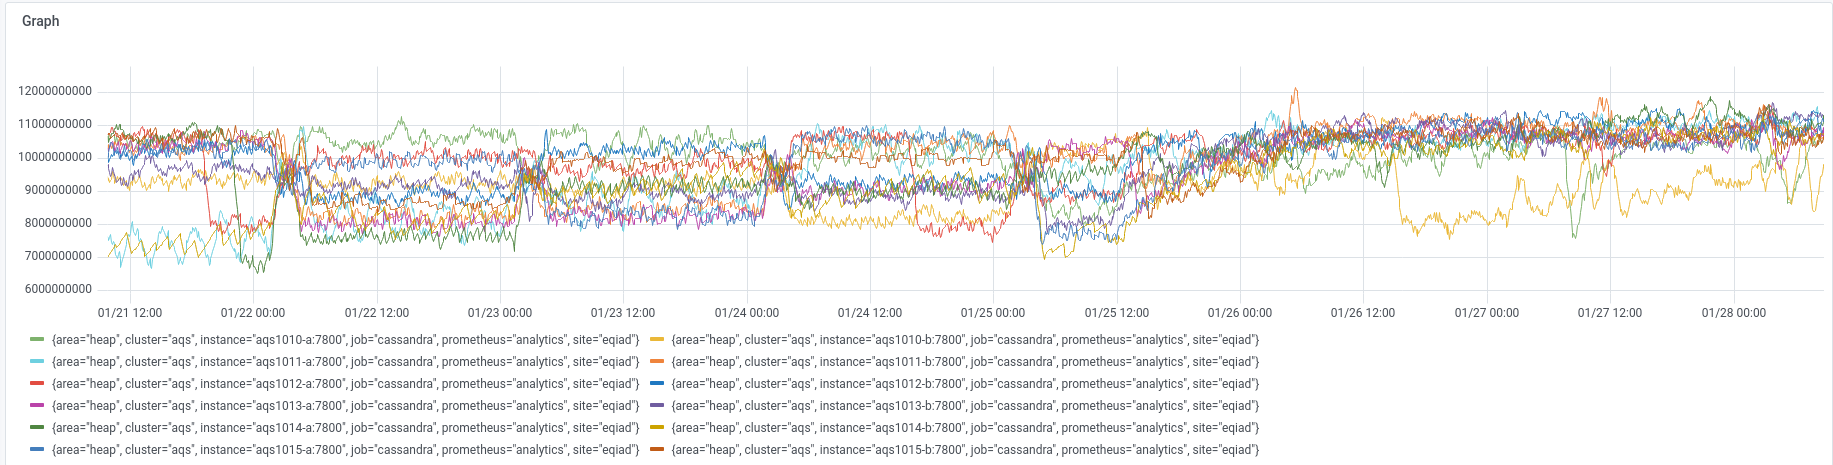
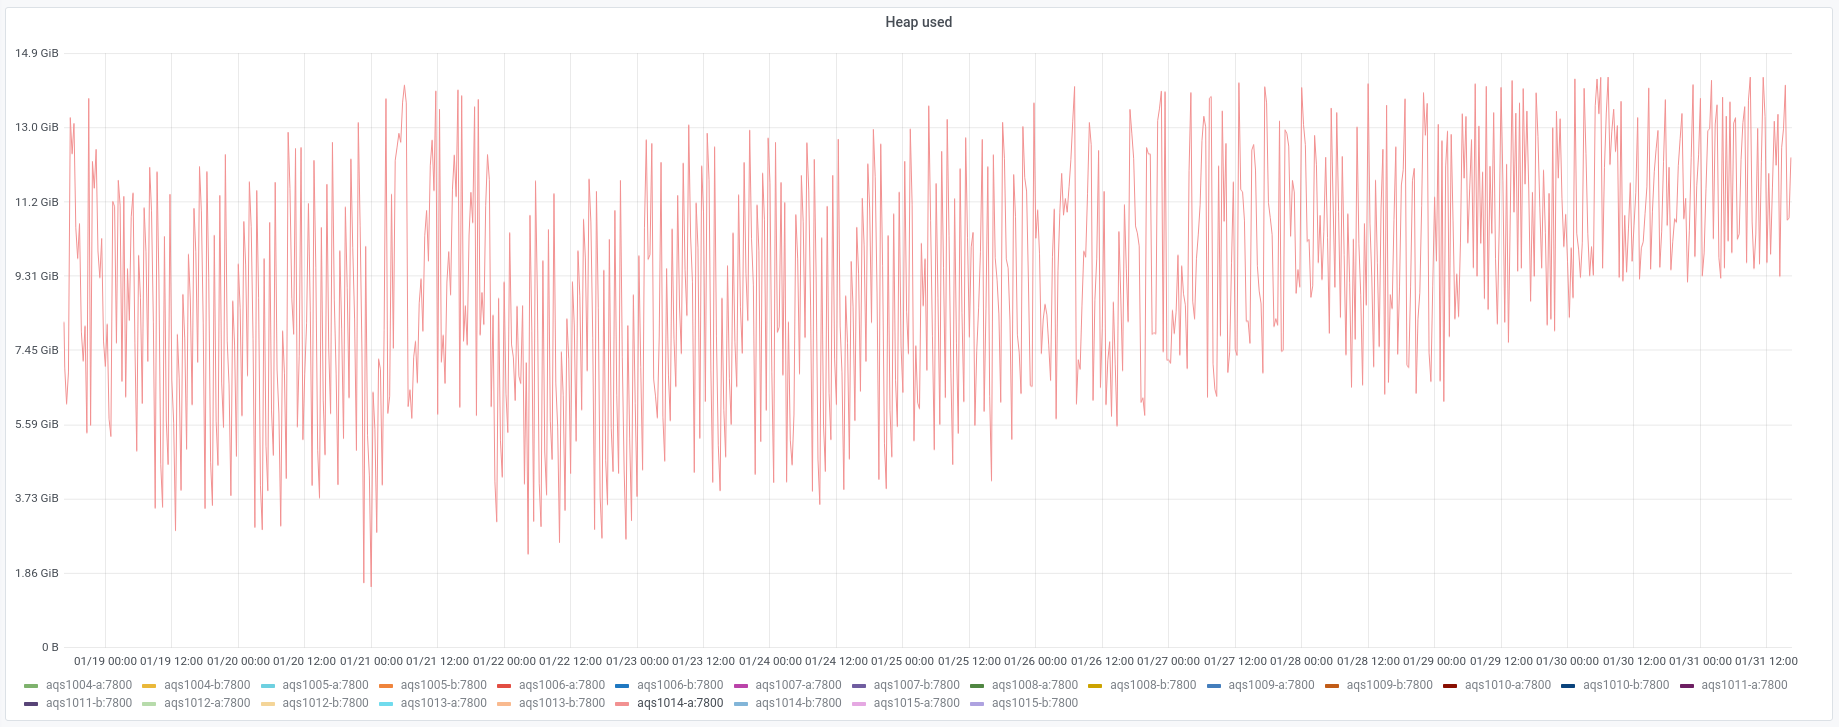
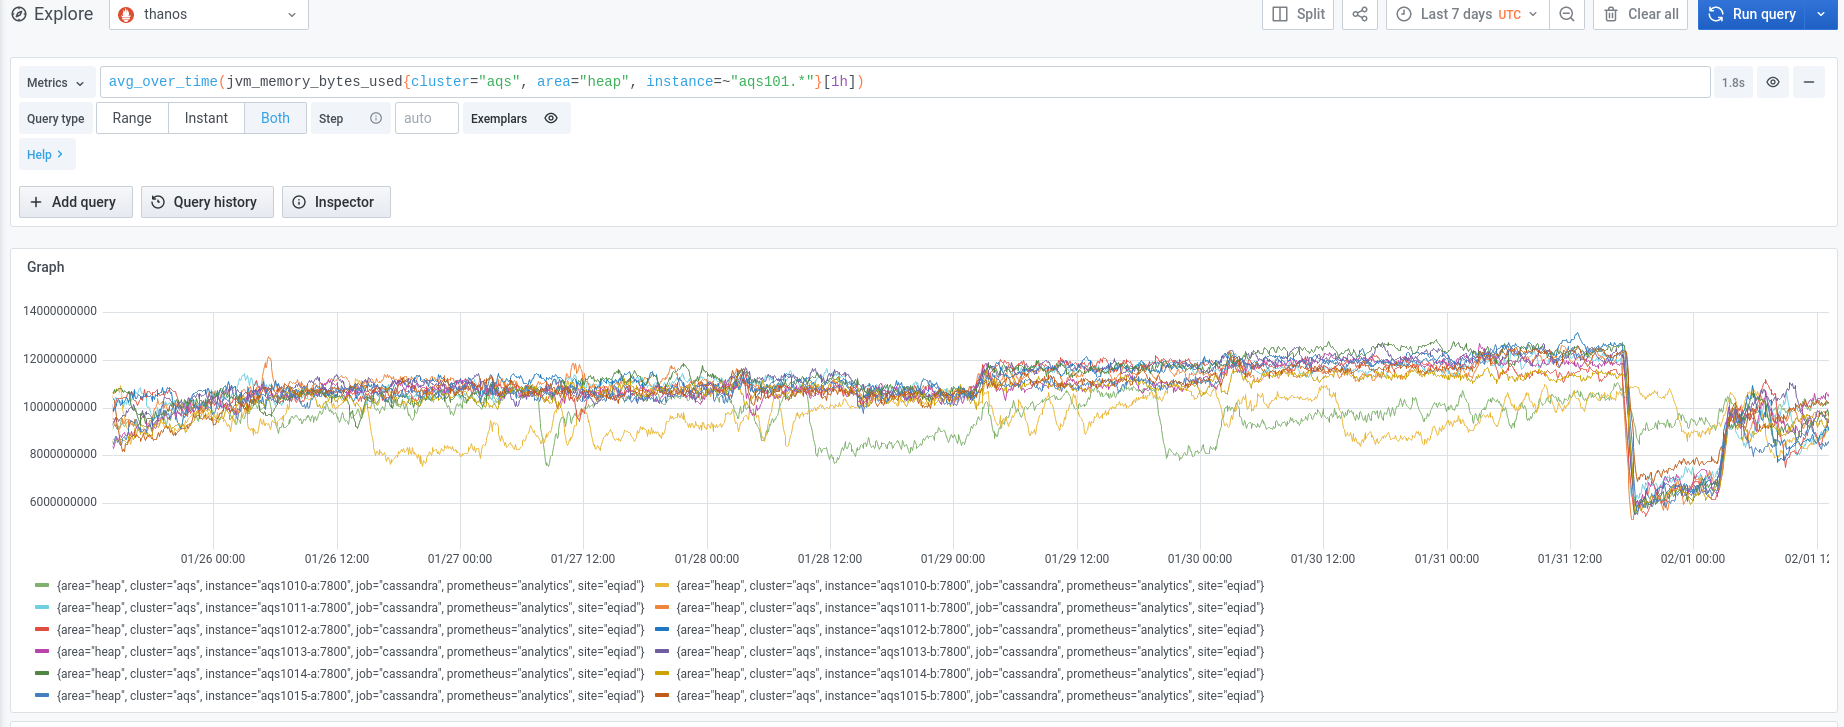
The following day, both of the other instances on the same hosts also exhibited high heap usage and high levels of GC.

  • The aqs1015-a instance was restarted at 10:20 UTC
  • The aqs1015-a instance was restarted at 10:39 UTC

We would like to understand more about this excessive heap usage and unresponsiveness, before we complete the migration.

Event Timeline

BTullis triaged this task as High priority.Jan 4 2022, 12:29 PM
BTullis moved this task from Next Up to In Progress on the Data-Engineering-Kanban board.

I have made a modification to the JVM row of the Cassandra dashboard in Grafana, which I feel adds some clarity around the garbage collection values.

image.png (913×1 px, 576 KB)

As per the guidelines here: https://www.robustperception.io/measuring-java-garbage-collection-with-prometheus

I have created separate graphs for:

  • Frequency of garbage collections
  • Average duration of garbage collections
  • Percentage of total time spent collecting garbage

As per the original graphs, these show both old and new generations, but I have also included a combined total percentage of time spent colelcting graph.

I think that these will be useful in tracking down further GC related issues.

For instance:

image.png (1×781 px, 249 KB)

We can clearly see here a correlation between pending compactions on aqs1004-a and an increase in young generation GC. The number of compactions peaks at 20, when we see approximately one young GC every 5 seconds.
The duration of each collection never goes above half of 1% of the total CPU time.

After the loading jobs that ended shortly after midnight UTC, the behaviour seems much improved compared to yesterday, but there are still some interesting observations and possibly some room for improvement.

image.png (1×1 px, 636 KB)

We can see a number of effects by delving into the graphs:

  • All Cassandra 3 servers spent more time doing GC than Cassandra 2 servers.
  • The Cassandra 2 loading finished more quickly than the Cassandra 3 loading.
  • Neither cluster spent any appreciable time doing old generation GC. It was all in young generation.
  • Cassandra 2 had more pending compactions after the loading than Cassandra 3.

@JAllemandou mentioned the differences in the loading mechanism yesterday, specifically that:

  • Cassandra 2 is loaded via a MapReduce job
  • Cassandra 3 is loaded via a Spark job
  • The batch size is configurable on the MapReduce job, whereas the Spark job is limited instead by a submission size in bytes and this tends to be much smaller than the Cassandra 2 batches. (Is this recollection correct @JAllemandou?)

Should we modify the way that the Cassandra 3 loading works, or do we think that no changes are required at the moment?

Looking at the last 30days of heap usage for 1010-a...

image.png (637×1 px, 112 KB)

You can see that after the node was restarted (between Dec 14 & 15), usage returned to something more normal looking; GC kicks in at around 13G, and drops to ~6GB after collection. Over time, less and less is collected (the graph flattens).

The other nodes of the new cluster look similar; For comparison, here is 1004-a (from the legacy cluster):

image.png (638×1 px, 131 KB)

We seem to be accumulating references over time, eventually we run short on room for new allocations, and the JVM thrashes.

A heap dump is likely to be the best means of identifying what is holding up all of this memory. For this to be most effective, we'll want the heap from a JVM that is prominently exhibiting the problem, which means letting at least one node go for a minimum of one week, preferably two.

Capturing the heap dump is straightforward (i.e. jmap -dump:[live],format=b,file=<file-path> <pid>), but analyzing one that is 16G is anything but. In the past, it has taken a host with about as much (free) system memory as the dump is large. Additionally, the (best) tools for this all have a graphical component, so it also needs to have a windowing system (which complicates grabbing a VM somewhere). Hopefully the tooling has gotten better since I last did this...

NOTE: Transferring the heap off-machine (or off-site) exposes the verbatim state of the database, but this should be OK; All data persisted in AQS is served verbatim via a public API, no PII is present.

Thinking ahead somewhat: Assuming we have identified the root cause, our next step would be to establish whether this is reproducible with the most recent Cassandra release. If it's a resource leak of some sort that has since been rectified, then upgrading would be the solution. If not, then we'd need to work on a patch, which should be against the latest release version so that we can commit it upstream. Frankly, we're also well past due for an upgrade.

Just skimming changelog entries between 3.11.4 (what we're running in production) and 3.11.11 (most current release), the following catch my eye:

However, there are over 200 changes between 3.11.4 and 3.11.11, so it's likely there are other candidates as well.


I propose the following (can be worked on concurrently):

  • Designate a node(s) to capture a heap dump (basically: avoid restarting until heap utilization portends a death spiral)
  • Designate a node to canary an upgrade to 3.11.11

The latter has proven difficult to accomplish cleanly in the past. Ideally, we'd be able to support an arbitrary number of Cassandra versions, and configure the version on a node-by-node basis. I'd very much like to get there one day, but inserting that as a dependency for this probably isn't pragmatic. What I have done previously is to disable Puppet for the duration of the test (to prevent it from attempting to downgrade), and then manually upgrade the node. I think we'd need to plan on having the node in this state for at least a couple of days (preferably a week).

Thoughts?

Could we give the upgrade a try to see if it resolves the memory leak, and if not only then proceed with the profiling?

Could we give the upgrade a try to see if it resolves the memory leak, and if not only then proceed with the profiling?

We need to wait a few days after upgrading to see whether or not that fixes it. While that's happening (starting now, actually) we can bring another node closer to that inflection point, and capture a dump.

Basically it costs us nothing to do both.

I propose to take aheap dump from aqs1014-b which has been running for 3 weeks and 2 days.
Its heap usage graph currently looks like this:

image.png (861×1 px, 271 KB)

Looking at the GC graphs, it is currently spending more time doing GC than any other instance, but I would not say that it yet portends a death spiral so I plan to leave it over the weekend and try to take a heap dump when it is at its worst.

image.png (804×1 px, 542 KB)

I'll try to analyse it on my workstation, which has 32 GB of RAM and X11.

I will take a heap dump now anyway, in case I can't catch it at a later state. It might be useful to diff the two (somehow) as well.

I have created the heap dump file. I had to chown to the cassandra user, as even root couldn't connect to the running JVM.

root@aqs1014:~# sudo su - cassandra -s /bin/bash
cassandra@aqs1014:~$ jmap -dump:live,format=b,file=/srv/cassandra-b/tmp/aqs1014-b-dump202201071450.hprof 4468
Dumping heap to /srv/cassandra-b/tmp/aqs1014-b-dump202201071450.hprof ...
Heap dump file created

The file is 13 GB in size.

Compressing the dump file:

root@aqs1014:/srv/cassandra-b/tmp# tar cjvf aqs1014-b-dump202201071450.hprof.bz2 aqs1014-b-dump202201071450.hprof
aqs1014-b-dump202201071450.hprof

I have placed the resulting 2.6 GB bzip2 file at aqs1014.eqiad.wmnet:/home/btullis/aqs1014-b-dump202201071450.hprof.bz2 in case you'd like to take a copy off-host for analysis @Eevans.
I'm currently transferring it to my workstation for analysis. The original, uncompressed 13 GB file is also still in /srv/cassandra-b/tmp.

If this host goes into a period of sustained GC I will take another heap dump using a similar method.

Perfect; Thanks @BTullis !

I've been looking at the dump captured on Friday, but I confess that I'm not really certain how to get much information from it.

image.png (769×1 px, 247 KB)

One thing that is immediately apparent upon loading it into VisualVM is that bytes as opposed to other native java or cassandra objects, take up the vast majority of the size of the dump 79.1%.

This would perhaps fit the hypothesis of a slow memory leak caused by either of the two candidates above, but whilst delving into a few of these memory structures structures at random I couldn't find any specific references to either CompressedChunkReader or CompressedSequentialWriter.

The situation hasn't got noticeably worse since Friday, so I haven't captured another dump yet.

image.png (732×1 px, 191 KB)

If anyone else has any ideas on how to get more useful information out of the dump file, that would be great.

[ ... ]
If anyone else has any ideas on how to get more useful information out of the dump file, that would be great.

Regrettably, I don't think VisualVM is up to this task. :(

I've requested an open source YourKit profiler license (yjp). Failing that, my best hope would be that MAT has made some strides since I last looked it. Updates to come...

I have created the heap dump file. I had to chown to the cassandra user, as even root couldn't connect to the running JVM.

root@aqs1014:~# sudo su - cassandra -s /bin/bash
cassandra@aqs1014:~$ jmap -dump:live,format=b,file=/srv/cassandra-b/tmp/aqs1014-b-dump202201071450.hprof 4468
Dumping heap to /srv/cassandra-b/tmp/aqs1014-b-dump202201071450.hprof ...
Heap dump file created

The file is 13 GB in size.

If you capture another, could you do so without the live option above (just in case)? I.e....

jmap -dump:format=b,file=/srv/cassandra-b/tmp/aqs1014-b-dump202201071450.hprof `cat /var/run/cassandra/cassandra-b.pid`

The trouble is that this pattern has bene stable for 7 days now. aqs1014-b is still fairly busy, with more GC than the other hosts, but it hasn't shown any old generation GCs for a week.

image.png (1×2 px, 553 KB)

I'm not sure at what point we should just restart it and continue with the migration.

I'm starting to work with mat and its ParseHeapDump.sh script on the existing dump file.

btullis@marlin:~/Downloads/MemoryAnalyzer-1.12.0.20210602-linux.gtk.x86_64/mat$ ./ParseHeapDump.sh ~/tmp/aqs1014-b-dump202201071450.hprof
Task: Parsing aqs1014-b-dump202201071450.hprof
[Task: Parsing /home/btullis/tmp/aqs1014-b-dump202201071450.hprof
[
Subtask: Scanning /home/btullis/tmp/aqs1014-b-dump202201071450.hprof
[
[INFO] Detected compressed references, because with uncompressed 64-bit references the array at 0x3c001bb80 would overlap the array at 0x3c001bb60
[....................
[INFO] Wrote threads call stacks to /home/btullis/tmp/aqs1014-b-dump202201071450.threads
[....................
[INFO] Heap /home/btullis/tmp/aqs1014-b-dump202201071450.hprof contains 69,267,488 objects
[....................
Subtask: Extracting objects from /home/btullis/tmp/aqs1014-b-dump202201071450.hprof
`

Will report back if there is anything interesting.

Change 754988 had a related patch set uploaded (by Btullis; author: Btullis):

[operations/puppet@production] Deploy the dev version of cassandra to aqs1010.eqiad.wmnet

https://gerrit.wikimedia.org/r/754988

By way of an update:

Heap utilization since the 4th has remained stable. Our canary (1014-b) continues to be tight -but hasn't worsened- and none of the other nodes have regressed (1010-a shown in the graph below, for comparison).

image.png (722×1 px, 414 KB)

I suggest we proceed with the upgrade of 1010 as planned, perform a rolling restart of all nodes, and consider adding some production back while we monitor.

I'm happy to tackle the 1010 update tomorrow (and barring that, Monday?), if that is OK with everyone.

That's great. Thanks for the updated patch Eric. I'm happy for you to go ahead and upgrade aqs1010 whenever you like.

Change 754988 merged by Btullis:

[operations/puppet@production] Deploy the dev version of cassandra to aqs1010.eqiad.wmnet

https://gerrit.wikimedia.org/r/754988

I've merged and deployed the patch, then checked with a puppet run on aqs1010.
The new version of cassandra is ready to be installed whenever you're ready @Eevans.

btullis@aqs1010:~$ apt-cache policy cassandra
cassandra:
  Installed: 3.11.4
  Candidate: 3.11.11
  Version table:
     3.11.11 1001
       1001 http://apt.wikimedia.org/wikimedia buster-wikimedia/component/cassandradev amd64 Packages
 *** 3.11.4 100
        100 /var/lib/dpkg/status
     2.2.6-wmf5 1001
       1001 http://apt.wikimedia.org/wikimedia buster-wikimedia/main amd64 Packages

Mentioned in SAL (#wikimedia-operations) [2022-01-20T20:37:45Z] <urandom> upgrading Cassandra to 3.11.11, aqs1010 -- T298516

Change 755800 had a related patch set uploaded (by Eevans; author: Eevans):

[operations/puppet@production] Pin Cassandra 3.11.11 as 'dev'

https://gerrit.wikimedia.org/r/755800

Change 755800 merged by Cwhite:

[operations/puppet@production] Pin Cassandra 3.11.11 as 'dev'

https://gerrit.wikimedia.org/r/755800

Mentioned in SAL (#wikimedia-operations) [2022-01-20T22:27:08Z] <urandom> rolling restart of Cassandra, aqs-next -- T298516

@JAllemandou noticed several really interesting thing about the Java heap graphs, which might affect how we proceed with this migration.
Firstly, it looks like there is some correllation between the loading of the mediarequest_per_file table (otherwise known as the big table) and the subsequent memory exhaustion.
The loading of the the pageviews_per_article table (otherwise known as the huge table), was completed well before the big table was started and didn't cause this behaviour.

image.png (835×1 px, 880 KB)

The loading of the big table was complete, including all of the subsequent compactions, by December 14th (T291470#7565812) and a rolling reboot of the aqs_next cluster was carried out on December the 15th.
The heap exhaustion started happening after this rolling reboot, despite not having any particular stress of compactions or loading operations going on at the same time.

Scratch that previous theory...

Now I look at it more closely, the heap exhaustion seems to correlate much more closely with when aqs1010 was pooled and receiving queries.
The strange thing is that only one host was pooled, but all hosts exhibited the behaviour.

image.png (843×1 px, 689 KB)

My theory is that it is this bug which is affecting us: Memory leak in CompressedChunkReader

i.e. all the time we are adding data to the cluster, everything is fine. No memory leak.
Whenever we start receiving read requests from the AQS app, the CompresssedChunkReader function comes into play and starts leaking memory.
If the reads are distributed between cluster members then every instance would be leaking memory, irrespective of which node received the client request.

In order to test this theory, I believe that we should:

  1. Pool one node - but not aqs1010
  2. Watch the graphs of the heap over a few days.

If the theory is correct, then we would expect to see all nodes except aqs1010 exhibit heap exhaustion.
If this happens, that at this point we could say that the upgrade to 3.11.11 fixes the issue and that it should be deployed to the remainder of aqs_next.

If we do not see heap exhaustion even under read load, then we could choose to roll back aqs1010 and complete the migration using 3.11.4 if we wish, or proceed with a plan to roll out 3.11.11 to the rest of the cluster and then complete the migration.

@JAllemandou - @Eevans - What do you think?

If you agree, then I'm ready at any time to do this:

btullis@puppetmaster1001:~$ sudo -i confctl select name=aqs1011.eqiad.wmnet set/pooled=yes

That would send traffic to the two instances on aqs1011 and we could start looking for the heap exhaustion from that point.

Suggestion from @JAllemandou is to wait until mid-week (maybe Tuesday morning 2022-01-25) before pooling it.
Then we've had a few days to monitor aqs1010 with 3.11.11 under normal loading conditions. We will have a few work days in a row to monitor the cluster's behaviour under a little read load.

Scratch that previous theory...

Now I look at it more closely, the heap exhaustion seems to correlate much more closely with when aqs1010 was pooled and receiving queries.
The strange thing is that only one host was pooled, but all hosts exhibited the behaviour.

image.png (843×1 px, 689 KB)

My theory is that it is this bug which is affecting us: Memory leak in CompressedChunkReader

Possibly, but the trend seems to start prior to when it was pooled (it seems to begin right after the restart). It also doesn't explain the period preceding that, from ~6th to ~11th.

i.e. all the time we are adding data to the cluster, everything is fine. No memory leak.
Whenever we start receiving read requests from the AQS app, the CompresssedChunkReader function comes into play and starts leaking memory.
If the reads are distributed between cluster members then every instance would be leaking memory, irrespective of which node received the client request.

Strictly speaking, I think CompressedChunkReader is used elsewhere as well (compaction, for example).

In order to test this theory, I believe that we should:

  1. Pool one node - but not aqs1010
  2. Watch the graphs of the heap over a few days.

If the theory is correct, then we would expect to see all nodes except aqs1010 exhibit heap exhaustion.
If this happens, that at this point we could say that the upgrade to 3.11.11 fixes the issue and that it should be deployed to the remainder of aqs_next.

If we do not see heap exhaustion even under read load, then we could choose to roll back aqs1010 and complete the migration using 3.11.4 if we wish, or proceed with a plan to roll out 3.11.11 to the rest of the cluster and then complete the migration.

@JAllemandou - @Eevans - What do you think?

I think this is consistent with the current/last plan, so SGTM.

Suggestion from @JAllemandou is to wait until mid-week (maybe Tuesday morning 2022-01-25) before pooling it.
Then we've had a few days to monitor aqs1010 with 3.11.11 under normal loading conditions. We will have a few work days in a row to monitor the cluster's behaviour under a little read load.

Yes, +1 (no sooner than Monday, anyway)

@BTullis: Regarding which node(s) to (re)pool (presumably tomorrow, Jan 25?)...

It shouldn't matter (much) which are/are not pooled. The requests are fielded by RESTBase, each instance of which will distribute requests across all the nodes of the cluster (each of which can in turn serve as coordinator, if needed). Other than perhaps contention for resources under very heavy load (Cassandra v RESTBase), I can't see any reason for a meaningful correlation.

Put another way: I assume that if the first node to fall over last time was also the one pooled, that this was a red herring. So if we see that again, I'd be very interested see what happens if we move the pooled node (it would make for a noteworthy data point).

After 2 days I think we can begin to see the pattern that we were expecting. Namely that aqs1010 has lower average heap memory use than the other members of the aqs_next cluster.
In order to smooth out the regular GCs I applied an avg_over_time[1h] function to the graph, but we can now see that aqs1010-[ab] have significanlty less heap usage than the other servers.

Screenshot from 2022-01-27 09-45-04.png (756×1 px, 415 KB)

We can use this explore link in Garafana to keep an eye on this over the next few days, rather than having to keep editing the cassandra dashboard.

I'd say that the pattern is clearer again this morning, with both aqs1010 instances exhibiting less average heap usage, and the other instances clearly becoming constrained under pressure from read activity.

image.png (465×1 px, 326 KB)

@Eevans - what course of action do you think we should take next?

  • Should we leave aqs1011 pooled over the weekend?
  • Should we aim to take heap dumps of a 3.11.4 and a 3.11.11 node at a time of extreme memory pressure?
  • Should we start planning to roll out 3.11.11 to other canaries in other Cassandra clusters?

I think that the DE team is keen to leave it running over the weekend to gether more data, but if you have any other suggestions or recommendations please feel free to advise.

[ ... ]

@Eevans - what course of action do you think we should take next?

  • Should we leave aqs1011 pooled over the weekend?
  • Should we aim to take heap dumps of a 3.11.4 and a 3.11.11 node at a time of extreme memory pressure?
  • Should we start planning to roll out 3.11.11 to other canaries in other Cassandra clusters?

I think that the DE team is keen to leave it running over the weekend to gether more data, but if you have any other suggestions or recommendations please feel free to advise.

Sorry, I meant to reply yesterday, and lost track of it...

I concur with the pattern that seems to be developing, and I too would be interested to see things play out for a more days; I think we can make it through the weekend.

As a next-step, I propose to complete the upgrade to 3.11.11, and repeat the test for a comparable duration.

I'm happy to pick that up first thing Monday, if everyone agrees.

As a next-step, I propose to complete the upgrade to 3.11.11, and repeat the test for a comparable duration.
I'm happy to pick that up first thing Monday, if everyone agrees.

Sounds good to me.

Change 757998 had a related patch set uploaded (by Eevans; author: Eevans):

[operations/puppet@production] Fold-in (minor) upstream configuration changes

https://gerrit.wikimedia.org/r/757998

Change 757999 had a related patch set uploaded (by Eevans; author: Eevans):

[operations/puppet@production] Upgrade remaining aqs_next nodes to 'dev' (Cassandra 3.11.11)

https://gerrit.wikimedia.org/r/757999

For posterity sake:

1010-b / 3.11.11
image.png (723×1 px, 384 KB)
1014-a / 3.11.4
image.png (727×1 px, 327 KB)

@JAllemandou @BTullis What do yo think? Shall we proceed?

Yes ! The pattern difference is even more visible here.

Change 757999 merged by Btullis:

[operations/puppet@production] Upgrade remaining aqs_next nodes to 'dev' (Cassandra 3.11.11)

https://gerrit.wikimedia.org/r/757999

@Eevans is going to go ahead with the upgrade of the remaining nodes.

Mentioned in SAL (#wikimedia-operations) [2022-01-31T16:53:18Z] <urandom> restarting Cassandra, aqs1011-{a,b}, to apply upgrade to 3.11.11 -- T298516

Mentioned in SAL (#wikimedia-operations) [2022-01-31T17:03:57Z] <urandom> restarting Cassandra, aqs1012-{a,b}, to apply upgrade to 3.11.11 -- T298516

Mentioned in SAL (#wikimedia-operations) [2022-01-31T17:11:06Z] <urandom> restarting Cassandra, aqs1012-{a,b}, to apply upgrade to 3.11.11 -- T298516

Mentioned in SAL (#wikimedia-operations) [2022-01-31T17:11:19Z] <urandom> restarting Cassandra, aqs1013-{a,b}, to apply upgrade to 3.11.11 -- T298516

Mentioned in SAL (#wikimedia-operations) [2022-01-31T17:15:45Z] <urandom> restarting Cassandra, aqs1014-{a,b}, to apply upgrade to 3.11.11 -- T298516

Mentioned in SAL (#wikimedia-operations) [2022-01-31T17:23:50Z] <urandom> restarting Cassandra, aqs1015-{a,b}, to apply upgrade to 3.11.11 -- T298516

The upgrade to 3.11.11 is complete.

Thanks a lot @Eevans for the upgrade!
I assume we'll leave it bake for a few days before pooling more nodes - right?

Thanks a lot @Eevans for the upgrade!
I assume we'll leave it bake for a few days before pooling more nodes - right?

If we want an apples/apples comparison to the last week, we can let it simmer like this for the next. The alternative would be to take it on good faith that it's Problem Solved™, and move ahead. I don't feel passionately about this one way or the other (and am in no particular hurry), so I'll leave that to you all.

Looks good to me too.

image.png (727×1 px, 303 KB)

I'm happy to wait a couple more days to be sure, then pool all of the remaining servers and switch off the old ones.

Change 757998 merged by Btullis:

[operations/puppet@production] Fold-in (minor) upstream configuration changes

https://gerrit.wikimedia.org/r/757998

Pooled the new servers. Marking this investigation as complete.