Page MenuHomePhabricator

[cloudvps] grafana stats for haproxy response time give different data on refresh
Closed, ResolvedPublic

Assigned To
Authored By
dcaro
Aug 9 2023, 9:50 AM
Referenced Files
F37379757: image.png
Aug 10 2023, 9:38 AM
File Not Attached
F37374324: image.png
Aug 9 2023, 11:10 AM
F37374317: image.png
Aug 9 2023, 11:10 AM
F37373596: image.png
Aug 9 2023, 10:10 AM
F37373256: Screenshot from 2023-08-09 10-49-24.png
Aug 9 2023, 10:10 AM
F37373255: Screenshot from 2023-08-09 10-49-37.png
Aug 9 2023, 10:10 AM

Description

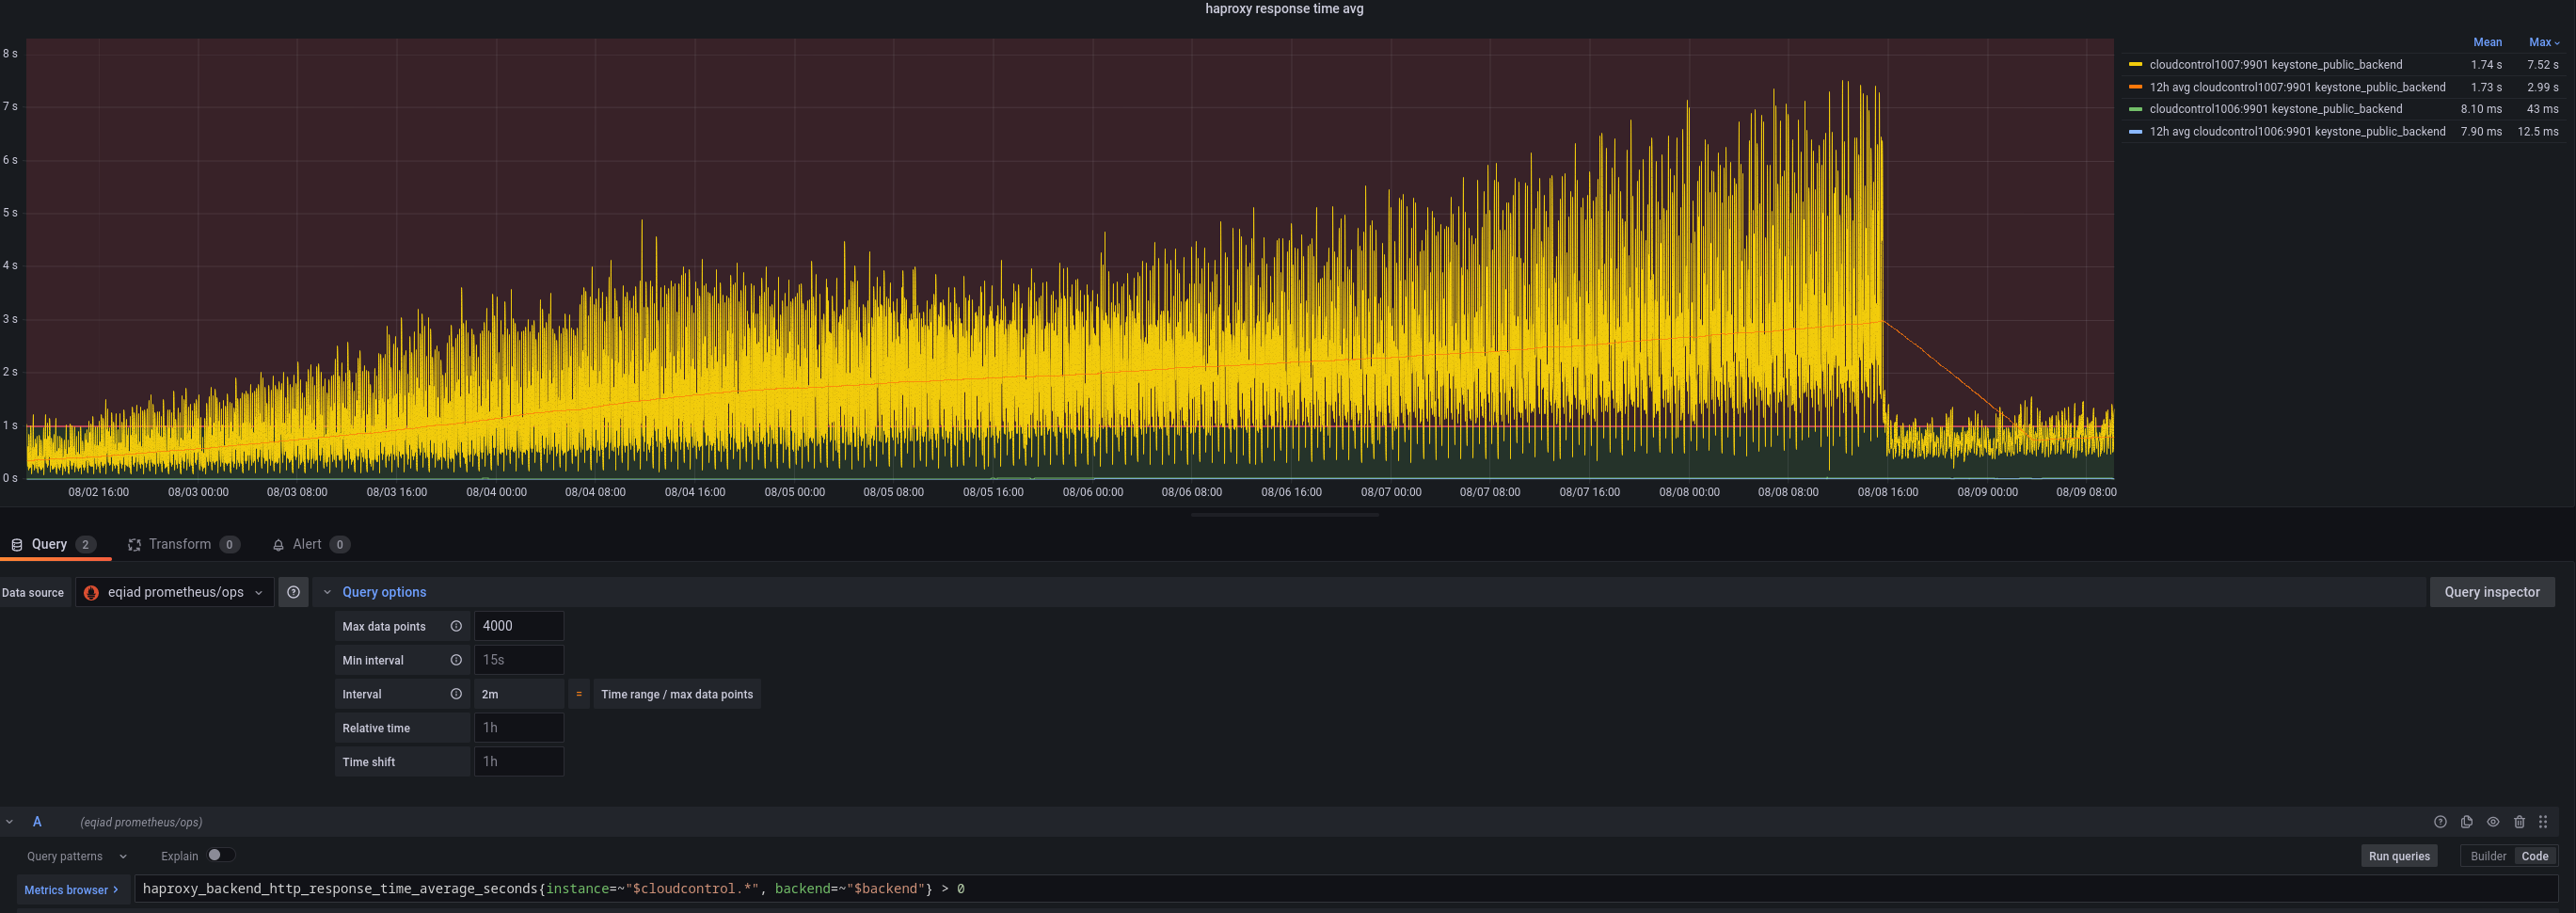
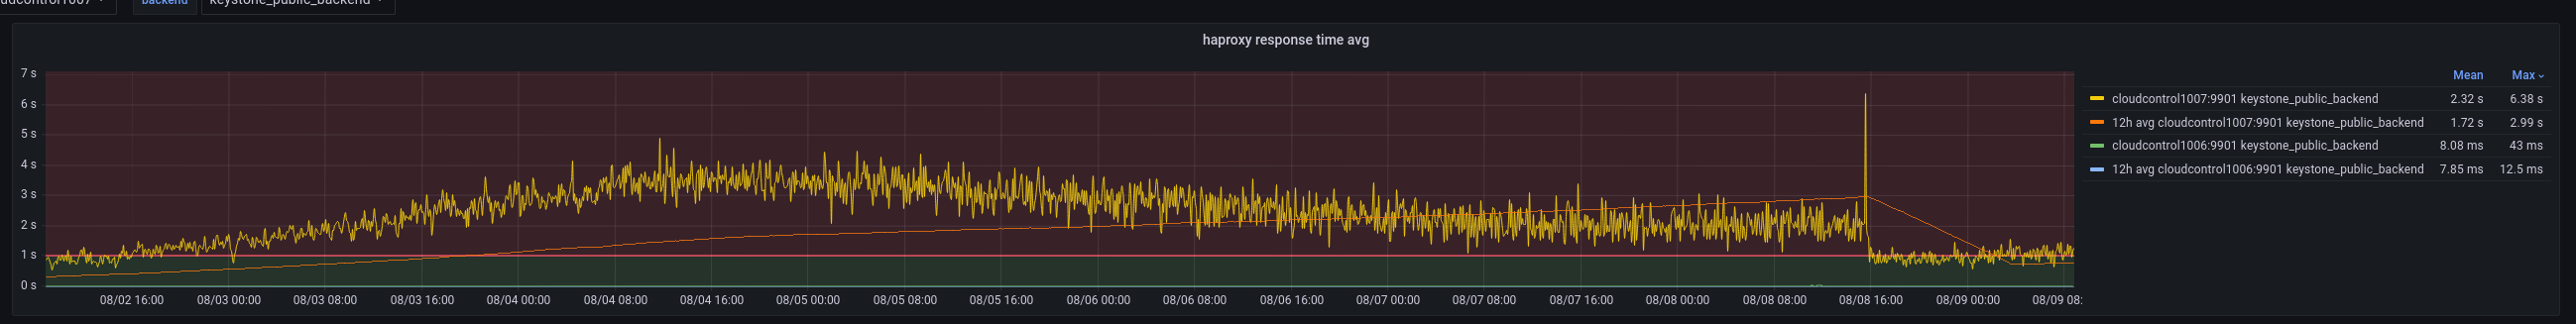
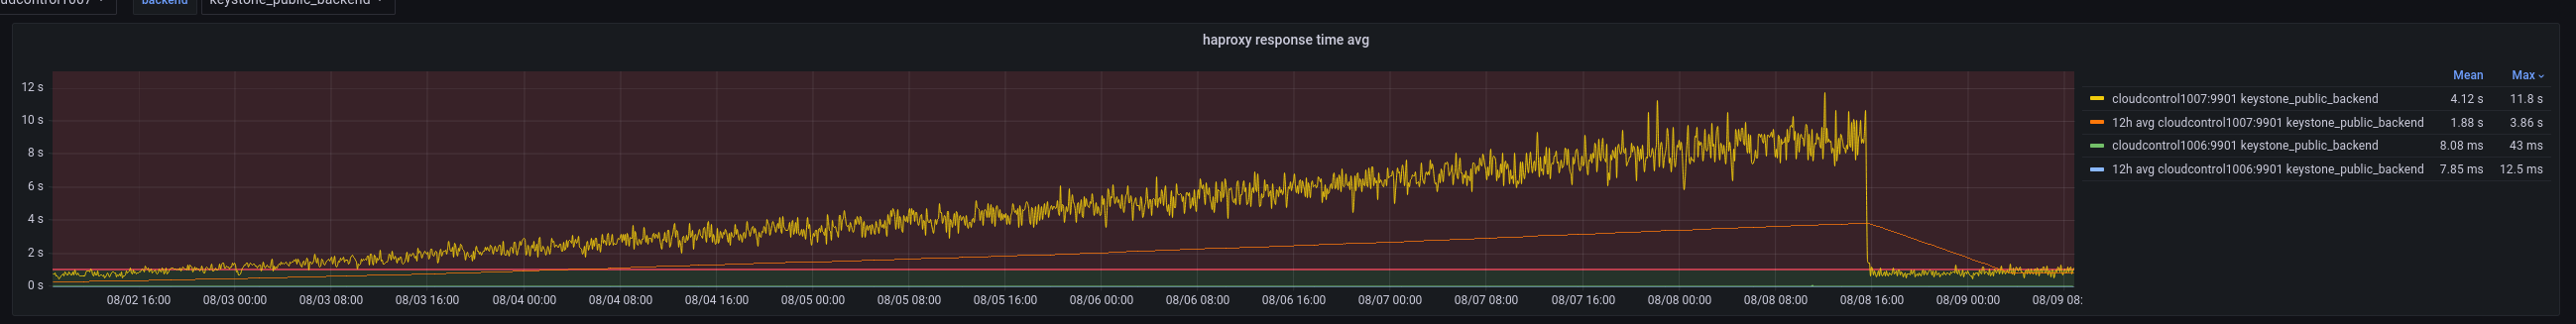
When going to the grafana board:

https://grafana-rw.wikimedia.org/d/UUmLqqX4k/openstack-api-performance?orgId=1&refresh=30s&var-cloudcontrol=cloudcontrol1006&var-cloudcontrol=cloudcontrol1007&var-backend=keystone_public_backend&from=now-7d&to=now

If you refresh you might get sometimes a different set of data for the same metrics, making the graps not consistent.

This task is to investigate and hopefully fix/remediate the issue so we get reliable data.
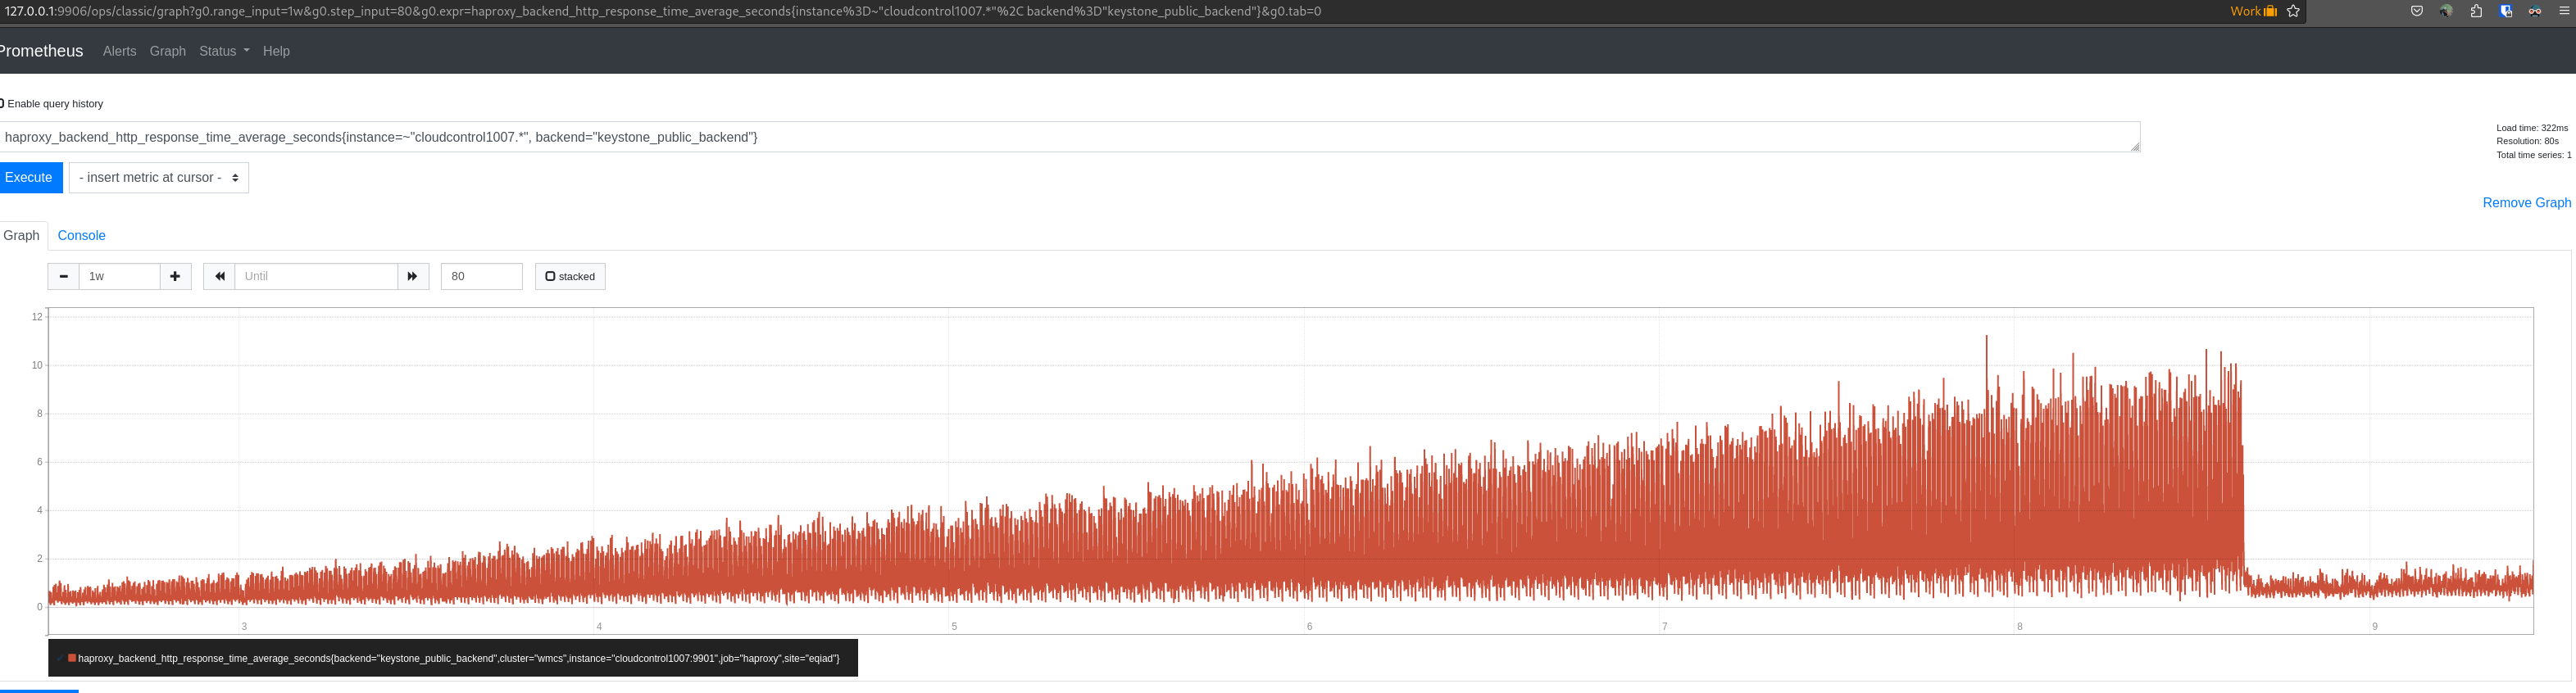
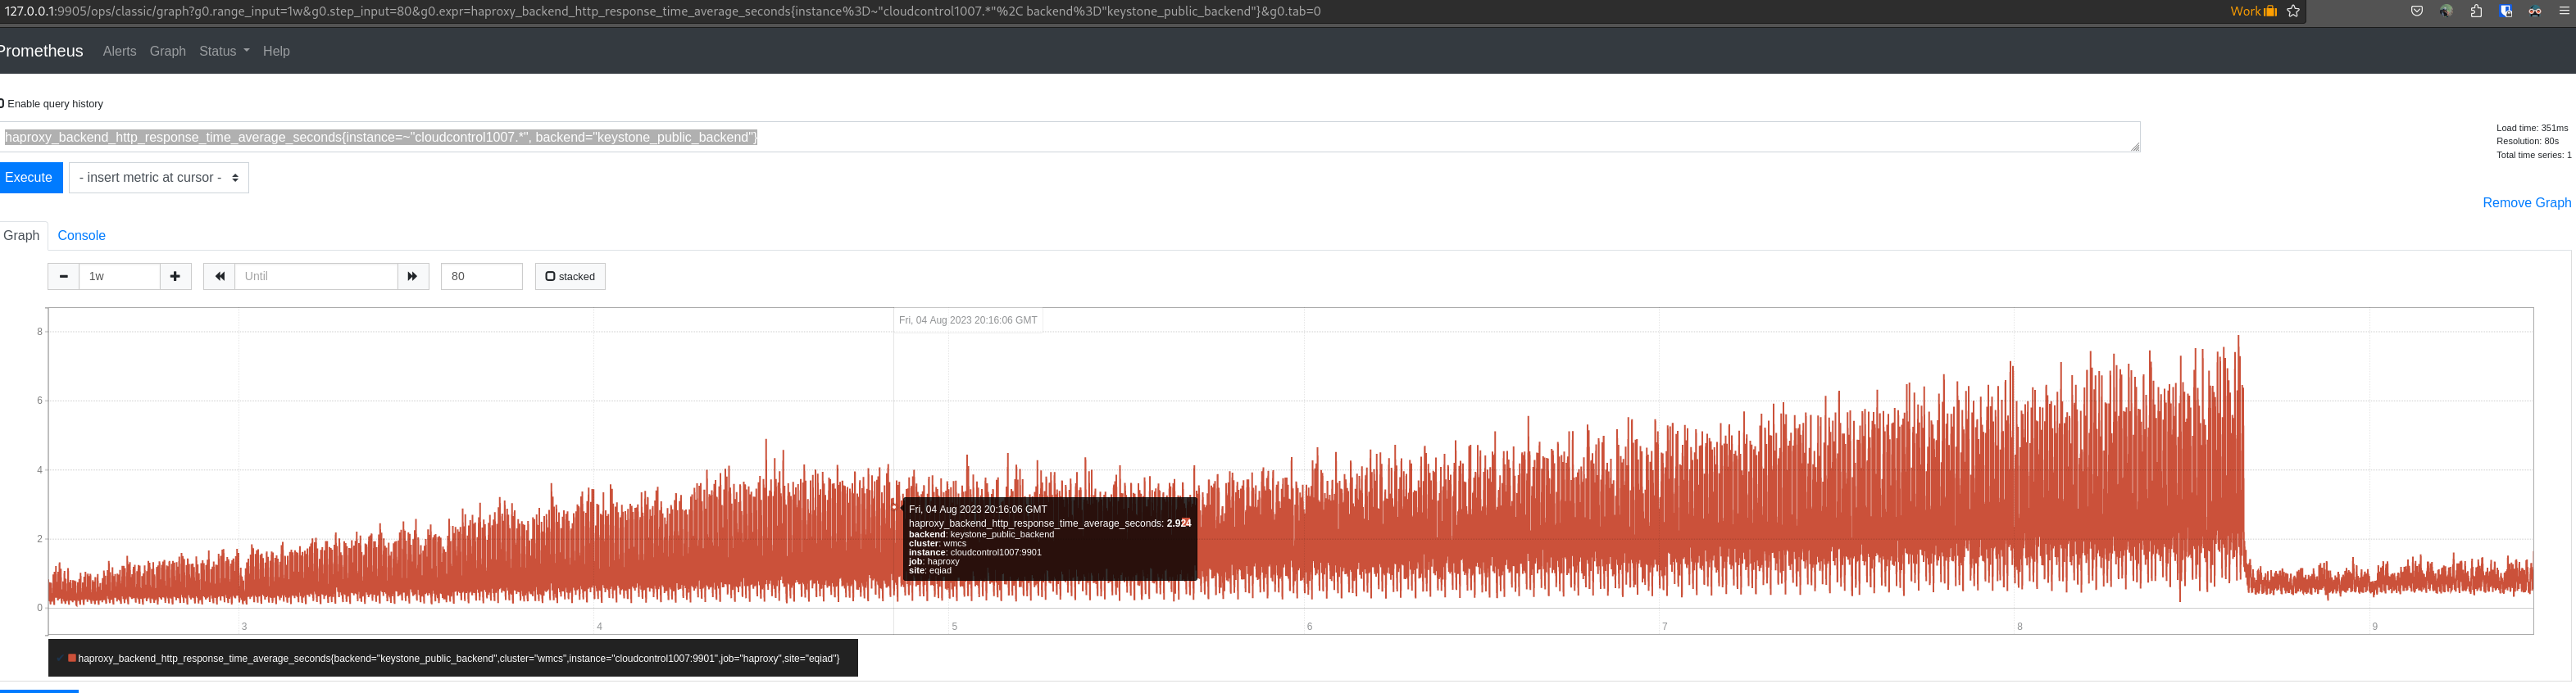
Examples:

Screenshot from 2023-08-09 10-49-37.png (327×2 px, 160 KB)

Screenshot from 2023-08-09 10-49-24.png (327×2 px, 133 KB)

There were some issues with scraping haproxy for traffic, and they tried disabling keep-alive, so I backported their patch also to see if it helped:
https://gerrit.wikimedia.org/r/c/operations/puppet/+/947325

But did not so far.

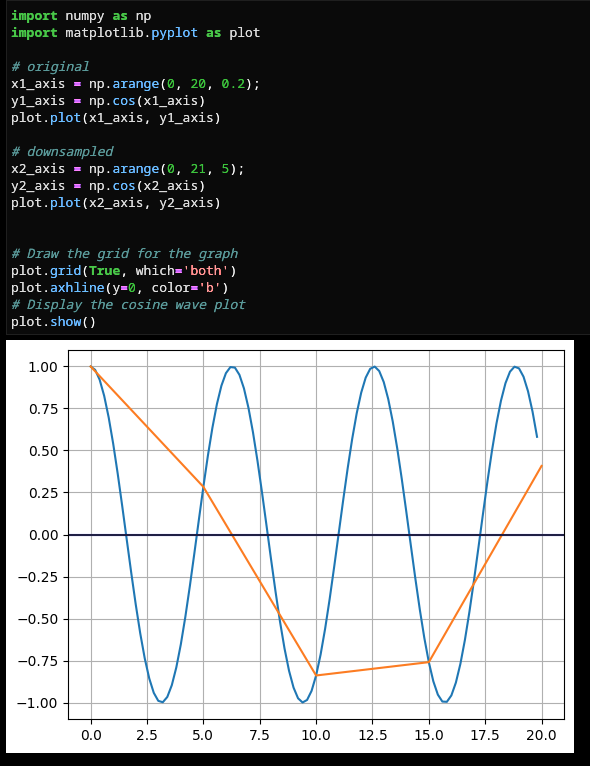
It might be a 'spikey' graph issue, where the filtering of number of values retrieved from the backend might end up getting rid of the spikes:

image.png (970×2 px, 633 KB)

Event Timeline

dcaro triaged this task as High priority.Aug 9 2023, 9:50 AM
dcaro created this task.

Haproxy seems to already expose a prometheus metrics endpoint, but we are using an exporter (deprecated according to their docs):

# exposed endpoint from haproxy
dcaro@cloudcontrol1007:~$ curl --silent 'http://127.0.0.1:9900/metrics' 

# exporter metrics
dcaro@cloudcontrol1007:~$ curl --silent 'http://127.0.0.1:9901/metrics'

We should probably switch to use directly haproxy.

Also, looking into the metrics, we are using the aggregated backend response time, we might want to switch to server specific (so we know which cloudcontrol in the pool is misbehaving if any)

The aggregation happens on the prometheus side, so we have different data already on each prometheus:

image.png (846×3 px, 150 KB)

vs
image.png (846×3 px, 176 KB)

Note that the max, average and min are different.

Hmm, here's some of my thinking so far.

There's several aspects here:

What could be happening

Downsampling

When you request data from prometheus in grafana, it retrieves a set amount of points (depending on the size of the graph in your screen by default). For a stat that fluctuates a lot, this means that the final graph might be quite different than the original values, like in the following example for cos:

image.png (766×590 px, 85 KB)

(https://public-paws.wmcloud.org/User:Dcaroest/Downsampling.ipynb)

Where the nice wave (blue) becomes a longer period wave (red).

Now, this happens twice, once between grafana and prometheus, and between prometheus and the actual statistic (from the host).

Two measurements

Another issue is that we get two different data sets, one for each prometheus that queries haproxy, and of course, they get different values (as expected).

In theory, both datasets should have similar mean and standard deviation, but the issue is that they have significantly different values. And even with the above quantile or the average they might differ 25% in value.

This rises two concerns:

  • The measured absolute value is not reliable - I think this is not a big issue, as we care more about changes in behavior than absolute value
  • We get a graph that jumps between datasets depending on the prometheus host it hits - I think this is a bigger issue, giving an inconsistent view of the system and possibly getting alerts when there should not be.

Some proposals

Downsampling

For the downsampling between grafana and prometheus, I propose using the 95th percentile (or similar, something like quantile(0.95, avg_over_time(haproxy_backend_http_response_time_average_seconds{instance=~"$cloudcontrol.*", backend=~"$backend"}[15m]))), that gets rid of the random high and low values.

For the dowsampling between prometheus and haproxy, a couple options come to mind:

  • change the frequency, if it turns out that the original statistic has a cycle that's a submultiple of the sampling period, you can get weird misleading data. Not sure we have this issue (might explain the big difference between both prometheus hosts though)
  • increase the frequency/amount of points, this gives better samples, but uses more space/resources/etc.
  • add an aggregation layer on the host that essentially does the aggregation so prometheus does not have to store the values itself.

I think though that the quantile solution above gives a good enough signal to not need to spend more effort on the aggregating layer. We can revisit this downsampling point if we don't get enough signal with the quantile fix.

Two measurements

Asked @fgiunchedi if it's possible to decouple both datasets on the grafana UI, and the answer is yes, by querying thanos datasource (instead of eqiad/ops) and selecting the site and the pormetheus host:

'''
godog: dcaro: yeah the easiest is to switch to thanos, then you can use 'site' and 'prometheus' labels to select which one you want, results will be joined under the hood
11:03:29 ...{site="eqiad", prometheus="ops"} in your case
'''

We can also try to graph the "delta" of the function, this is the rate of increment or decrement in relation of the absolute value (ex. in percent), and use that, as it should be somehow similar for both, but requires some extra prometheusql magic.

Something else that I found is that we are using the aggregated backend statistics, that mix the metrics for all the servers of the same backend (ex. cloudcontrol1005, 1006 and 1007 for the kyestone_public backend), while we might want to split that per-server/backend combination, given that we have a primary-fallback load balancing mixing low-traffic server metrics with high-traffic ones pollutes the data a bit (as usually low-traffic ones tend to be flakier due to the lack of data, while high-traffic ones tend to be more stable).

There is a third "downsampling" happening inside haproxy itself, even worse than downsampling because it doesn't take 1 sample every x, but it takes the "last 1024 requests":

In the second link above, they suggest collecting metrics from haproxy logs instead, which is also the suggestion in this blog post.

At the moment prometheus is reading the haproxy metric every minute, so if we get less than 1024 requests per minute this is not a problem, but the more requests we get, the more the "average of last 1024 requests" might drift away from the actual average.

dcaro moved this task from To refine to Done on the User-dcaro board.