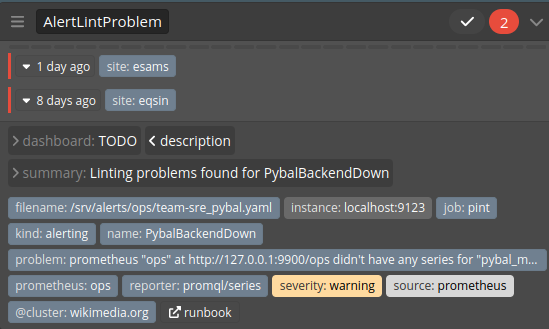
There's been an alert for AlertLintProblem for a few sites:
This is caused by no metrics actually existing for any of the instances in the sites in question. The pybal_monitor_down_results_total metric is never initialized until a failure event occurs; Any PyBal instance that always remains healthy will be marked by AlertLintProblem as problematic.
Compare a site with metrics:
# HELP pybal_monitor_down_results_total Monitor down result count
# TYPE pybal_monitor_down_results_total counter
pybal_monitor_down_results_total{host="cp4037.ulsfo.wmnet",monitor="IdleConnection",service="testlb_443"} 22.0
pybal_monitor_down_results_total{host="ncredir4001.ulsfo.wmnet",monitor="ProxyFetch",service="ncredirlb_443"} 1.0
[...]
# TYPE pybal_monitor_down_results_created gauge
[...]
With a problem site:
# HELP pybal_monitor_down_results_total Monitor down result count
# TYPE pybal_monitor_down_results_total counter
# HELP pybal_monitor_status Monitor up status
# TYPE pybal_monitor_status gauge
[...]
Prometheus advises against missing metrics, so we should initialize the counters to 0 when PyBal starts.
See the _resultDown method as a starting point.