As we can see from alert history, eventstreams regularly hits the alerting threshold for sustained memory usage.
Its current limit is 1000Mi, I think raising it to 1100Mi would avoid triggering the alert as often.
| Clement_Goubert | |
| Feb 8 2024, 2:44 PM |
| F41816487: image.png | |
| Feb 8 2024, 4:18 PM |
| F41816454: image.png | |
| Feb 8 2024, 4:18 PM |
| F41816371: image.png | |
| Feb 8 2024, 4:18 PM |
As we can see from alert history, eventstreams regularly hits the alerting threshold for sustained memory usage.
Its current limit is 1000Mi, I think raising it to 1100Mi would avoid triggering the alert as often.
| Subject | Repo | Branch | Lines +/- | |
|---|---|---|---|---|
| eventstreams: Raise memory limit to 1100Mi | operations/deployment-charts | master | +1 -1 |
| Status | Subtype | Assigned | Task | ||
|---|---|---|---|---|---|
| Resolved | akosiaris | T266216 Increase visibility of container/pod ressource exhaustion | |||
| In Progress | Clement_Goubert | T357005 eventstreams regularly uses more than 95% of its memory limit |
Change 998945 had a related patch set uploaded (by Clément Goubert; author: Clément Goubert):
[operations/deployment-charts@master] eventstreams: Raise memory limit to 1100Mi
I am not sure this would actually solve the problem tbh. It don't hurt to try ofc, which is why I +1e, but looking into the following 7d graph displaying max/min/stdev/avg among the 9 pods in codfw paints a picture where we probably have like 1 or 2 pods at high memory usages, indicating some pattern of usage causing this.
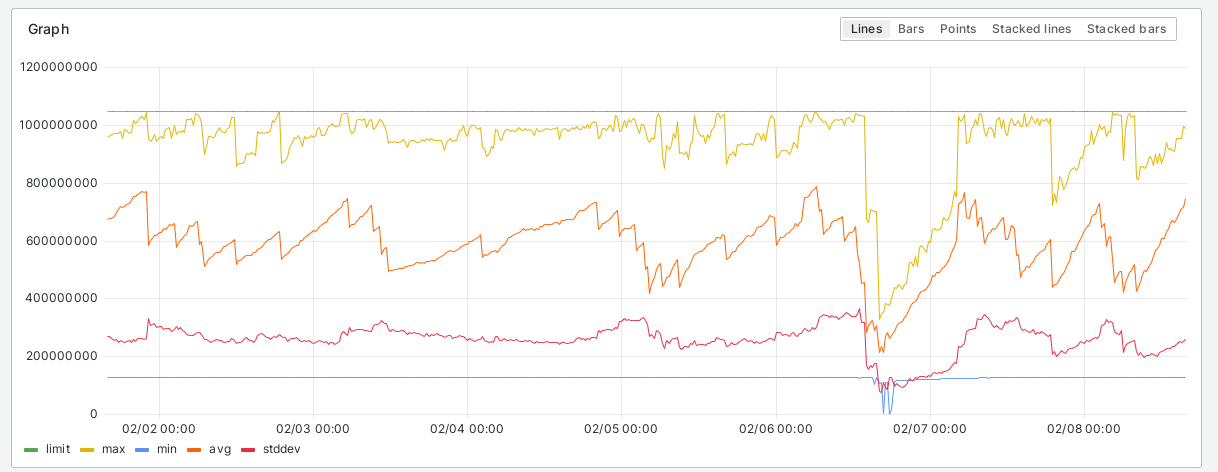
And this is corroborated by a topk(5) query
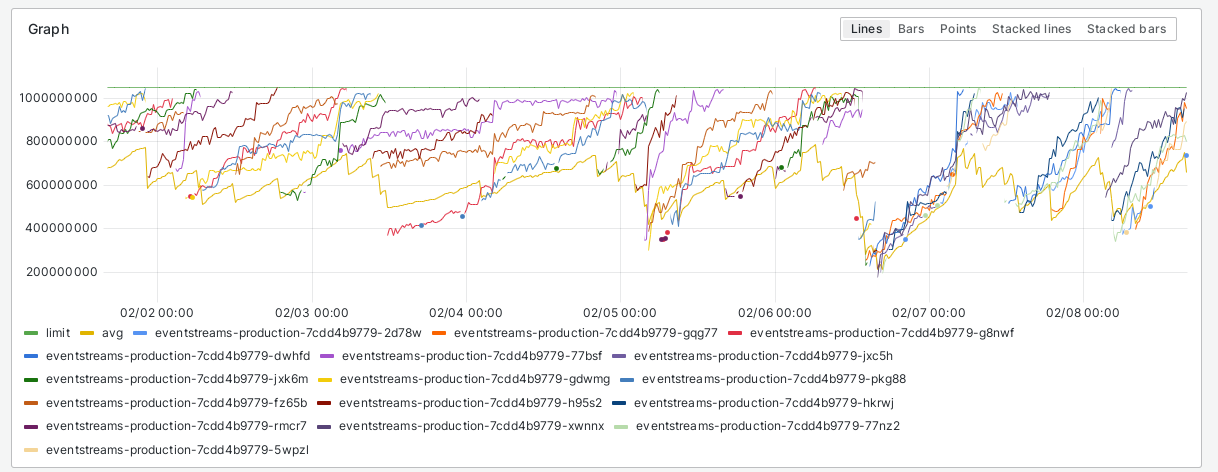
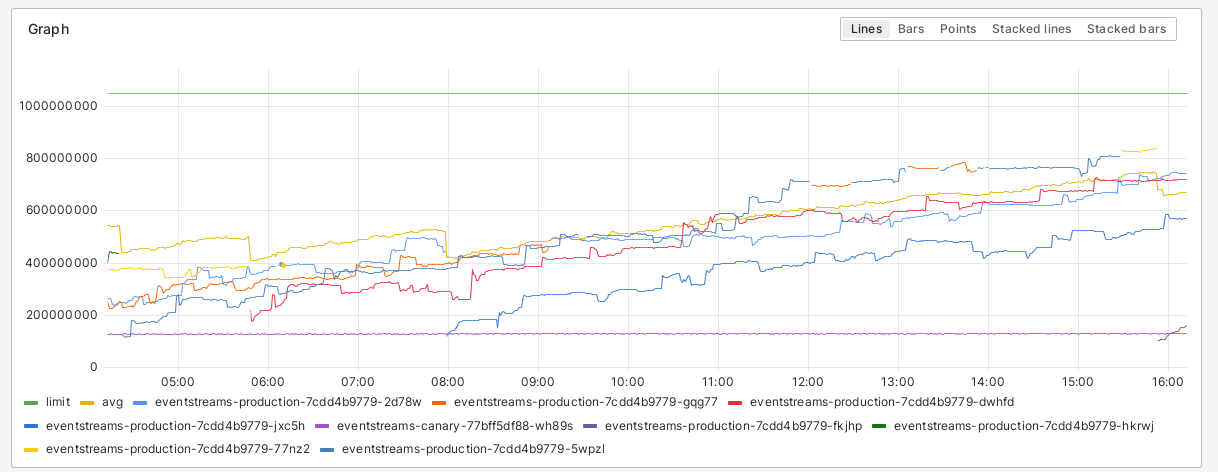
Note how it tends to be 1 or 2 pods that are close to the limit with the rest 3 well below that, close to the average. And there are another 4 that are well below that as shown in the bottomk(4) query below
Since eventstreams is streaming data to long running clients, I am starting to think that there is some memory leak somewhere and it's plaguing pods dependent on what the clients ask and how long they are connected to a pod.
Maximum concurrent clients appear to be ~100 for recentchange everything else is single digits. Max stream connection duration appears to be ~10days.
Sorry for not pasting links to those explore graphs, w.wiki complained that I went above the 2k url limit it supports.
Here is my query
topk(5, container_memory_usage_bytes{namespace="eventstreams", container="eventstreams"})with some max, min, stddev, avg variants.
Change 998945 merged by jenkins-bot:
[operations/deployment-charts@master] eventstreams: Raise memory limit to 1100Mi
Deployed, we'll see how the memory consumption evolves.
I agree the data above is a strong indicator of a memory leak, although I'm wondering about the stream connection duration metric considering the pods themselves were all a maximum of ~2 days old when I deployed the memory limit change today.
wondering about the stream connection duration
IIRC, varnish(?) sets a http timeout of something like 15 minutes, so something doesn't seem right about that metric to me either.
There's no routing stickiness, so a reconnecting client could be routed to any pod. Something smells leaky to me too...
Is this increasing mem usage a new occurance?
Looking at the logs, this seems to coincide with the redaction patch to eventstreams, but looking at the code I'm having a hard time finding where a memory leak could've happened... more confusing that it's just 1 or 2 pods hitting the limit
If you have time to dive deep, you can live inspect a nodejs process and search for memory leaks.
https://www.toptal.com/nodejs/debugging-memory-leaks-node-js-applications
Enable debug mode in helmfile and redeploy:
You can connect chrome debug tools to the node inspector port.
It might be easier to try this locally in your dev env, if is possible.
Good catch.
We do add a ~60 KBs of overhead (list of pages) to router.get code path, but at these traffic volumes it should have not have had a significant impact on saturation.