- perform a full dump of a large wiki through RESTBase, such as enwiki (can use a tool like https://github.com/gwicke/htmldumper) - done. Size for enwiki with lz4 compression: 70G html, 45G data-parsoid.
- measure performance of reads in repeat run, after cassandra is filled
- would be great to test response times with realistic traffic mix, possibly from the parsoid-lb service; look into getting logs from there & replaying those requests at high speed
- could additionally resurrect the old wikitext dump import script (https://github.com/wikimedia/restbase-cassandra/tree/master/test/dump) & test a full wikitext import
Description
Description
| Status | Subtype | Assigned | Task | |
|---|---|---|---|---|
| · · · | ||||
| Resolved | • GWicke | T1228 RESTbase deployment | ||
| Resolved | • GWicke | T76370 RESTBase performance testing | ||
| · · · |
Event Timeline
Comment Actions
Here are some first results and a graph:
- On a 58kb HTML page, one node delivers about 1400req/s peak for a throughput close to the gbit limit (taking into account inter-node traffic in ganglia). This means that we should probably get 10gbit ethernet on the new, more powerful nodes to avoid bottlenecking on the network.
- Internally recorded latency with some concurrent writes (about 10/s) and 200 concurrent readers per node remains << 100ms. The graph indicates 21ms at the 99th percentile. This is optimistic, as we are hitting a single URL for most reads, but it provides a good bottom line.
- External latency as reported by ab -n 1000000 -c200 http://cerium.eqiad.wmnet:7231/v1/en.wikipedia.org/pages/Foobar/html/634702417 running against each of the three cluster nodes:
Document Length:        58240 bytes

Concurrency Level:      200
Time taken for tests:   1277.381 seconds
Complete requests:      1000000
Failed requests:        0
Write errors:           0
Total transferred:      58420000000 bytes
HTML transferred:       58240000000 bytes
Requests per second:    782.85 [#/sec] (mean)
Time per request:       255.476 [ms] (mean)
Time per request:       1.277 [ms] (mean, across all concurrent requests)
Transfer rate:          44662.29 [Kbytes/sec] received

Connection Times (ms)
              min  mean[+/-sd] median   max
Connect:        0  109 365.2      5   15037
Processing:     8  146 189.0     72   17964
Waiting:        8   66  66.4     49   14209
Total:          9  255 418.8     83   18969

Percentage of the requests served within a certain time (ms)
  50%     83
  66%    134
  75%    279
  80%    312
  90%    891
  95%   1094
  98%   1364
  99%   2163
 100%  18969 (longest request)
The difference between between external and internal latencies reflects the time clients spend in the socket queue, as the concurrency in this benchmark is set to saturate the node. Client node network throughput is also a limit in this benchmark, as all three test clients were run concurrently on the same node with GBit networking.
- Bottlenecks are primarily CPU, memory and network.
Comment Actions
Some more notes:
- Really small pages (redirects) with timeuuid instead of mw revision yield about 2400k req/s on a single node. This compares to about 4400 req/s with the Parsoid Varnishes, which are running on boxes with a cpu performance rating that's double that of the restbase test boxes. The Parsoid front-end caches are set to not cache at all, which probably explains why Varnish doesn't perform better.
- Latency distribution of 5k requests at -c 10:
Percentage of the requests served within a certain time (ms)
  50%      7
  66%      8
  75%      8
  80%      9
  90%     10
  95%     12
  98%     14
  99%     19
 100%     43 (longest request)
- Lookup by mediawiki oldid currently involves a second cassandra request to resolve the oldid to a time range, which drops the performance to about 1700 req/s.
- The enwiki dump through restbase is pretty slow, as none of the v2 API requests are cached in the Parsoid caches & we don't want to hit the Parsoid cluster with excessive concurrency. Right now it's still in the Bs.
Comment Actions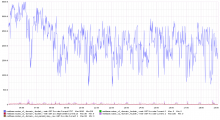
Things are now looking pretty solid at moderate load:
This is doing all random reads (nothing in page cache) from SSD, with a few 'cache misses' every now and then, which result in writes to Cassandra. Load is selected to be moderate. Total dataset is around 200G, close to the SSD space available on the test boxes. English wikipedia alone is around 100G on disk, of which close to 60G are HTML, and around 40G are parsoid metadata.
The request rates are currently double-counted (going to be fixed soon), so divide by two for actual request rates.
Comment Actions
Closing this task, as there is really not much left for the evaluation stage. We'll do another round of benchmarks with the prod hardware, and will leave a note here so that you can follow.
Comment Actions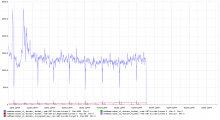
Some more testing with four independent enwiki dumpers over a few days (stopped eventually, took the screenshot a bit later):
Disk usage after tracking enwiki updates for ~2 weeks:
- 98G for the html
- 60G of data-parsoid
- 1.3G for the revision table