Halloween is a full two weeks behind us here in the United States, but it's still on my mind. It happens to be my favorite holiday, and I receive it both gleefully and somberly.
Some of the more obvious and delightful ways I appreciate Halloween include: busting out my giant spider to hang in the front yard; getting messy with gory and gaudy decorations; scaring neighborhood children; stuffing candy in my face. What's not to like about all that, really?
But there are more deeply felt reasons to appreciate Halloween, reasons that aren't often fully internalized or even discussed. Rooted in its pagan Celtic traditions and echoed by similar traditions worldwide, like Día de los Muertos of Mexico and Obon of Japan, Halloween asks us, for a night, to put away our timidness about living and dying. It asks us to turn toward the growing darkness of winter, turn toward the ones we've lost, turn toward the decay of our own bodies, and honor these very real experiences as equal partners to the light, birth, and growth embodied by our everyday expectations. More precisely it asks us to turn toward these often difficult aspects of life not with hesitation or fear but with strength, jubilation, a sense of humor. It is this brave posture of Halloween's traditions that I appreciate so very much.
So Halloween is over and I'm looking back. What does that have to do with anything here at WMF and in Phabricator no less? Well, I want to take you into another dark and ominous cauldron of our experience that most would rather just forget about.
I want to show you some Continuous Integration build metrics for the month of October!
Will we see darkness? Oh yes. Will we see decay? Surely. Was that an awkward transition to the real subject of this post? Yep! Sorry, but I just had to have a thematic introduction, and brace yourself with a sigh because the theme will continue.

You see this past October, Release Engineering battled a HORDE OF ZOMBIE CONTAINERS! And we'll be seeing in our metrics proof that this horde was, for longer than anyone wishes zombies to ever hang around, chowing down on the brains of our CI.
Before I get to the zombies, let's look briefly at a big picture view of last month's build durations... Let's also get just a bit more serious.
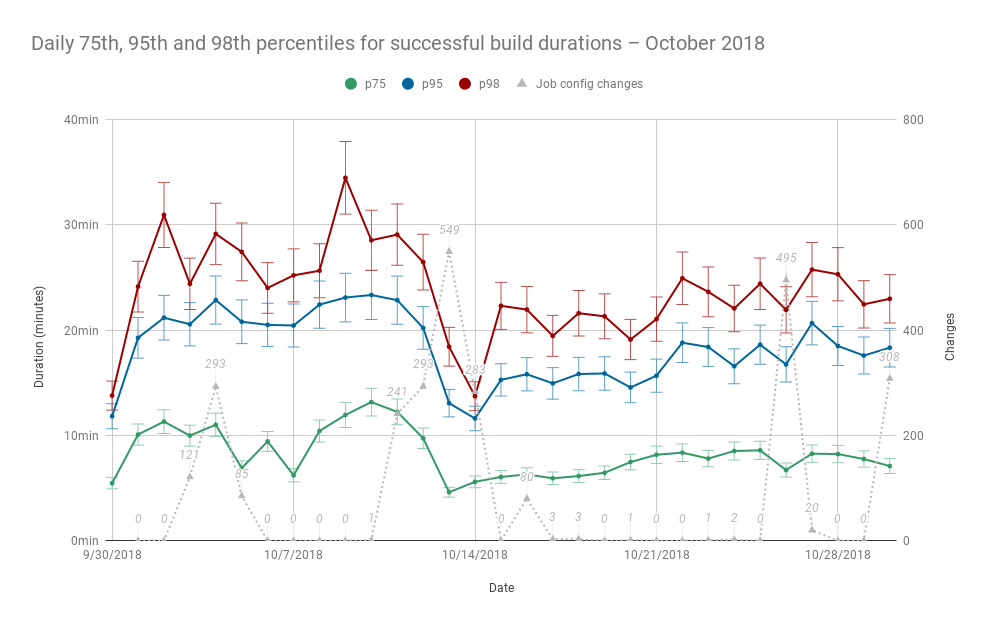
What are we looking at? We're looking at statistics for build durations. The above chart plots the daily 75th, 95th, and 98th percentiles of successful build durations during the month of October as well as the number of job configuration changes made within the same range of time.
These data points were chosen for a few reasons.
First, percentiles are used over daily means to better represent what the vast majority of users experience when they're waiting on CI[1]. It excludes outliers, build durations that occur only about 2 percent of the time, not because they're unimportant to us, but because setting them aside temporarily allows us to find patterns of most common use and issues that might otherwise be obfuscated by the extra noise of extraordinarily long builds.
Next, three percentiles were chosen so that we might look for patterns among both faster builds and the longer running ones. Practically this means we can measure the effects of our changes on the chosen percentiles independently, and if we make changes to improve the build durations of jobs that typically perform closer to one percentile, we can measure the effect discretely while also making sure performance at other percentiles has not regressed.
Finally, job configuration changes are plotted alongside daily duration percentiles to help find indications of whether our changes to integration/config during October had an impact on overall build performance. Of course, measuring the exact impact of these changes is quite a bit more difficult and requires the build data used to populate this chart to be classified and analyzed much further—as we'll see later—but having the extra information there is an important first step.
So what can we see in this chart? Well, let's start with that very conspicuous dip smack dab in the middle.
And for background, another short thematic interlude:
Back in June, @thcipriani of Release Engineering was waiting on a particularly long build to complete—it was a "dark and stormy night" or something, *sighs and rolls eyes*—and during his investigation on the labs instance that was running the build, he noticed a curious thing: There was a Docker container just chugging away running a build that had started more than 6 hours prior, a build that had thought to be canceled and reaped by Jenkins, a build that should have been long dead but was sitting there very much undead and seemingly loving its long and private binge before the terminal specter of a meat-space man had so rudely interrupted.
"It's a zombie container," @thcipriani (probably) muttered as he felt his way backward on outstretched fingertips (ctrl-ccccc), logged out, and filed task T198517 to which @hashar soon replied and offered a rational but disturbing explanation.
I'm not going to explain the why in its entirety but you can read more about it in the comments of an associated task, T176747, and the links posted therein. I will, however, briefly explain what I mean by "zombie container."
A zombie container for the sake of this post is not strictly a zombie process in the POSIX sense, but means that a build's main process is still running, even after Jenkins has told it to stop. It is both taking up some amount of valuable host resources (CPU, memory, or disk space), and is invisible to anyone looking only at the monitoring interfaces of Gerrit, Zuul, or Jenkins.
We didn't see much evidence of these zombie containers having enough impact on the overall system to demand dropping other priorities—and to be perfectly honest, I half assumed that Tyler's account had simply been due to madness after ingesting a bad batch of homebrew honey mead—but the data shows that they continued to lurk and that they may have even proliferated under the generally increasing load on CI. By early October, these zombie containers were wreaking absolute havoc—compounded by the way our CI system deals with chains of dependent builds and superseding patchsets—and it was clear that hunting them down should be a priority.
Task T198517 was claimed and conquered, and to the dismay of zombie containers across CI:
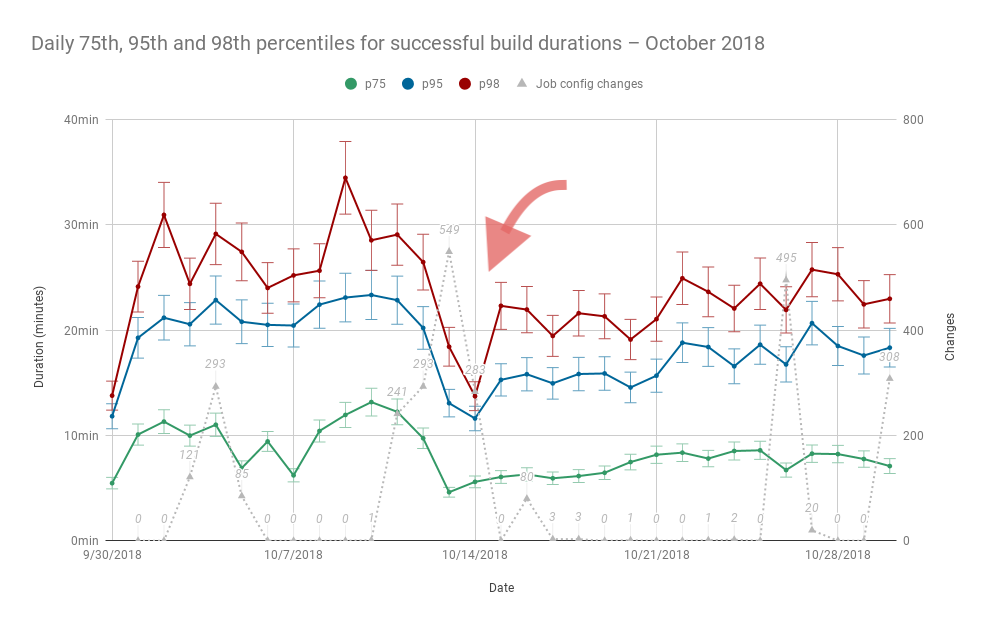
Looking again at that dip in the percentiles chart, a few things are clear.
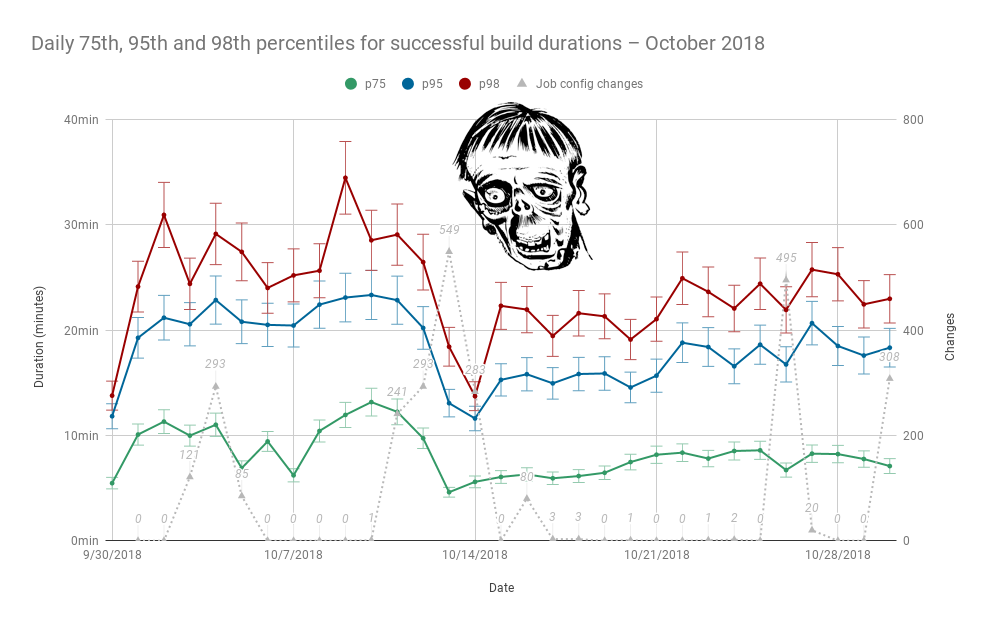
There's a noticeable drop among all three daily duration percentiles. Second, there also seems to be a decrease in both the variance of each day's percentile average expressed by the plotted error bars—remember that our percentile precision demands we average multiple values for each percentile/day—and the day-to-day differences in plotted percentiles after the dip. And lastly, the dip strongly coincides with the job configuration changes that were made to resolve T198517.
WE. DID. IT. WE'VE FREED CI FROM THOSE DREADED ZOMBIE CONTAINERS! THEY ARE TRULY (UN)^2-DEAD AGAIN SO LET'S DITCH THESE BORING CHARTS AND CELEBRA...
Say what? Oh. Right. I guess we didn't adequately measure exactly how much of an improvement in duration there was pre-and-post T198517 and whether or not there was unnoticed/unanticipated regression. Let's pause on that celebration and look a little deeper.
So how does one get a bigger picture of overall CI build durations before and after a change? Or of categories within any real and highly heterogeneous performance data for that matter? I did not have a good answer to this question, so I went searching and I found a lovely blog post on analyzing DNS performance across various geo-distributed servers[2]. It's a great read really, and talks about a specific statistical tool that seemed like it might be useful in our case: The logarithmic percentile histogram.
"I like the way you talk..." Yes, it's a fancy name, but it's pretty simple when broken down... backwards, because, well, English.
A histogram shows the distribution of one quantitative variable in a dataset, in our case build duration, across various 'buckets'. A percentile histogram buckets values for the variable of the histogram by its percentiles, and a logarithmic percentile histogram plots the distribution of values across percentile buckets on a logarithmic scale.
I think it's a bit easier to show than to describe, so here's our plot of build duration percentiles before and after T198517 was resolved, represented as a histogram on a logarithmic scale.
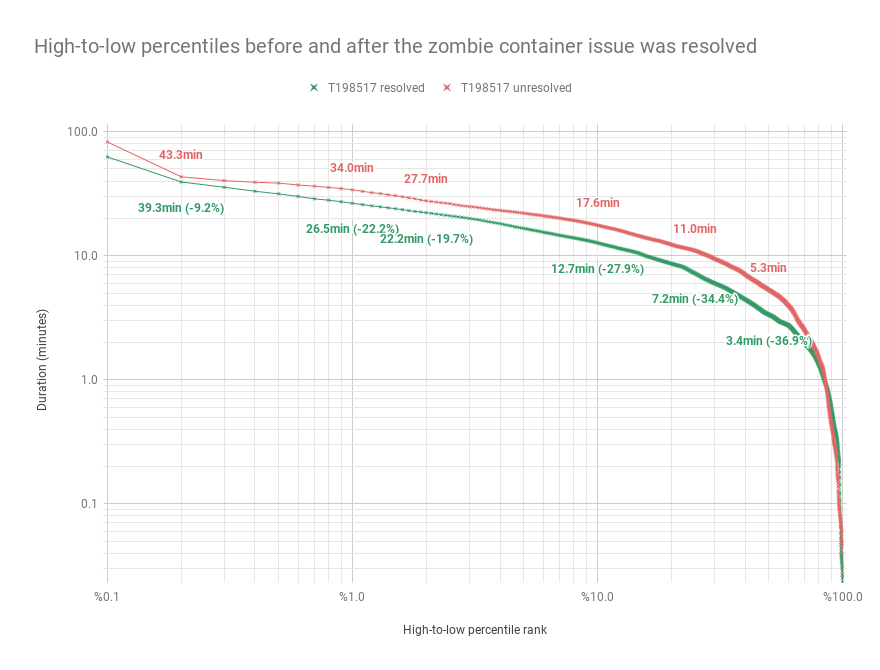
First, note that while we ranked build durations low to high in our other chart, this one presents a high-to-low ranking, meaning that longer durations (slower builds) are ranked within lower percentiles and shorter durations (faster builds) are ranked in higher percentiles. This better fits the logarithmic scale, and more importantly it brings the lowest percentiles (the slowest durations) into focus, letting us see where the biggest gains were made by resolving the zombie container issue.
Also valuable about this representation is the fact that it shows all percentiles, not just the three that we saw earlier in the chart of daily calculations, which shows us that gains were made consistently across the board and there are no notable regressions among the percentile ranks where it would matter—there is a small section of the plot that shows percentiles of post-T198517 durations being slighter higher (slower), but this is among some of the percentiles for the very fastest of builds where the absolute values of differences are very small and perhaps not even statistically significant.
Looking at the percentage gains annotated parenthetically in the plot, we can see major gains at the 0.2, 1, 2, 10, 25, and 50th percentiles. Here they are as a table.
| percentile | duration w/ zombies | w/o zombies | gain from killing zombies |
| p0.2 | 43.3 minutes | 39.3 minutes | -9.2% |
| p1 | 34.0 | 26.5 | -22.2% |
| p2 | 27.7 | 22.2 | -19.7% |
| p10 | 17.6 | 12.7 | -27.9% |
| p25 | 11.0 | 7.2 | -34.4% |
| p50 | 5.3 | 3.4 | -36.9% |
So there it is quite plain, a CI world with and without zombie containers, and builds running upwards of 37% faster without those zombies chomping away at our brains! It's demonstrably a better world without them I'd say, but you be the judge; We all have different tastes. 8D
Now celebrate or don't celebrate accordingly!
Oh and please have at the data[3] yourself if you're interested in it. Better yet, find all the ways I screwed up and let me know! It was all done in a giant Google Sheet—that might crash your browser—because, well, I don't know R! (Side note: someone please teach me how to use R.)
References
[1] https://www.dynatrace.com/news/blog/why-averages-suck-and-percentiles-are-great/
[2] https://blog.apnic.net/2017/11/24/dns-performance-metrics-logarithmic-percentile-histogram/
[3] https://docs.google.com/spreadsheets/d/1-HLTy8Z4OqatLnufFEszbqkS141MBXJNEPZQScDD1hQ/edit#gid=1462593305
Credits
Thanks to @thcipriani and @greg for their review of this post!
//"DOCKER ZOMBIE" is a derivative of https://linux.pictures/projects/dark-docker-picture-in-playing-cards-style and shared under the same idgaf license as original https://linux.pictures/about. It was inspired by but not expressly derived from a different work by drewdomkus https://flickr.com/photos/drewdomkus/3146756158//
- Projects
- Subscribers
- greg, hashar, thcipriani
- Tokens
Event Timeline
Well done on implementing docker stop. I should have went this way originally instead of working around SIGTERM not propagating properly (from Jenkins to docker run to bash, all three doing messy stuff). Thank you for the nice written report!