Description
Related Objects
Event Timeline
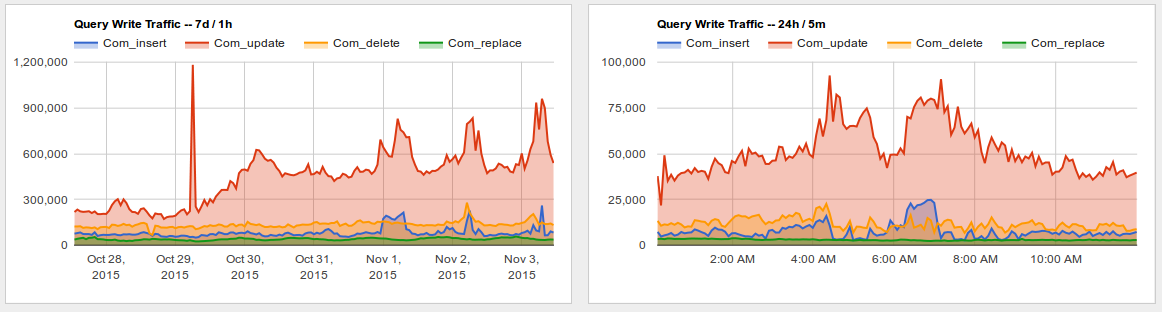
Sounds like the the result of fixing the rpc/RunJobs to properly run jobs till the 30 sec limit rather than 1 at a time (which wasted huge amounts of time in setup overhead and caused massive job backlogs, particularly for the 'enqueue' and 'refreshLinks' queues). Keeping up means more DB traffic. This was noticed by Erik and fixed by me on 2015-10-29.
06:30 logmsgbot: aaron@tin Synchronized rpc/RunJobs.php: 29ccbd248 (duration: 00m 17s)
Related: T117304
In any case, if the run rate for any type of job is too high for some reason, then runner count and $wgJobBackoffThrottling can be adjusted.
ok, if it is explained and expected, then it is not urgent.
A higher rate of updates does not necessarily imply less performance, (it could mean less lag, for example, if the updates are smaller). However, there could be an overhead in round trips- I will let you own/decide if to close this, as you may have better overview if this is causing impact on application db reads or lag. This is creating around 2000 extra QPS, per large server on enwiki.
I do not see operational problems, like higher rate of connections failed.
And, as an update, the number of updates and selects is in an all-time low right now (compated to last week).
Related? 50% less job queing: https://grafana.wikimedia.org/dashboard/db/job-queue-rate?panelId=1&fullscreen&from=1447820310472&to=1447824844728&var-Job=All
Is this still relevant? Might have been fixed with T125838: Implement usage tracking without eu_touched.