We have https://grafana.wikimedia.org/dashboard/db/ores-extension which contains some stats about jobs.
Description
Event Timeline
Few tips:
- Use the "Dashboards" link feature instead of hardcoding hyperlinks. That way users will stay on the current Grafana domain (e.g. public or admin), and it'll automatically add additional ones when you tag them with ores. You can also enable the dropdown option if it becomes too crowded. No visible change.
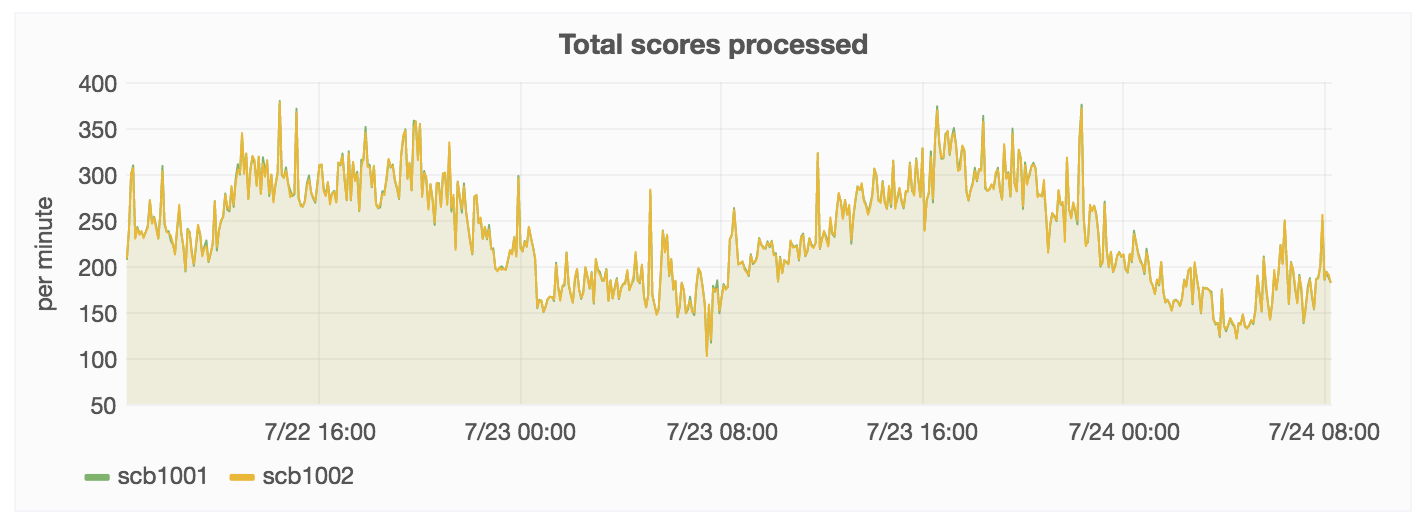
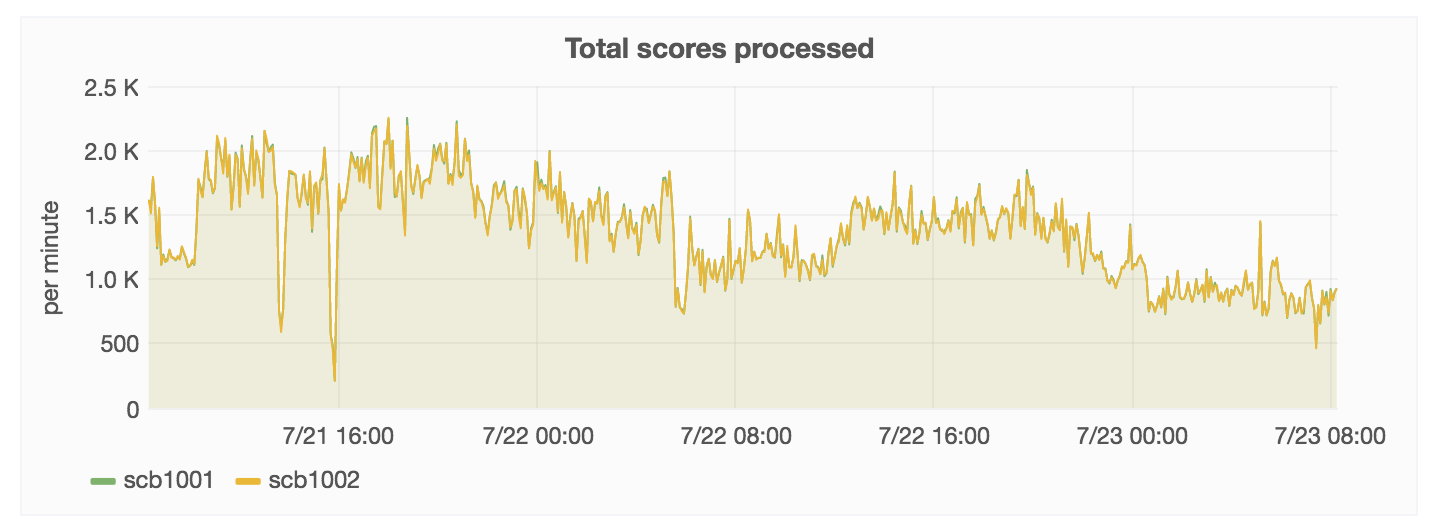
- Use .rate instead of .count. count is the number of statsd messages received, not the total of the values (typically 1, but sometimes 0 or a number higher than 1 due to aggregation proxies). This change did actually change the shape of the graph:
Before:
After:
It seems the spikes were ducked earlier. Presumably because ORES will send stats messages with an increment higher than 1.
Not shown above is that previously the counts were off when changing the time range in Grafana to something wider than 7 days because Graphite aggregation there is no longer per minute, but larger, at which point Grafana will render dots further apart, and count will keep representing the total number of messages (much higher). Whereas rate will keep representing the aggregate rate per second.
See https://wikitech.wikimedia.org/wiki/Graphite#Extended_properties
Hey @Krinkle,
Thanks for the tips. One question. Why not using sum instead of rate and scaling it up?
Because the fact that sum is the total of a minute is not stable. If you look at the last 5 days it'll be per minute. But if you look at a larger range (e.g. 30 days) or if you look at the same range further in the past (e.g. a range of 5 days last month) - it'll be per 15 minutes (or per hour, or whatever) with values that will likely confuse you.
Example from current configuration of https://grafana.wikimedia.org/dashboard/db/ores. It appears that the rate per minute was 500 one week, and 2000 the week before:
In this last graph, if you were to hover a few of the points and look at the timestamp, you'll see that it snaps to 15 minute intervals, because that's what Graphite is configured to do to save space in historical data (it aggregates to larger intervals the further back you go).
Use rate instead if you need a stable rate per interval (e.g. always per second or always per minute). This will remain accurate beyond the last 7 days.


