We got a nice change the 24th for the Facebook page we test with Firefox:
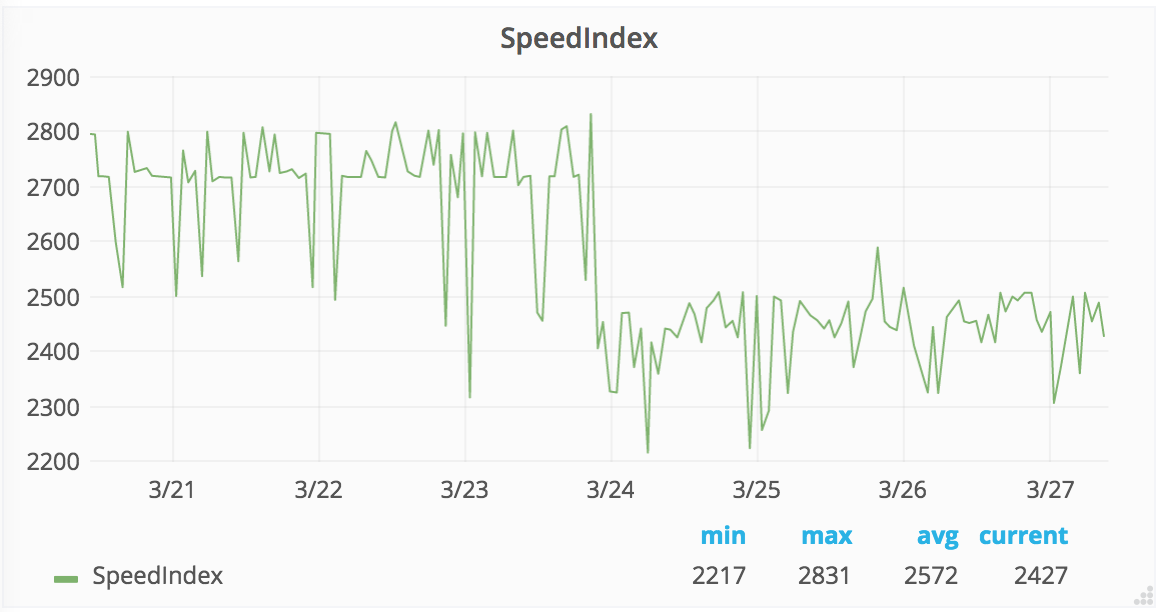
All metrics are better for that page:
But nothing for the other two pages we test. We should investigate to see what made the decrease in metrics.
| Peter | |
| Mar 27 2017, 9:41 AM |
| F7330100: Screen Shot 2017-04-06 at 19.59.04.png | |
| Apr 7 2017, 3:14 AM |
| F7329874: Screen Shot 2017-04-06 at 19.57.48.png | |
| Apr 7 2017, 3:14 AM |
| F7029420: Screen Shot 2017-03-27 at 11.34.35 AM.png | |
| Mar 27 2017, 9:41 AM |
| F7029507: Screen Shot 2017-03-27 at 11.37.05 AM.png | |
| Mar 27 2017, 9:41 AM |
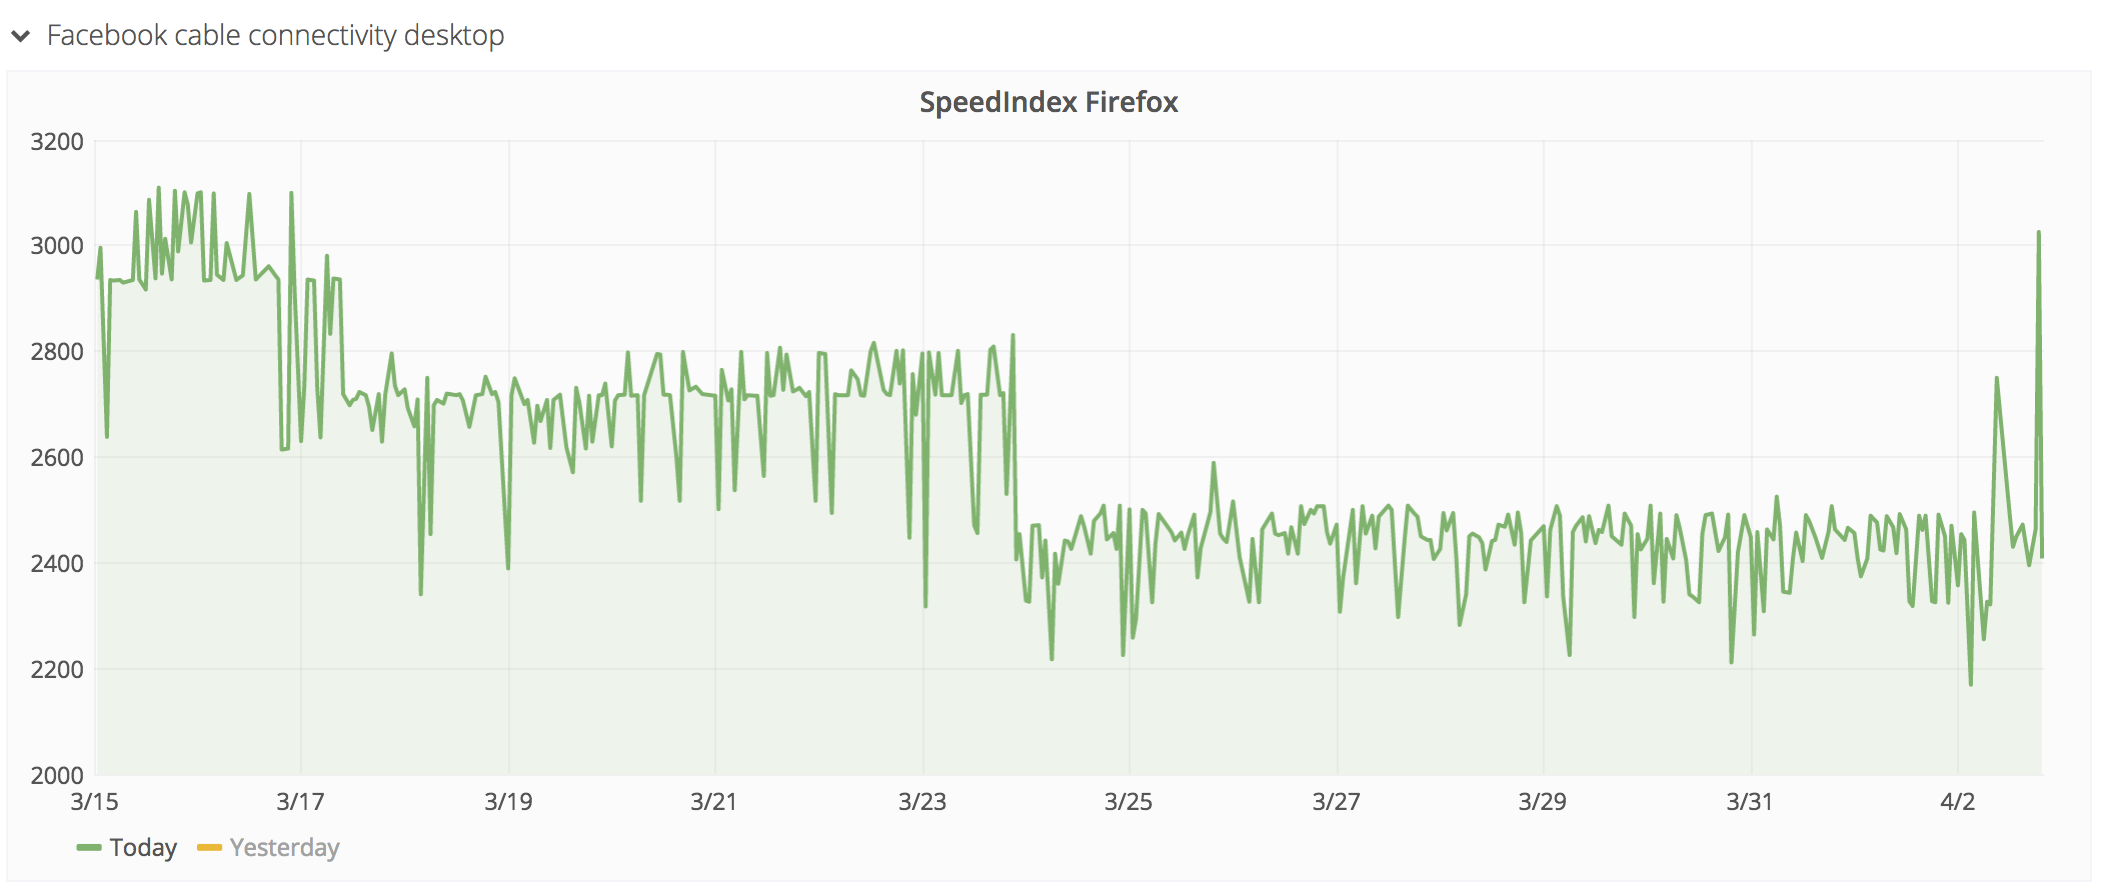
We got a nice change the 24th for the Facebook page we test with Firefox:
All metrics are better for that page:
But nothing for the other two pages we test. We should investigate to see what made the decrease in metrics.
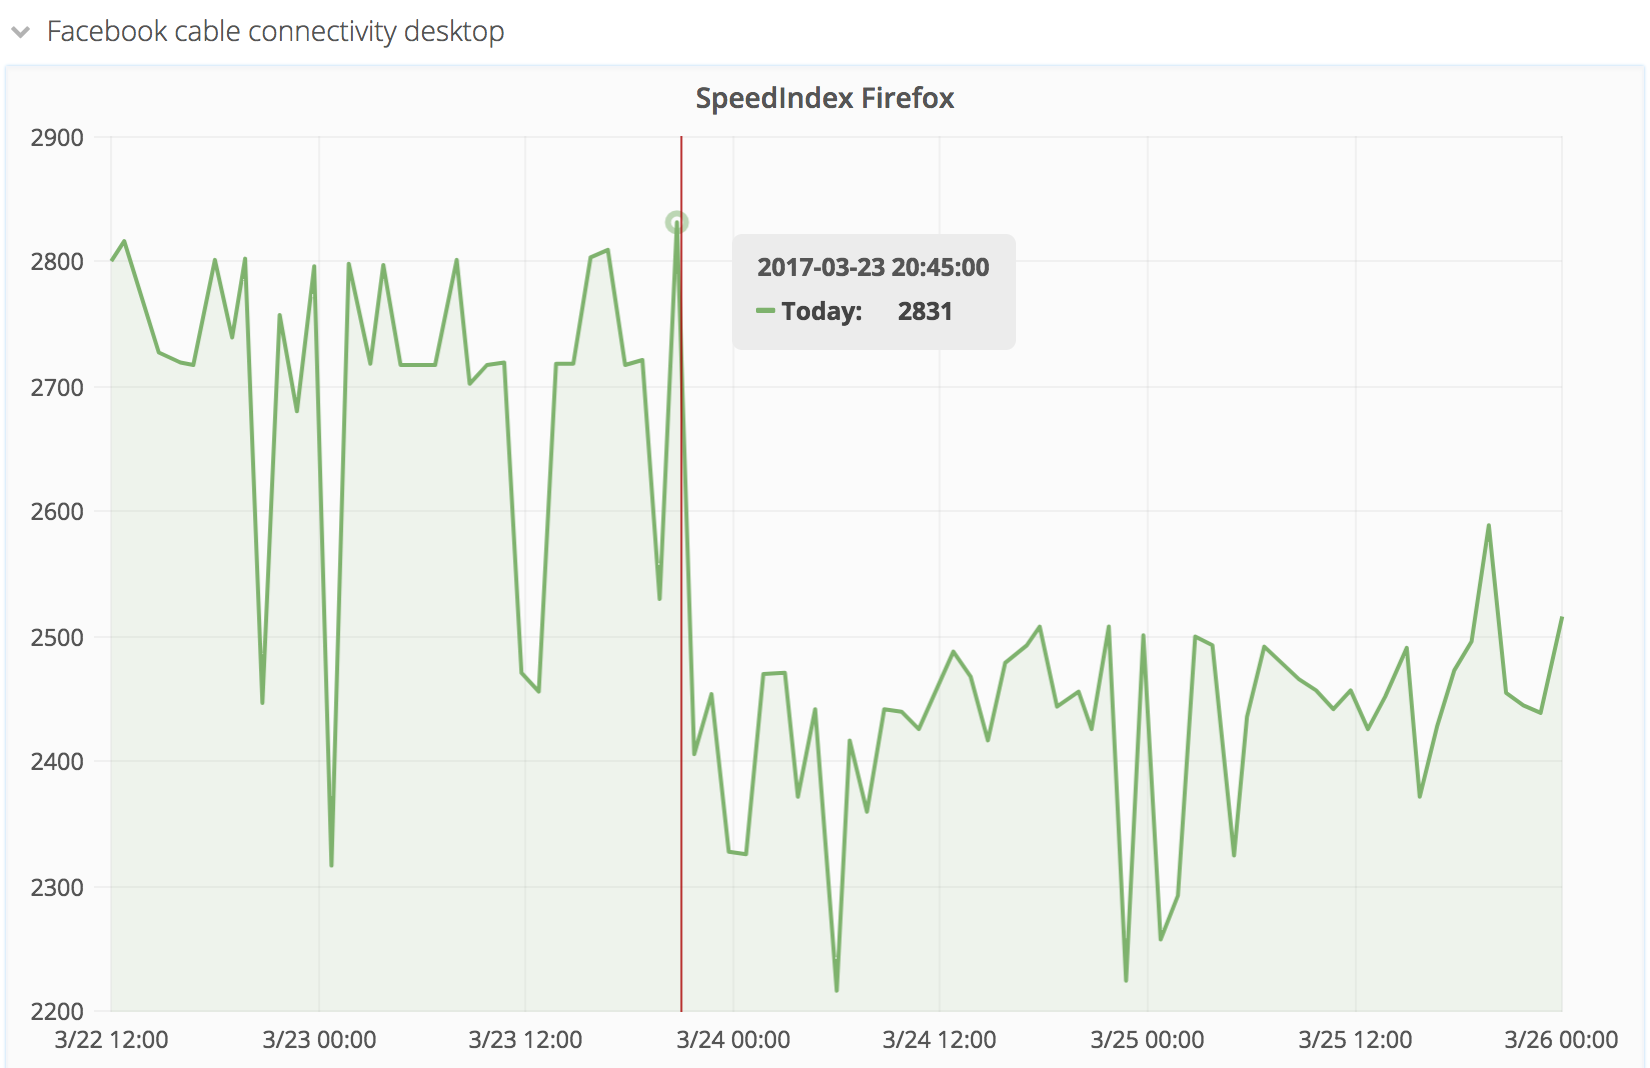
Seems the change happened between 2017-03-23 20:45 and 2017-03-24 03:00. Here a some of the deployments logged between Thursday 2017-03-23 12:00 and Friday 2017-03-24 03:00:
Seems like the obvious trigger is the roll out of this weeks' MediaWiki changes (1.29.0-wmf.17). Looking through the commits in MediaWiki core (not looking at the extensions yet), the following stand out in terms of frontend behaviour that may have changed for plain page views.
Next step: Compare waterfall collected by WebPageTest from runs before/after the change.
PS: Navigation Timing from around the same time does not seem to have significantly changed so it might be specific to Firefox or certain aspects of this run (Facebook page, English Wikipedia, cable speed, geolocation). (See https://grafana.wikimedia.org/dashboard/db/navigation-timing?from=1489795200000&to=1490572800000, switch between the various metrics).
Runs before the change alternate between SpeedIndex 2500 and 2800 on the graph. A few samples:
| (ff-2017-03-23 17.48) 170323_X4_KB/4 | (ff-2017-03-23 18.48) 170323_RG_MJ/3 | (ff-2017-03-23 19.48) 170323_GR_NV/2 |
|---|---|---|
| First Byte: 0.144s | First Byte: 0.148s | First Byte: 0.146s |
| Start Render: 2.595s | Start Render: 2.599s | Start Render: 2.400s |
| SpeedIndex: 2717 | SpeedIndex: 2721 | SpeedIndex: 2530 |
| Load Time: 3.205s | Load Time: 3.194s | Load Time: 3.042s |
| Visually Complete: 4.858s | Visually Complete: 4.837s | Visually Complete: 4.731s |
| DOM Nodes: 11406 | DOM Nodes: 11406 | DOM Nodes: 11406 |
| Requests (domComplete): 64 | Requests (domComplete): 64 | Requests (domComplete): 64 |
| Bytes In (domComplete): 913 KB | Bytes In (domComplete): 914 KB | Bytes In (domComplete): 913 KB |
| Requests (fullyLoaded): 72 | Requests (fullyLoaded): 72 | Requests (fullyLoaded): 72 |
| Bytes In (fullyLoaded): 1,030 KB | Bytes In (fullyLoaded): 1,031 KB | Bytes In (fullyLoaded): 1,030 KB |
Runs after the change alternate between SpeedIndex 2200 and 2500 on the graph. A few samples:
| (ff-2017-03-24 00.48) 170324_TV_F/2 | (ff-2017-03-23 23.48) 170323_3G_TD/5 | (ff-2017-03-23 22.48) 170323_C6_S8/2 | Difference |
|---|---|---|---|
| First Byte: 0.146s | First Byte: 0.146s | First Byte: 0.146s | ± 0.002 |
| Start Render: 2.335s | Start Render: 2.197s | Start Render: 2.195s | -0.2s |
| SpeedIndex: 2326 | SpeedIndex: 2328 | SpeedIndex: 2454 | -300 |
| Load Time: 2.996s | Load Time: 2.946s | Load Time: 3.006s | ± 0.1 |
| Visually Complete: 4.381s | Visually Complete: 4.341s | Visually Complete: 4.795s | -0.4s |
| DOM Nodes: 11509 | DOM Nodes: 11509 | DOM Nodes: 11509 | +103 |
| Requests (domComplete): 64 | Requests (domComplete): 64 | Requests (domComplete): 64 | ± 0 req |
| Bytes In (domComplete): 918 KB | Bytes In (domComplete): 918 KB | Bytes In (domComplete): 918 KB | +5KB |
| Requests (fullyLoaded): 71 | Requests (fullyLoaded): 71 | Requests (fullyLoaded): 71 | -1 req |
| Bytes In (fullyLoaded): 1,028 KB | Bytes In (fullyLoaded): 1,028 KB | Bytes In (fullyLoaded): 1,028 KB | -2KB |
| Requests before | Requests after | Difference |
|---|---|---|
| /wiki (1) | /wiki (1) | ± 0 |
| /w/load.php (9) | /w/load.php (8) | -1 request |
| /static/ (4) | /static (4) | ± 0 |
| /w/extensions/...png (1) | /w/extensions/...png (1) | ± 0 |
| upload.wikimedia.org (55) | upload.wikimedia.org (55) | ± 0 |
| meta.wikimedia.org (1) | meta.wikimedia.org (1) | ± 0 |
| type | load.php url | Difference |
|---|---|---|
| <link rel=stylesheet | load.php?modules=[page styles: cite,tmh,uls,visualeditor,..] | |
| <script async | load.php?modules=startup | |
| <link rel=stylesheet | load.php?modules=site.styles | |
| script fetch | load.php?modules=jquery+mediawiki | |
| script fetch | load.php?modules=[lazy load: legacy.wikibits] | |
| script fetch | load.php?modules=[page scripts: tmh,uls,centralnotice,..] | +tablesorter (now loads here) |
| script fetch | load.php?modules=[page scripts (cache group): jquery.ui] | |
| script fetch | load.php?modules=[lazy load: TimedMediaHandler dependencies] | |
| script fetch | load.php?modules=[lazy load: tablesorter + mw.language] | removed |
The removed request was done in rMW2fccd229d2e8: Skin: Preload jquery.tablesorter based on rough heuristics (part of T159911: Audit modules (2017)). I tried hard to find some other difference but this seems to be the only thing that stands out.
The earlier loading of tablesorter explains:
However none of this explains why it affected earlier metrics like "Start Render". Browsers don't have to wait for document ready (domInteractive) or window load (domComplete) to start painting something.
On the other side, the request that was removed used to start around 1.9s, and start render at 2.3s. So it certainly is "in time" to have been used as a heuristic of some sort in Firefox internally. While Firefox definitely doesn't wait for domComplete to render, it might be that it more-or-less arbitrarily decides to wait a small amount of time for certain requests to complete in case they significantly change the page (to avoid FOUC). It looks like it was doing that for our tablesorter request which Firefox may've seen as "important" for some reason.