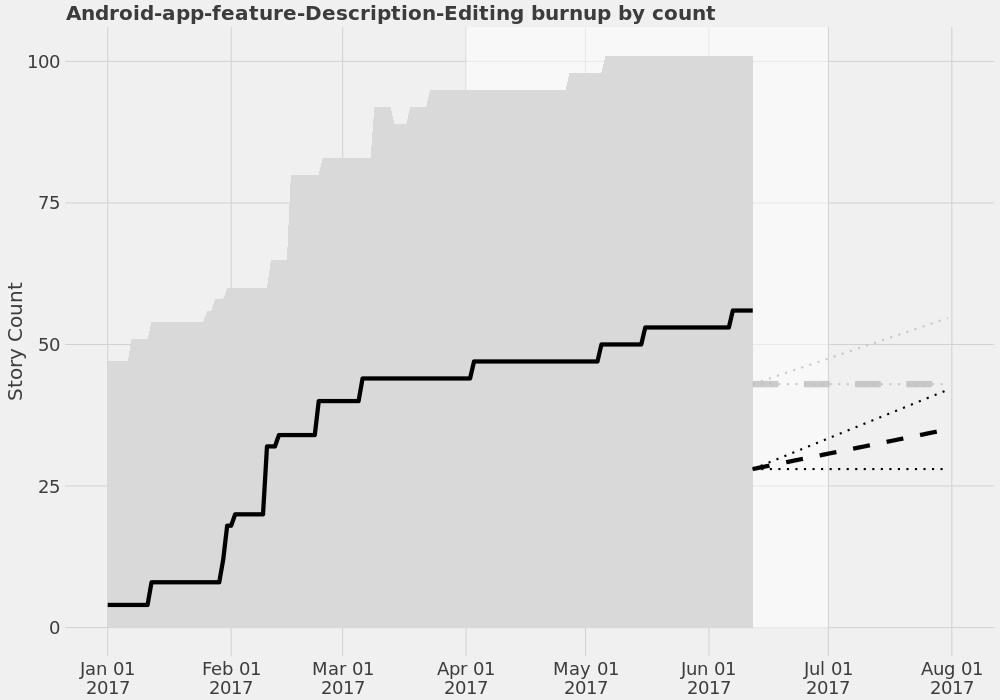
The forecast lines for both the tasks completed and the work remaining are unconnected to the historical data.
After some inspection, this is because they pull from different data sources, and the burnup areas are probably the wrong ones.
| • JAufrecht | |
| Jun 12 2017, 10:16 PM |
| F8447673: image.png | |
| Jun 12 2017, 10:16 PM |
The forecast lines for both the tasks completed and the work remaining are unconnected to the historical data.
After some inspection, this is because they pull from different data sources, and the burnup areas are probably the wrong ones.
| Status | Subtype | Assigned | Task | ||
|---|---|---|---|---|---|
| Declined | None | T200550 Phlogiston reports are available and useful to any team that wants to use them | |||
| Declined | None | T167746 Tranche burnups are incorrect |
First round of digging suggests that the forecast lines are correct and the burnups and backlog are doubled for some reason. probably caused by https://github.com/wikimedia/phlogiston/commit/e3fdbc14b53cf46d5c98d7435acfd5666d2c6919, the last big change to touch this stuff.
One hypothesis for why one of the counts (either the burnup line or the backlog areas) is wrong is that the recently_closed table may be mixing data. It has one column for date, one column for (first day of) week, one column for (first day of) month, and one column for (first day of) quarter, plus two dependent data fields. However, the week, month, and quarter should each have a separate row, since they each represent different time periods and presumably have different aggregade data. So, there could be mingling of week, month, and quarter data, which would explain variation in the discrepency.
Solution would be
Resetting assignee as it does not seem like @JAufrecht is actively working on this task (feel free to correct me).
Phlogiston is unmaintained. Declining its remaining open tasks. See T253964 for more info.