As discussed on T154704, we want to have a reasonable per-IP limit for maps. The use case of maps (downloading tiles / zooming / ...) is sufficiently different from other services that we might want to have specific limits. Some analysis of our current traffic could help us set this limit.
Description
Details
| Subject | Repo | Branch | Lines +/- | |
|---|---|---|---|---|
| varnish: introduce rate limiting for maps | operations/puppet | production | +16 -1 |
| Status | Subtype | Assigned | Task | ||
|---|---|---|---|---|---|
| Resolved | • ema | T169175 What is a reasonable per-IP ratelimit for maps | |||
| Resolved | • ema | T163233 Implement Varnish-level rough ratelimiting | |||
| Resolved | • ema | T154704 Rate-limit browsers without referers | |||
| Resolved | • GWicke | T118365 Increase request limits for GETs to /api/rest_v1/ |
Event Timeline
The OSMF has had issues with tile scrapers in the past, and its squid config is https://github.com/openstreetmap/chef/blob/master/cookbooks/tilecache/templates/default/squid.conf.erb
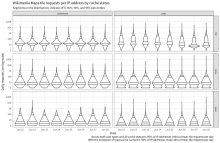
Here's the distribution of tile counts per IP address per day:
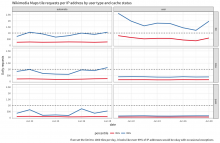
Here are the 95th and 99th percentiles on a daily basis:
Based on the last week of data, it looks like if we set the limit to 1000 per day that's 95% (and even 99% on some days) of IP addresses that will be totally fine. If we set it even lower to 100, that's 90% of IP addresses that will be fine.
Appendix
For reproducibility in the future:
query <- paste0("WITH tile_requests AS (
  SELECT
    CONCAT(year, '-', LPAD(month, 2, '0'), '-', LPAD(day, 2, '0')) AS date,
    -- anonymize for potentially sharing the dataset:
    MD5(CONCAT(client_ip, '", Sys.info()["nodename"], Sys.info()["release"], "')) AS ip_hash,
    cache_status AS cache,
    CASE
      WHEN (
        -- if we marked the request as being user, let's perform a few additional checks:
        agent_type = 'user' AND (
          -- look for URLs in UA
          user_agent RLIKE 'https?://'
          OR INSTR(user_agent, 'www.') > 0
          OR INSTR(user_agent, 'github') > 0
          -- look for email address in UA
          OR LOWER(user_agent) RLIKE '([a-z0-9._%-]+@[a-z0-9.-]+\\.(com|us|net|org|edu|gov|io|ly|co|uk))'
          -- last (but not least), check if we can't parse any useful info from UA
          OR (
            user_agent_map['browser_family'] = 'Other'
            AND user_agent_map['device_family'] = 'Other'
            AND user_agent_map['os_family'] = 'Other'
          )
        )
      ) OR agent_type = 'spider' THEN 'TRUE'
      ELSE 'FALSE'
    END AS is_automata,
    IF(referer = '', 'FALSE', 'TRUE') AS has_referrer,
    IF(user_agent = '', 'FALSE', 'TRUE') AS has_ua
  FROM wmf.webrequest
  WHERE
    webrequest_source = 'upload'
    AND year = 2017 AND month = ${month} AND day = ${day}
    AND uri_host = 'maps.wikimedia.org'
    AND http_status IN('200', '304')
    AND uri_query <> '?loadtesting'
    -- check that the request is Kartotherian tile request ('/{source}/{zoom}/{x}/{y}[@{scale}x].{format}'):
    AND uri_path RLIKE '^/([^/]+)/([0-9]{1,2})/(-?[0-9]+)/(-?[0-9]+)(@([0-9]\\.?[0-9]?)x)?\\.([a-z]+)$'
    -- check for style:
    AND REGEXP_EXTRACT(uri_path, '^/([^/]+)/([0-9]{1,2})/(-?[0-9]+)/(-?[0-9]+)(@([0-9]\\.?[0-9]?)x)?\\.([a-z]+)$', 1) != ''
    -- check for zoom:
    AND REGEXP_EXTRACT(uri_path, '^/([^/]+)/([0-9]{1,2})/(-?[0-9]+)/(-?[0-9]+)(@([0-9]\\.?[0-9]?)x)?\\.([a-z]+)$', 2) != ''
    -- check for scale:
    AND COALESCE(REGEXP_EXTRACT(uri_path, '^/([^/]+)/([0-9]{1,2})/(-?[0-9]+)/(-?[0-9]+)(@([0-9]\\.?[0-9]?)x)?\\.([a-z]+)$', 6), '1') != ''
    -- check for format:
    AND REGEXP_EXTRACT(uri_path, '^/([^/]+)/([0-9]{1,2})/(-?[0-9]+)/(-?[0-9]+)(@([0-9]\\.?[0-9]?)x)?\\.([a-z]+)$', 7) != ''
)
SELECT date, ip_hash, cache, is_automata, has_referrer, has_ua, COUNT(1) AS requests
FROM tile_requests
GROUP BY date, ip_hash, cache, is_automata, has_referrer, has_ua;\n")

message("Buckle up, let's get a week's worth of data!")
results <- do.call(rbind, lapply(seq(Sys.Date() - 8, Sys.Date() - 1, "day"), function(date) {
  message("Counting sister search-referred pageviews from ", format(date, "%Y-%m-%d"), "...")
  imputed_query <- sub("${day}", lubridate::day(date), sub("${month}", lubridate::month(date), query, fixed = TRUE), fixed = TRUE)
  return(wmf::query_hive(imputed_query))
}))
message("Done counting.")
results$date <- lubridate::ymd(results$date)

message("Saving interim results...")
save(list = "results", file = "~/maps-tile-request-counts.RData", compress = TRUE)

# scp stat2:/home/bearloga/maps-tile-request-counts.RData ~/Desktop/
load("~/Desktop/maps-tile-request-counts.RData")

library(tidyverse)

requests <- results %>%
  arrange(date, cache, is_automata, desc(requests)) %>%
  mutate(
    type = dplyr::if_else(is_automata, "automata", "user"),
    Date = factor(format(date, "%b %d"))
  ) %>%
  select(-c(has_referrer, has_ua, is_automata))
readr::write_csv(requests, "~/maps-tile-request-counts.csv")
rm(results)

p <- ggplot(requests, aes(x = Date, y = requests)) +
  geom_violin(
    draw_quantiles = c(0.25, 0.5, 0.9, 0.95),
    adjust = 2
  ) +
  facet_grid(cache ~ type) +
  scale_y_log10(breaks = c(1e0, 1e1, 1e2, 1e3, 1e4, 1e5), labels = polloi::compress) +
  labs(
    title = "Wikimedia Maps tile requests per IP address by cache status",
    subtitle = "Segments on the distributions indicate 25%, 50%, 90%, and 95% percentiles",
    y = "Daily requests (on log scale)",
    caption = "Across both user types and all cache statuses, 95% of IP addresses 1000 or fewer tile requests per day
    With the exception of type:user & cache:hit, 90% of IP addresses make 100 or fewer tile requests per day"
  ) +
  theme_minimal(base_family = "Source Sans Pro") +
  theme(legend.position = "bottom",
        strip.background = element_rect(fill = "gray90"),
        panel.border = element_rect(color = "gray30", fill = NA),
        panel.grid.minor.y = element_blank())
print(p)

aggregates <- as.data.frame(do.call(rbind, lapply(
  split(requests$requests, list(requests$date, requests$cache, requests$type)),
  quantile,
  probs = c(0.95, 0.975, 0.99)
)))
row_names <- rownames(aggregates)
rownames(aggregates) <- NULL
aggregates <- row_names %>%
  strsplit(split = ".", fixed = TRUE) %>%
  lapply(rbind) %>%
  do.call(rbind, .) %>%
  as.data.frame(stringsAsFactors = FALSE) %>%
  set_names(c("date", "cache", "type")) %>%
  cbind(aggregates) %>%
  gather(percentile, requests, -c(date, cache, type)) %>%
  mutate(date = as.Date(date))

ggplot(aggregates, aes(x = date, y = requests, color = percentile)) +
  geom_hline(yintercept = 1e3, linetype = "dashed") +
  geom_line(size = 1.1) +
  facet_grid(cache ~ type) +
  labs(
    title = "Wikimedia Maps tile requests per IP address by user type and cache status",
    y = "Daily requests",
    caption = "If we set the limit to 1000 tiles per day, it looks like even 99% of IP addresses would be okay with occasional exceptions"
  ) +
  scale_y_continuous(labels = polloi::compress, breaks = seq(0, 2500, 500)) +
  scale_color_brewer(palette = "Set1") +
  theme_minimal(base_family = "Source Sans Pro") +
  theme(legend.position = "bottom",
        strip.background = element_rect(fill = "gray90"),
        panel.border = element_rect(color = "gray30", fill = NA),
        panel.grid.minor.y = element_blank())
I'd upload the dataset but even gzipped it's like 50MB.
@Gehel said the traffic team needs to take a look at this before we can call it done.
@mpopov I love your graphs! They just look nice!
That being said, we probably want to set a rate limit per minute or per second. We most probably can't keep per-IP state for a full day. Would it be possible to get maxima (or 99-%ile) per minute and second?
Aw, thank you! :D
That being said, we probably want to set a rate limit per minute or per second. We most probably can't keep per-IP state for a full day. Would it be possible to get maxima (or 99-%ile) per minute and second?
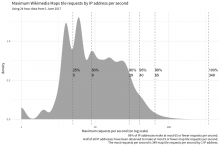
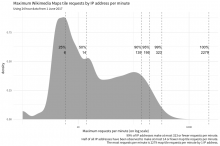
Totally! Here ya go:
Appendix
For future self if I need to do this again:
query <- paste0("WITH tile_requests AS (
  SELECT
    ts AS timestamp, client_ip AS ip_address, MD5(user_agent) AS ua_hash, cache_status AS cache,
    CASE
      WHEN (
        -- if we marked the request as being user, let's perform a few additional checks:
        agent_type = 'user' AND (
          -- look for URLs in UA
          user_agent RLIKE 'https?://'
          OR INSTR(user_agent, 'www.') > 0
          OR INSTR(user_agent, 'github') > 0
          -- look for email address in UA
          OR LOWER(user_agent) RLIKE '([a-z0-9._%-]+@[a-z0-9.-]+\\.(com|us|net|org|edu|gov|io|ly|co|uk))'
          -- last (but not least), check if we can't parse any useful info from UA
          OR (
            user_agent_map['browser_family'] = 'Other'
            AND user_agent_map['device_family'] = 'Other'
            AND user_agent_map['os_family'] = 'Other'
          )
        )
      ) OR agent_type = 'spider' THEN 'TRUE'
      ELSE 'FALSE'
    END AS is_automata,
    IF(referer IN('-', '', ' '), 'FALSE', 'TRUE') AS has_referrer,
    IF(user_agent IN('-', '', ' '), 'FALSE', 'TRUE') AS has_ua
  FROM wmf.webrequest
  WHERE
    webrequest_source = 'upload'
    AND year = 2017 AND month = 7 AND day = 1 AND hour = ${hour}
    AND uri_host = 'maps.wikimedia.org'
    AND http_status IN('200', '304')
    AND uri_query <> '?loadtesting'
    -- check that the request is Kartotherian tile request ('/{source}/{zoom}/{x}/{y}[@{scale}x].{format}'):
    AND uri_path RLIKE '^/([^/]+)/([0-9]{1,2})/(-?[0-9]+)/(-?[0-9]+)(@([0-9]\\.?[0-9]?)x)?\\.([a-z]+)$'
    -- check for style:
    AND REGEXP_EXTRACT(uri_path, '^/([^/]+)/([0-9]{1,2})/(-?[0-9]+)/(-?[0-9]+)(@([0-9]\\.?[0-9]?)x)?\\.([a-z]+)$', 1) != ''
    -- check for zoom:
    AND REGEXP_EXTRACT(uri_path, '^/([^/]+)/([0-9]{1,2})/(-?[0-9]+)/(-?[0-9]+)(@([0-9]\\.?[0-9]?)x)?\\.([a-z]+)$', 2) != ''
    -- check for scale:
    AND COALESCE(REGEXP_EXTRACT(uri_path, '^/([^/]+)/([0-9]{1,2})/(-?[0-9]+)/(-?[0-9]+)(@([0-9]\\.?[0-9]?)x)?\\.([a-z]+)$', 6), '1') != ''
    -- check for format:
    AND REGEXP_EXTRACT(uri_path, '^/([^/]+)/([0-9]{1,2})/(-?[0-9]+)/(-?[0-9]+)(@([0-9]\\.?[0-9]?)x)?\\.([a-z]+)$', 7) != ''
)
SELECT timestamp, ip_address, ua_hash, cache, is_automata, has_referrer, has_ua, COUNT(1) AS requests
FROM tile_requests
GROUP BY timestamp, ip_address, ua_hash, cache, is_automata, has_referrer, has_ua;\n")

message("Buckle up, let's get a day's worth of data!")
results <- do.call(rbind, lapply(0:23, function(hr) {
  message("Counting sister search-referred pageviews from hour ", hr + 1, "...")
  imputed_query <- sub("${hour}", hr, query, fixed = TRUE)
  return(wmf::query_hive(imputed_query))
}))
message("Done counting.")
results$timestamp <- lubridate::ymd_hms(results$timestamp)

message("Saving interim results...")
save(list = "results", file = "~/maps-tile-request-counts-2.RData", compress = TRUE)

# scp stat2:/home/bearloga/maps-tile-request-counts-2.RData ~/Desktop/
load("~/Desktop/maps-tile-request-counts-2.RData")

library(tidyverse)

requests <- data.table::as.data.table(results)
data.table::setkeyv(requests, c("timestamp", "ip_address", "ua_hash"))

per_sec <- requests[, list(requests = max(requests)), by = "ip_address"]

quantiles <- as.data.frame(quantile(per_sec$requests, probs = c(0.25, 0.5, .9, .95, .99, 1)))
names(quantiles) <- "quantile"
quantiles$prob = rownames(quantiles); rownames(quantiles) <- NULL

p <- per_sec %>%
  ggplot(aes(x = requests)) +
  geom_density(adjust = 2, fill = "gray70", color = NA) +
  geom_vline(xintercept = quantiles$quantile, linetype = "dashed", color = "gray50") +
  geom_text(data = quantiles, aes(x = quantile, y = 0.6, label = paste0(prob, "\n", quantile), hjust = "left")) +
  scale_x_log10() +
  labs(
    title = "Maximum Wikimedia Maps tile requests by IP address per second",
    subtitle = "Using 24 hour data from 1 June 2017",
    x = "Maximum requests per second (on log scale)",
    caption = "99% of IP addresses make at most 65 or fewer requests per second.
    Half of all IP addresses have been observed to make at most 9 or fewer map tile requests per second.
    The most requests per second is 349 map tile requests per second by 1 IP address."
  ) +
  theme_minimal(base_family = "Source Sans Pro")
print(p)

## I tried to see if maybe there was a relationship between max per second and total per day. Nope.
# totals <- requests[, list(total = sum(requests)), by = "ip_address"] %>%
#   dplyr::left_join(dplyr::rename(per_sec, `max per second` = requests), by = "ip_address")
# p <- totals %>%
#   ggplot(aes(x = `max per second`, y = total)) +
#   scale_y_log10() +
#   scale_x_log10() +
#   geom_point()
# print(p)

requests$minute <- lubridate::round_date(requests$timestamp, unit = "min")
per_min <- requests[, list(requests = sum(requests)), by = c("ip_address", "minute")][, list(requests = max(requests)), by = "ip_address"]

quantiles <- as.data.frame(quantile(per_min$requests, probs = c(0.25, 0.5, .9, .95, .99, 1)))
names(quantiles) <- "quantile"
quantiles$prob = rownames(quantiles); rownames(quantiles) <- NULL

p <- per_min %>%
  ggplot(aes(x = requests)) +
  geom_density(adjust = 2, fill = "gray70", color = NA) +
  geom_vline(xintercept = quantiles$quantile, linetype = "dashed", color = "gray50") +
  geom_text(data = quantiles, aes(x = quantile, y = 0.6, label = paste0(prob, "\n", quantile), hjust = "right")) +
  scale_x_log10() +
  labs(
    title = "Maximum Wikimedia Maps tile requests by IP address per minute",
    subtitle = "Using 24 hour data from 1 June 2017",
    x = "Maximum requests per minute (on log scale)",
    caption = "99% of IP addresses make at most 323 or fewer requests per minute.
    Half of all IP addresses have been observed to make at most 14 or fewer map tile requests per minute.
    The most requests per minute is 2279 map tile requests per minute by 1 IP address."
  ) +
  theme_minimal(base_family = "Source Sans Pro")
print(p)
@BBlack / @ema we seem to have a good grasp on the "usual" maps traffic. I'll let you take over and see if we want to implement rate limiting based on those numbers. It is an extract from a single day, but it should give us a reasonable baseline.
As a very short summary of @mpopov's analyis:
We would not limit anyone in the sample with:
- 350 req/sec
- 2300 req/minute
I'm not sure I agree with this conclusion? A Pokemon Go fansite using our tiles making 349 req/sec would not be rate-limited? If we set the limit to 100 req/sec and/or 400 req/min, then 99% of IP addresses would be OK. The top ~1% would be the heavy users like the Pokemon Go fansites that we essentially want to limit, no?
Note that currently our servers are mostly idling. Blocking anyone right now will not serve any purpose.
I'm actually totally unsure of what conclusion we should have at this point, and that's why I'd like our friends from traffic to weight in. In the current unlimited situation, we seem to do fine. Obviously if everyone starts sending 300 req/sec, we might not be as fine as we are now.
If I understand correctly, the current rate limiting solution is to actually to not serve requests over the limit. So we probably want to be careful about what we limit and start with a high limit and lower it over time more than start with a low limit and raise it. But this is something where input from the traffic team will be helpful.
So, @mpopov's analysis seems to be based on all requests, including varnish cache hits. On the cache_text cluster, we're currently rate-limiting only requests that do hit the applayer (cache miss/pass).
With that in mind, the current limits on the cache_text cluster for cache miss/pass is:
- RestBase, MW API, Wikidata: 1000req/10sec (100/s, allowing bursts up to 1k)
- All others: 1000req/50sec (20/s, allowing bursts up to 1k)
My impression is that 100/s with 1k bursts could be a good initial setting for maps too.
+1 on using a similar rate to the APIs on text. I wonder what the peak (ab?)users' rates on upload.wikimedia.org look like as well, and whether one shared ratelimit for both might make sense.
I'm not sure I agree with this conclusion? A Pokemon Go fansite using our tiles making 349 req/sec would not be rate-limited? If we set the limit to 100 req/sec and/or 400 req/min, then 99% of IP addresses would be OK. The top ~1% would be the heavy users like the Pokemon Go fansites that we essentially want to limit, no?
No requests would be coming from Pokemon Go sites, nor would any be coming from Wikipedia. All the requests are direct from users. As a full 1080p screen of map tiles is about 40 tiles, a user is unlikely to ever hit 100/s. I'm skeptical that even a tile scraping app would hit that easily as you couldn't hit that with our servers and 4 download threads.
Over the last 30 days, backend requests seem to peak at ~80 req/s. So a global cap at 100 req/s for cache miss seems reasonable, but seems a bit high for a cap per user (for whatever definition of user we use - IP / IP+UA / ...). From the above discussion, I'm not entirely sure what kind of rate limiting we use.
Do you need more input from our side? We could ask @mpopov for a more detailed analysis of cache misses, but I'd like to be sure we ask him the right questions before he gets to work...
It's just per-IP. So yes that sounds fine: if you're peaking at 80/s total, then lets put an upper sanity bound at 100/s misses (per IP) for now. Once we have any limit in place and working, it makes it easier to tweak it in realtime later if we need to during an incident response, at least. Any preferences for a deploy time to be sure whoever needs to be around to check for any fallout is around?
@BBlack I'm probably the one who should be around. I can be available any time from 10am to 11pm CEST (1am to 2pm PT). Just let me know a bit ahead...
Sorry, it's fallen off the radar lately. Let's shoot for mid-next-week, perhaps Weds?
Change 375354 had a related patch set uploaded (by Ema; owner: Ema):
[operations/puppet@production] varnish: introduce rate limiting for maps
Change 375354 merged by Ema:
[operations/puppet@production] varnish: introduce rate limiting for maps
Rate limiting has been enabled by @ema. Everything is looking good so far. This task can be closed and we'll open up follow up tasks in the unlikely case of an issue.


