Page MenuHomePhabricator

Analytics Kafka cluster causing timeouts to Varnishkafka since July 28th
Closed, ResolvedPublic

Description

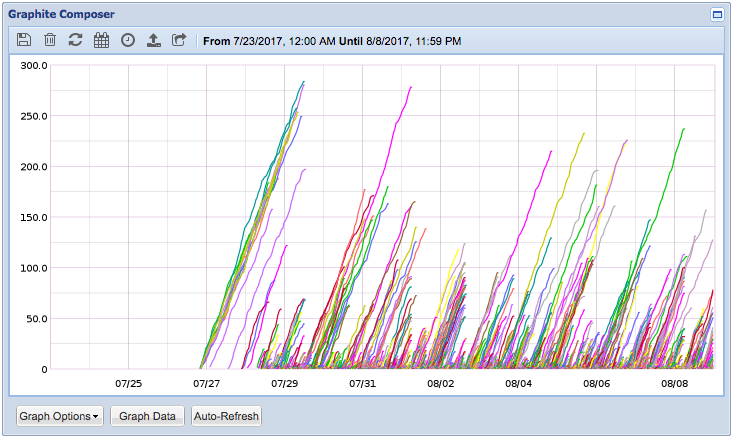
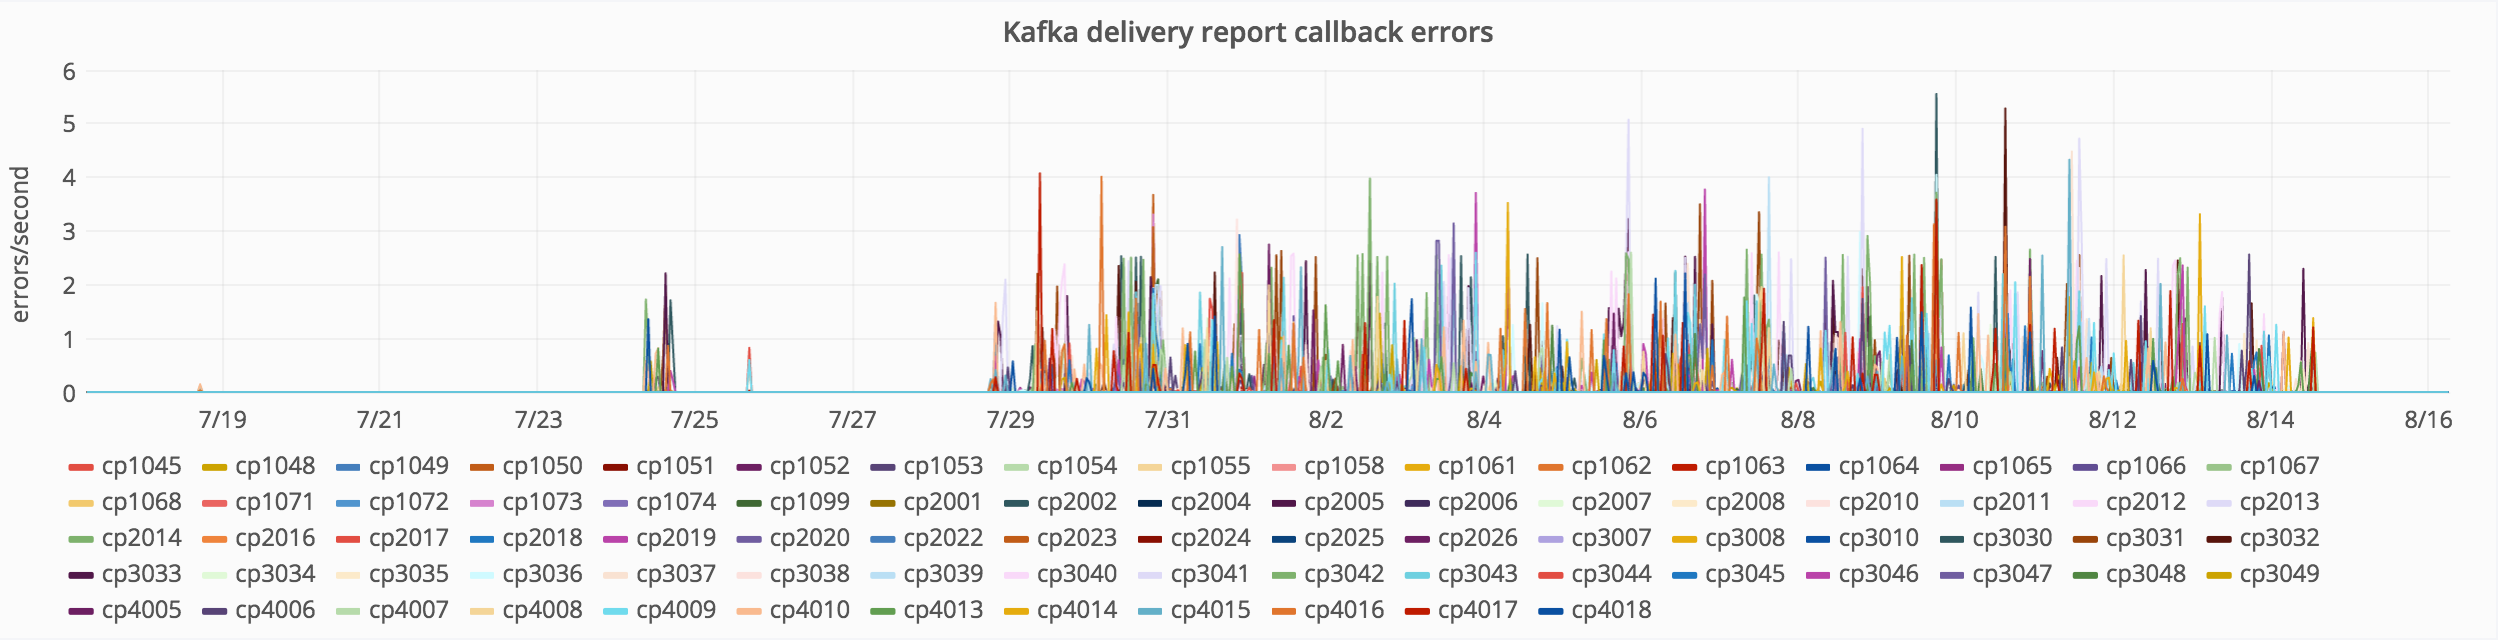
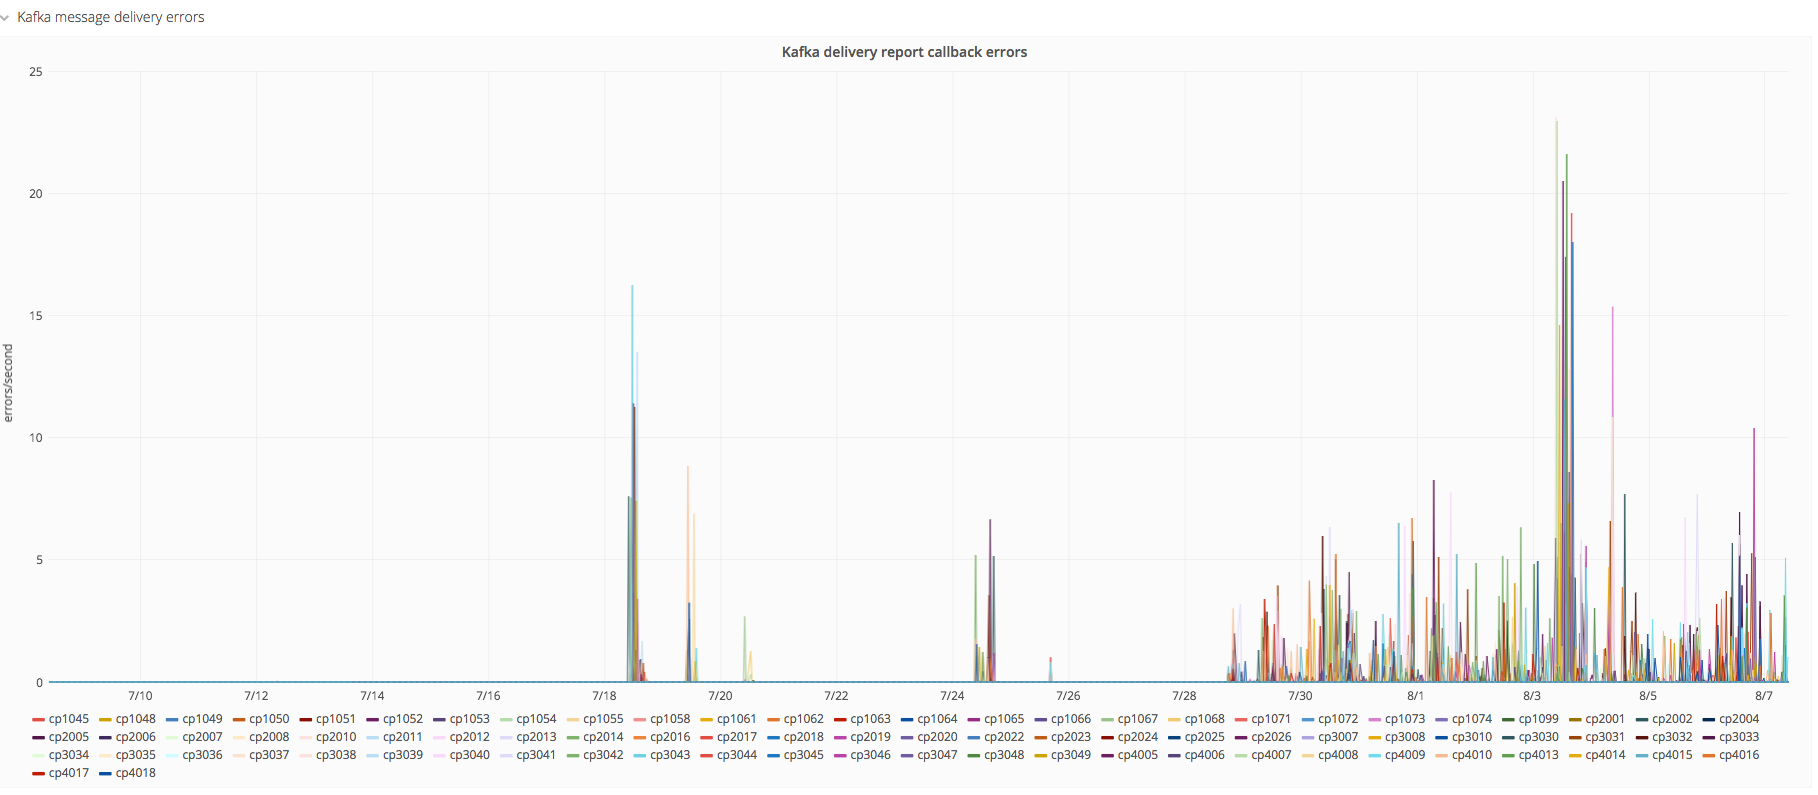
Varnishkafka seems reporting errors from July 28th ~18 UTC:

https://grafana.wikimedia.org/dashboard/db/varnishkafka?panelId=20&fullscreen&orgId=1&from=now-30d&to=now

Screen Shot 2017-08-07 at 12.05.14 PM.png (795×1 px, 201 KB)

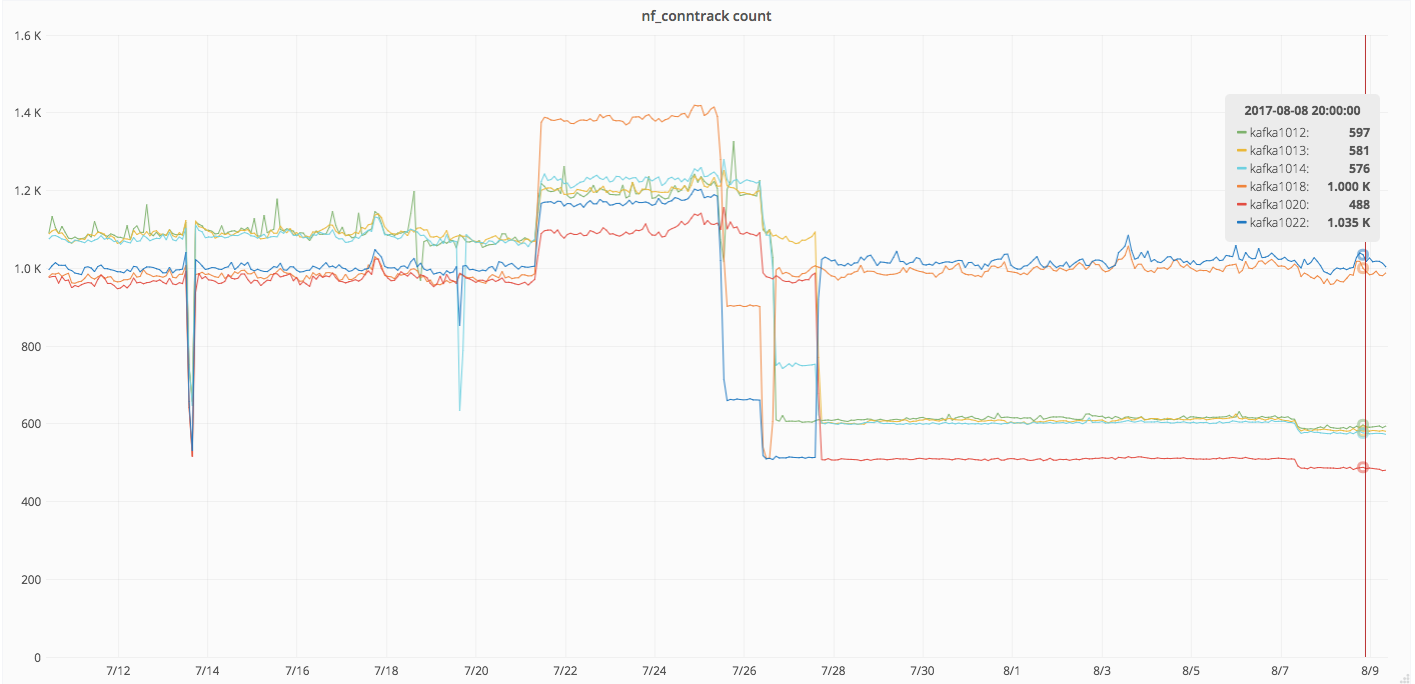
This seems to be related to the following error constantly being logged on all the brokers (note the timing):

[2017-07-28 17:39:53,099] INFO Rolled new log segment for 'webrequest_text-15' in 23 ms. (kafka.log.Log)
[2017-07-28 17:39:55,750] INFO Rolled new log segment for 'webrequest_text-8' in 1 ms. (kafka.log.Log)
[2017-07-28 17:40:30,308] INFO Rolled new log segment for 'mediawiki_ApiAction-9' in 1 ms. (kafka.log.Log)
[2017-07-28 17:41:01,705] ERROR Processor got uncaught exception. (kafka.network.Processor)
java.lang.ArrayIndexOutOfBoundsException: 18
        at org.apache.kafka.common.protocol.ApiKeys.forId(ApiKeys.java:68)
        at org.apache.kafka.common.requests.AbstractRequest.getRequest(AbstractRequest.java:39)
        at kafka.network.RequestChannel$Request.<init>(RequestChannel.scala:79)
        at kafka.network.Processor$$anonfun$run$11.apply(SocketServer.scala:426)
        at kafka.network.Processor$$anonfun$run$11.apply(SocketServer.scala:421)
        at scala.collection.Iterator$class.foreach(Iterator.scala:742)
        at scala.collection.AbstractIterator.foreach(Iterator.scala:1194)
        at scala.collection.IterableLike$class.foreach(IterableLike.scala:72)
        at scala.collection.AbstractIterable.foreach(Iterable.scala:54)
        at kafka.network.Processor.run(SocketServer.scala:421)
        at java.lang.Thread.run(Thread.java:745)
[2017-07-28 17:41:31,700] WARN [ReplicaFetcherThread-1-20], Error in fetch kafka.server.ReplicaFetcherThread$FetchRequest@105e15b2. Possible cause: java.io.IOException: Connection to 20 was disconnected before the response was read (kafka.server.ReplicaFetcherThread)

The corresponding Varnishkafka errors are the following (this one belongs to cp4015 that was one of the first to show it):

Jul 28 17:46:00 cp4015 varnishkafka[1655]: %3|1501263960.918|FAIL|varnishkafka#producer-1| [thrd:kafka1020.eqiad.wmnet:9092/bootstrap]:
Jul 28 17:46:00 cp4015 varnishkafka[1655]: KAFKAERR: Kafka error (-192): kafka1020.eqiad.wmnet:9092/20: 1 request(s) timed out: disconn
Jul 28 17:46:01 cp4015 varnishkafka[1655]: %3|1501263961.919|FAIL|varnishkafka#producer-1| [thrd:kafka1020.eqiad.wmnet:9092/bootstrap]:
Jul 28 17:46:01 cp4015 varnishkafka[1655]: KAFKAERR: Kafka error (-192): kafka1020.eqiad.wmnet:9092/20: 5 request(s) timed out: disconn
Jul 28 17:46:02 cp4015 varnishkafka[1655]: %3|1501263962.957|FAIL|varnishkafka#producer-1| [thrd:kafka1020.eqiad.wmnet:9092/bootstrap]:
Jul 28 17:46:02 cp4015 varnishkafka[1655]: KAFKADR: Kafka message delivery error: Local: Timed out in queue
[.. repeated..]

https://issues.apache.org/jira/browse/KAFKA-3547 (and https://issues.apache.org/jira/browse/KAFKA-3593) seems possibly related, maybe a new producer/consumer is causing these timeouts? Event streams timings might correlate?

EDIT: the kafka jira might be a false lead since we investigated it in https://phabricator.wikimedia.org/T160886 too.

Event Timeline

Mentioned in SAL (#wikimedia-operations) [2017-08-07T12:39:18Z] <elukey> restart kafka on kafka1018 to force it out of the kafka topic leaders - T172681

From https://apache.googlesource.com/kafka/+/refs/heads/trunk/clients/src/main/java/org/apache/kafka/common/protocol/ApiKeys.java it seems that 18 is API_VERSIONS(18, "ApiVersions"),, but this is only a quick check and not a careful code review.

After restarting the broker I noticed an improvement in kafka1018's lag metrics (it was the only one with a tiny bit of errors for ISR shrinks) but the main error didn't go away from the brokers logs.

Now I need to figure out if a new client with settings hitting KAFKA-3593 started on the 28th and caused a domino effect on the others (forcing kafka brokers to pile up connections) or if Varnishkafka for some reason is affected as well. Afaics librdkafka 0.9.4.1 fixed the issue with api.version.request=false by default (more info in https://github.com/edenhill/librdkafka/releases) so it might be the case that all producers/consumers need to be upgraded to the latest in jessie wikimedia (we still have 0.9.1 in some places).

Change 370631 had a related patch set uploaded (by Elukey; owner: Elukey):
[operations/puppet/varnishkafka@master] Force Kafka protocol version

https://gerrit.wikimedia.org/r/370631

Change 370631 merged by Elukey:
[operations/puppet/varnishkafka@master] Force Kafka protocol version

https://gerrit.wikimedia.org/r/370631

Change 370637 had a related patch set uploaded (by Elukey; owner: Elukey):
[operations/puppet@production] role::cache::kafka::*: force kafka protocol to 0.9.0.1

https://gerrit.wikimedia.org/r/370637

Change 370637 abandoned by Elukey:
role::cache::kafka::*: force kafka protocol to 0.9.0.1

Reason:
Will apply the change only to statsv/eventlogging first

https://gerrit.wikimedia.org/r/370637

Change 370644 had a related patch set uploaded (by Elukey; owner: Elukey):
[operations/puppet@production] role::cache::kafka::[el|statsv]: force kafka protocol to 0.9.0.1

https://gerrit.wikimedia.org/r/370644

Change 370644 merged by Elukey:
[operations/puppet@production] role::cache::kafka::[el|statsv]: force kafka protocol to 0.9.0.1

https://gerrit.wikimedia.org/r/370644

Change 370659 had a related patch set uploaded (by Elukey; owner: Elukey):
[operations/puppet@production] role::cache::kafka::webrequest: force Kafka protocol to 0.9.0.1

https://gerrit.wikimedia.org/r/370659

Change 370659 merged by Elukey:
[operations/puppet@production] role::cache::kafka::webrequest: force Kafka protocol to 0.9.0.1

https://gerrit.wikimedia.org/r/370659

All the varnishkafkas are now forced (via lidbrdkafka settings) to communicate using the kafka 0.9.0.1 protocol, but it didn't change much. I asked to Jeff Green to stop kafkatee to see if it was responsible for the exceptions, but nothing really changed in the kafka logs.

The varnishkafka metrics seems to show that there is a general slowdown once in a while that causes too many messages to be queued by varnishkafka, but I don't have a lot of ideas about what could possibly be.

I finally managed to find a graphite query that gives me useful data from EventStreams (the grafana dashboard times out, probably too much data):

eventstreams.rdkafka.*.brokers.kafka1018_eqiad_wmnet_9092_18.tx

Screen Shot 2017-08-09 at 11.09.44 AM.png (436×732 px, 157 KB)

This is the current topic/partition layout for eventstreams:

Topic:mediawiki.revsion-create	PartitionCount:1	ReplicationFactor:3	Configs:
	Topic: mediawiki.revsion-create	Partition: 0	Leader: 18	Replicas: 18,20,22	Isr: 22,20,18

Topic:codfw.mediawiki.recentchange      PartitionCount:1        ReplicationFactor:3     Configs:
        Topic: codfw.mediawiki.recentchange     Partition: 0    Leader: 22      Replicas: 22,18,20      Isr: 22,20,18

This is the current status of connection tracked by nf_conntrack:

Screen Shot 2017-08-09 at 11.12.53 AM.png (684×1 px, 164 KB)

So the 1018/22 brokers are indeed overloaded by eventstreams, since they are the leaders of the topics used. There are two possible line of investigation from now on:

  1. Check whether or not eventstreams is suffering/causing https://issues.apache.org/jira/browse/KAFKA-3547 and possibly force a API version.
  1. Increase the number of partitions for the eventstreams topic to spread the load?

Change 370793 had a related patch set uploaded (by Elukey; owner: Elukey):
[operations/puppet@production] eventstreams: set Kafka API version to 0.9.0.1

https://gerrit.wikimedia.org/r/370793

Change 370793 had a related patch set uploaded (by Elukey; owner: Elukey):
[operations/puppet@production] eventstreams: set Kafka API version to 0.9.0.1

https://gerrit.wikimedia.org/r/370793

Change 370793 merged by Elukey:
[operations/puppet@production] eventstreams: set Kafka API version to 0.9.0.1

https://gerrit.wikimedia.org/r/370793

Change 370842 had a related patch set uploaded (by Mobrovac; owner: Mobrovac):
[operations/puppet@production] [UGLY-FIX] EventStreams: Double-quote false to avoid False

https://gerrit.wikimedia.org/r/370842

Change 370842 merged by Elukey:
[operations/puppet@production] [UGLY-FIX] EventStreams: Double-quote false to avoid False

https://gerrit.wikimedia.org/r/370842

Change 370850 had a related patch set uploaded (by Elukey; owner: Elukey):
[operations/puppet@production] role:eventstreams: unset api.version.request due to a scap bug

https://gerrit.wikimedia.org/r/370850

Change 370850 merged by Elukey:
[operations/puppet@production] role:eventstreams: unset api.version.request due to a scap bug

https://gerrit.wikimedia.org/r/370850

Upgraded librdkafka to 0.9.4.1 on eventlog1001 but no real changes registered.

I tried to set again debug logging on cp3032 (text) but stopped because the issue didn't occur.

Another interesting thing is the fact that the error *always* happens once per minute at the first second:

[2017-08-10 12:05:01,720] ERROR Processor got uncaught exception. (kafka.network.Processor)
[2017-08-10 12:06:01,762] ERROR Processor got uncaught exception. (kafka.network.Processor)
[2017-08-10 12:07:01,795] ERROR Processor got uncaught exception. (kafka.network.Processor)
[2017-08-10 12:08:01,820] ERROR Processor got uncaught exception. (kafka.network.Processor)
[2017-08-10 12:09:01,851] ERROR Processor got uncaught exception. (kafka.network.Processor)
[2017-08-10 12:10:01,888] ERROR Processor got uncaught exception. (kafka.network.Processor)
[2017-08-10 12:11:01,920] ERROR Processor got uncaught exception. (kafka.network.Processor)
[2017-08-10 12:12:01,960] ERROR Processor got uncaught exception. (kafka.network.Processor)
[2017-08-10 12:13:01,990] ERROR Processor got uncaught exception. (kafka.network.Processor)
[2017-08-10 12:14:01,031] ERROR Processor got uncaught exception. (kafka.network.Processor)
[2017-08-10 12:15:01,057] ERROR Processor got uncaught exception. (kafka.network.Processor)
[2017-08-10 12:16:01,094] ERROR Processor got uncaught exception. (kafka.network.Processor)
[2017-08-10 12:17:01,135] ERROR Processor got uncaught exception. (kafka.network.Processor)
[2017-08-10 12:18:01,178] ERROR Processor got uncaught exception. (kafka.network.Processor)
[2017-08-10 12:19:01,196] ERROR Processor got uncaught exception. (kafka.network.Processor)
[2017-08-10 12:20:01,233] ERROR Processor got uncaught exception. (kafka.network.Processor)
[2017-08-10 12:21:01,270] ERROR Processor got uncaught exception. (kafka.network.Processor)
[2017-08-10 12:22:01,338] ERROR Processor got uncaught exception. (kafka.network.Processor)
[2017-08-10 12:23:01,338] ERROR Processor got uncaught exception. (kafka.network.Processor)
[2017-08-10 12:24:01,383] ERROR Processor got uncaught exception. (kafka.network.Processor)

The issue seems to happen with a /bootstrap request, and the metadata.refresh.timeout in librdkafka is by default 60s.

Now I have no idea how this could impact the broker.

Mentioned in SAL (#wikimedia-operations) [2017-08-10T14:11:19Z] <elukey> restart kafka1012 temporary with some logs to TRACE to debug T172681

Example of more verbose logging from kafka1012, a bit frustrating since the exception does not tell a lot about which Processor failed:

[2017-08-10 14:16:01,259] DEBUG Processor 0 listening to new connection from /10.64.16.54:33144 (kafka.network.Processor)
[2017-08-10 14:16:01,259] DEBUG Processor 1 listening to new connection from /10.64.48.67:43566 (kafka.network.Processor)
[2017-08-10 14:16:01,259] TRACE Socket server received response to send, registering for write and sending data: Response(0,Request(0,10.64.5.12:9092-10.64.16.54:33144,Session(User:ANONYMOUS,/10.64.16.54),null,1502374561259,PLAINTEXT),kafka.network.RequestOrResponseSend@605fc2ec,SendAction) (kafka.network.Processor)
[2017-08-10 14:16:01,260] TRACE Socket server received response to send, registering for write and sending data: Response(2,Request(2,10.64.5.12:9092-10.64.48.35:47078,Session(User:ANONYMOUS,/10.64.48.35),null,1502374561259,PLAINTEXT),kafka.network.RequestOrResponseSend@2ef64562,SendAction) (kafka.network.Processor)
[2017-08-10 14:16:01,260] TRACE Socket server received response to send, registering for write and sending data: Response(0,Request(0,10.64.5.12:9092-10.64.48.69:45386,Session(User:ANONYMOUS,/10.64.48.69),null,1502374561259,PLAINTEXT),kafka.network.RequestOrResponseSend@2a453d04,SendAction) (kafka.network.Processor)
[2017-08-10 14:16:01,260] DEBUG Processor 2 listening to new connection from /10.64.32.63:40100 (kafka.network.Processor)
[2017-08-10 14:16:01,260] DEBUG Processor 0 listening to new connection from /10.64.0.78:49262 (kafka.network.Processor)
[2017-08-10 14:16:01,260] TRACE Socket server received response to send, registering for write and sending data: Response(1,Request(1,10.64.5.12:9092-10.64.48.67:43566,Session(User:ANONYMOUS,/10.64.48.67),null,1502374561259,PLAINTEXT),kafka.network.RequestOrResponseSend@4d6f5c3a,SendAction) (kafka.network.Processor)
[2017-08-10 14:16:01,260] DEBUG Processor 1 listening to new connection from /208.80.154.52:41852 (kafka.network.Processor)
[2017-08-10 14:16:01,260] DEBUG Processor 2 listening to new connection from /10.64.0.77:46416 (kafka.network.Processor)

[2017-08-10 14:16:01,260] ERROR Processor got uncaught exception. (kafka.network.Processor)
java.lang.ArrayIndexOutOfBoundsException

[2017-08-10 14:16:01,260] TRACE Socket server received response to send, registering for write and sending data: Response(2,Request(2,10.64.5.12:9092-10.64.32.63:40100,Session(User:ANONYMOUS,/10.64.32.63),null,1502374561260,PLAINTEXT),kafka.network.RequestOrResponseSend@47e49206,SendAction) (kafka.network.Processor)
[2017-08-10 14:16:01,260] TRACE Socket server received response to send, registering for write and sending data: Response(0,Request(0,10.64.5.12:9092-10.64.0.78:49262,Session(User:ANONYMOUS,/10.64.0.78),null,1502374561260,PLAINTEXT),kafka.network.RequestOrResponseSend@65d9f30f,SendAction) (kafka.network.Processor)
[2017-08-10 14:16:01,261] TRACE Socket server received response to send, registering for write and sending data: Response(2,Request(2,10.64.5.12:9092-10.64.0.77:46416,Session(User:ANONYMOUS,/10.64.0.77),null,1502374561260,PLAINTEXT),kafka.network.RequestOrResponseSend@71bbb925,SendAction) (kafka.network.Processor)
[2017-08-10 14:16:01,263] DEBUG Processor 0 listening to new connection from /10.64.16.50:35786 (kafka.network.Processor)
[2017-08-10 14:16:01,263] DEBUG Processor 1 listening to new connection from /10.64.48.69:45400 (kafka.network.Processor)
[2017-08-10 14:16:01,264] TRACE Socket server received response to send, registering for write and sending data: Response(0,Request(0,10.64.5.12:9092-10.64.16.50:35786,Session(User:ANONYMOUS,/10.64.16.50),null,1502374561263,PLAINTEXT),kafka.network.RequestOrResponseSend@735a5f10,SendAction) (kafka.network.Processor)
[2017-08-10 14:16:01,264] TRACE Socket server received response to send, registering for write and sending data: Response(1,Request(1,10.64.5.12:9092-10.64.48.69:45400,Session(User:ANONYMOUS,/10.64.48.69),null,1502374561263,PLAINTEXT),kafka.network.RequestOrResponseSend@32174e9a,SendAction) (kafka.network.Processor)
[2017-08-10 14:16:01,265] DEBUG Processor 2 listening to new connection from /10.64.48.59:44572 (kafka.network.Processor)
[2017-08-10 14:16:01,265] DEBUG Processor 0 listening to new connection from /10.64.48.34:49464 (kafka.network.Processor)

Screen Shot 2017-08-09 at 11.09.44 AM.png (436×732 px, 157 KB)

Interesting finding: https://gerrit.wikimedia.org/r/#/c/367740/

So around 20 UTC on July 26th eventstreams was updated to nodejs 6.11, and several dependencies got rebuild, like noderdkafka..

@Ottomata @Pchelolo

Turns out I am stupid, Event Streams might not be the culprit. I remembered this morning that we delete whisper files on graphite1001 older than 10 days, so this is why the metrics were matching (more or less) with the 28th. I re-ran the script this morning and it looks completely different:

Screen Shot 2017-08-14 at 12.54.33 PM.png (400×600 px, 116 KB)

So sorry for the waste of time, there might be another client that is causing this issue.

Change 371936 had a related patch set uploaded (by Elukey; owner: Elukey):
[operations/puppet@production] pmacct: add the possibility to configure librdkafka

https://gerrit.wikimedia.org/r/371936

Change 371937 had a related patch set uploaded (by Elukey; owner: Elukey):
[operations/puppet@production] role::pmacct: explicitly set librkafka version

https://gerrit.wikimedia.org/r/371937

Change 371936 merged by Elukey:
[operations/puppet@production] pmacct: add the possibility to configure librdkafka

https://gerrit.wikimedia.org/r/371936

Change 371937 merged by Elukey:
[operations/puppet@production] role::pmacct: explicitly set librkafka version

https://gerrit.wikimedia.org/r/371937

This time the root cause seems found:

2017-07-28
14:11	<paravoid>	upgrading rhenium to stretch via dist-upgrade

This host runs pmacct that uses Kafka to produce network metrics to a specific topic. Since it runs stretch it uses librdkafka 0.11, that by default enables Kafka API version negotiation, not supported by Kafka 0.9 and causing all this mess. I tried to force the Kafka API version via the above two patches but it doesn't work, the version of pmacct that supports librdkafka parameter settings is 1.6.2 and we have 1.6.1

@faidon: Hi :) Any chance that we could upgrade pmacct to 1.6.2 ?

https://github.com/pmacct/pmacct/blob/master/ChangeLog#L26-L29

Mentioned in SAL (#wikimedia-operations) [2017-08-14T13:32:30Z] <elukey> Execute systemctl mask nfacctd on rhenium.wikimedia.org for T172681

nfacctd stopped, immediate recovery on the brokers logs (no more exceptions logged).

Let's wait a bit and see if the varnishkafka errors go away too.

Screen Shot 2017-08-16 at 8.29.45 AM.png (644×2 px, 402 KB)

Seems definitely solved, but some follow ups would need to be done:

  1. Make sure to install/deploy pmacct 1.6.2 (follow up wi Debian maintainers too? Stretch comes with librdkafka 0.11 and this combination is dangerous for 0.9 kafka clusters).
  2. Varnishkafka alarms
  3. Tune kafka logs to have a sort of access log of producers/consumers?
elukey lowered the priority of this task from High to Medium.Aug 16 2017, 6:32 AM

Change 372155 had a related patch set uploaded (by Elukey; owner: Elukey):
[operations/puppet@production] role::cache::kafka::webrequest: tune graphite alarms

https://gerrit.wikimedia.org/r/372155

Change 372155 merged by Elukey:
[operations/puppet@production] role::cache::kafka::webrequest: tune graphite alarms

https://gerrit.wikimedia.org/r/372155

Change 372348 had a related patch set uploaded (by Elukey; owner: Elukey):
[operations/puppet@production] role::cache::kafka:webrequest: fix graphite metric to alarm on

https://gerrit.wikimedia.org/r/372348

Change 372348 merged by Elukey:
[operations/puppet@production] role::cache::kafka:webrequest: fix graphite metric to alarm on

https://gerrit.wikimedia.org/r/372348

Change 372354 had a related patch set uploaded (by Elukey; owner: Elukey):
[operations/puppet@production] role::cache::kafka::webrequest: fix alert varnishkafka metrics

https://gerrit.wikimedia.org/r/372354

Change 372354 merged by Elukey:
[operations/puppet@production] role::cache::kafka::webrequest: fix alert varnishkafka metrics

https://gerrit.wikimedia.org/r/372354

  1. Make sure to install/deploy pmacct 1.6.2 (follow up wi Debian maintainers too? Stretch comes with librdkafka 0.11 and this combination is dangerous for 0.9 kafka clusters).
$ rmadison librdkafka |egrep ' (stable|stretch)'
librdkafka | 0.9.3-1         | stable             | source
librdkafka | 0.11.0-1~bpo9+1 | stretch-backports  | source

i.e. stretch comes with 0.9.3-1, so that's not necessarily a problem for stretch (but it is for us).

pmacct 1.6.2 hasn't been packaged in unstable/testing yet. Once it does, we can backport to stretch and include it in either stretch-backports or stretch-wikimedia. The setup on rhenium is highly experimental -- and also depends on Tranquility, that I think was recently disabled in prod, so all this can wait and there's not really a need for us to update pmacct to 1.6.2 ourselves. I wish I had more time to spend on it :/

Change 401778 had a related patch set uploaded (by Ottomata; owner: Ottomata):
[operations/puppet@production] Force more exact protocol version for varnishkafka statsv

https://gerrit.wikimedia.org/r/401778