We are hitting the limits of our current Wikidata Query Service servers and are planning to acquire more, and in order to size them properly, we need to do a traffic analysis of the external and internal traffic on the current servers.
Description
Description
| Status | Subtype | Assigned | Task | ||
|---|---|---|---|---|---|
| Resolved | • mobrovac | T190266 Switch the Recommendation API to use the internal WDQS cluster | |||
| Resolved | Smalyshev | T178492 Create a more controlled WDQS cluster | |||
| Restricted Task | |||||
| Resolved | mpopov | T179850 Run analysis of WDQS internal and external traffic |
Event Timeline
Comment Actions
Thanks a lot for the analysis!
A few comments / questions in no particular order:
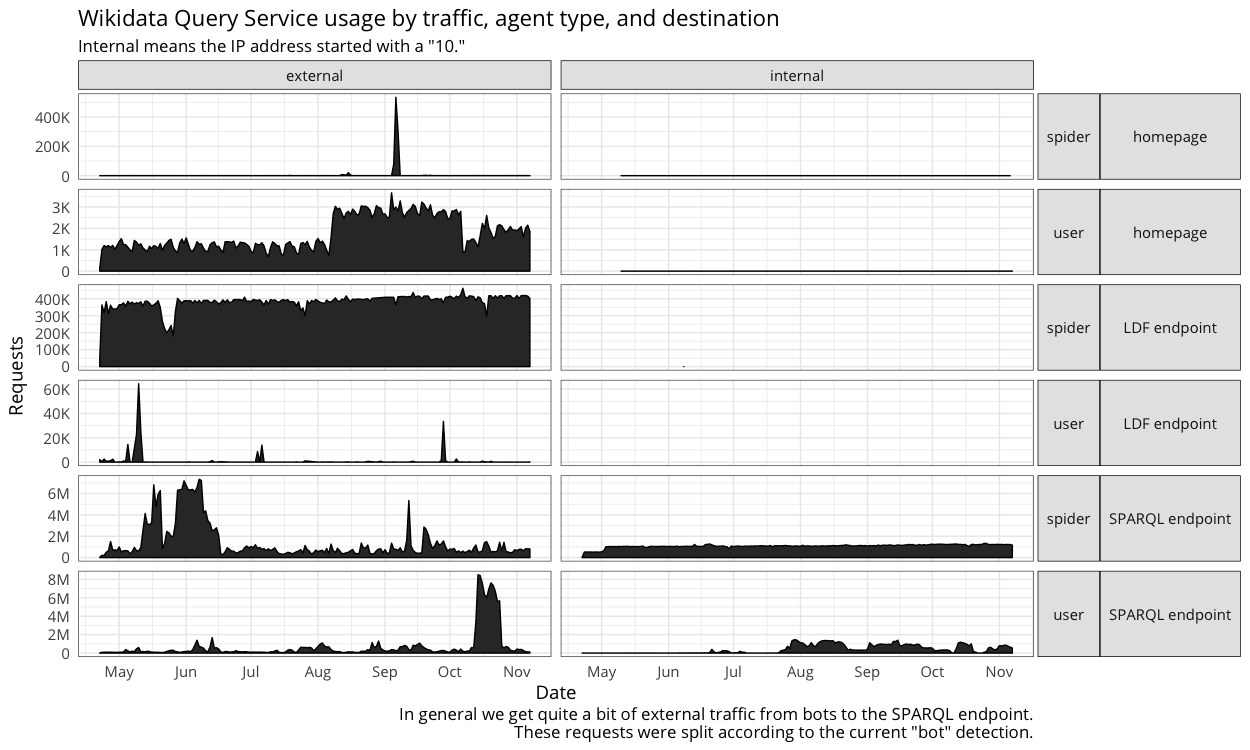
- If I read correctly, the only difference between screenshot 3 and 4 is bot vs spider. I'm wondering why we get spiders from internal (just curiosity)
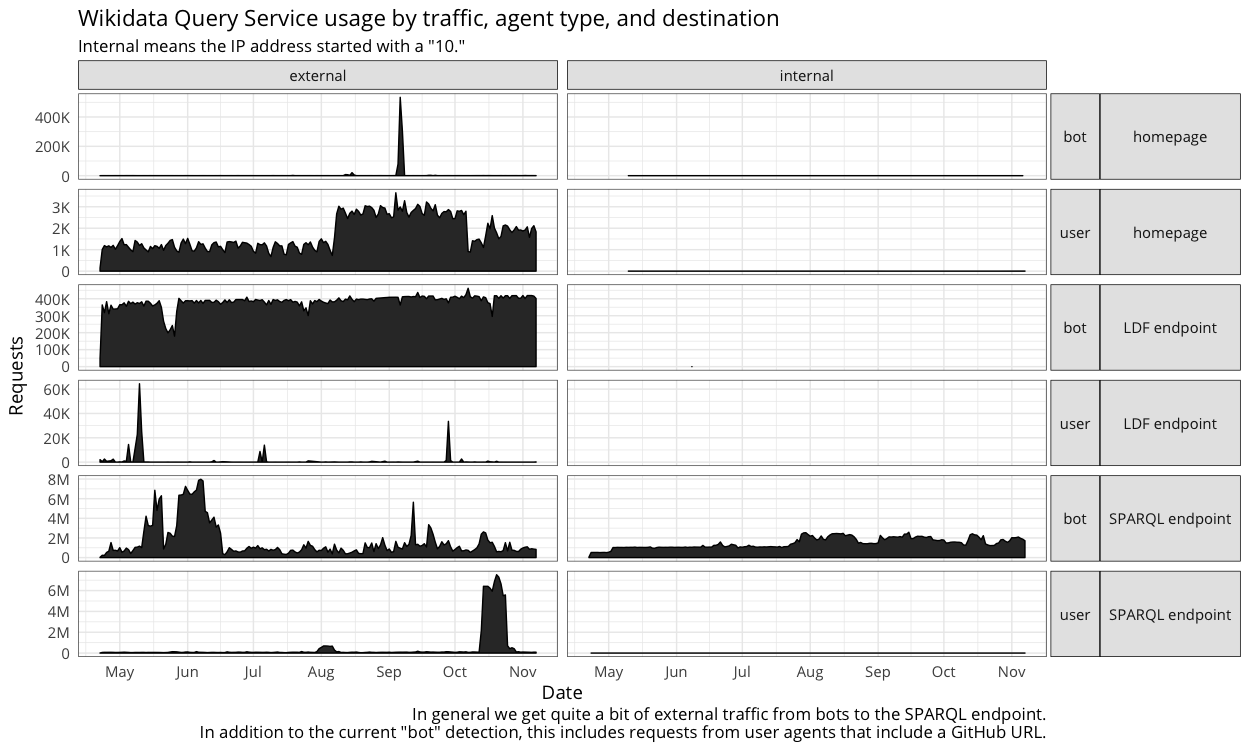
- In screenshot 4, we seem to have user traffic from internal. That seems strange, as we really should not have any users coming from internal.
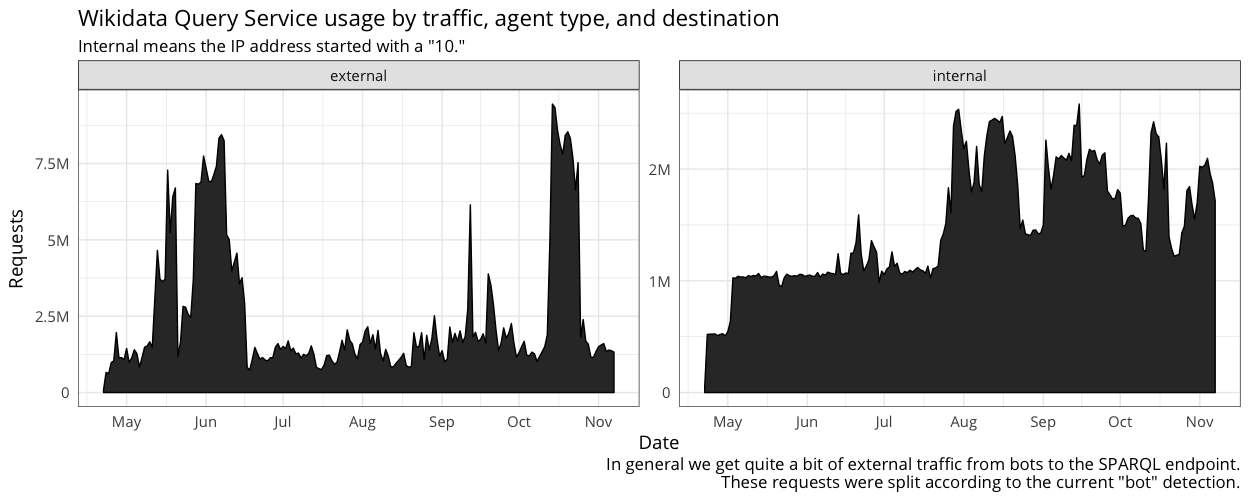
- looking at screenshot 2, it looks like we have almost as much internal requests than external in "normal" times (if we don't count the few high peaks on external traffic).
- internal traffic includes both traffic from labs and traffic from production networks. If we create a dedicated production wdqs cluster, it will most probably be serving production only, not labs (and we know that we have a few expensive bots on labs). Would it be possible / easy to add that differentiation in the analysis?
- on graph 2, 3 and 4 it is not clear to me what the aggregation period is, could you precise it?
- I'm probably misreading this, but why on graph 3 and 4 is the internal / user SPARQL endpoint different?
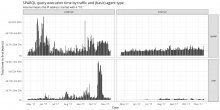
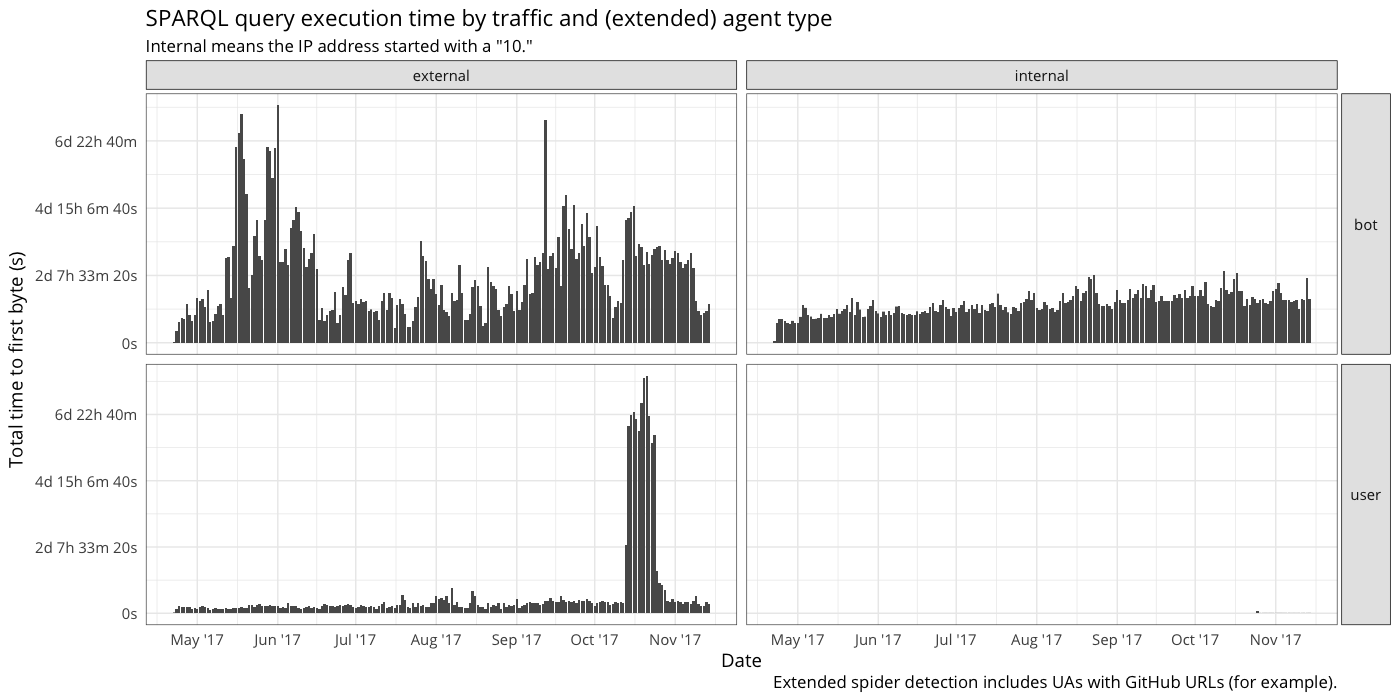
- A good heuristic of load generated by internal vs external traffic is probably the cummulated amount of query time, more than the number of queries (getting 100 requests taking 1ms each is not the same as getting 10 requests taking 10 seconds each...). I suspect that the internal traffic is mainly short requests, but confirmation would be nice. Is this something easy to add?
Don't spend too much time on any of the above points, I'm still not sure what to do with this analysis in any case...
Comment Actions
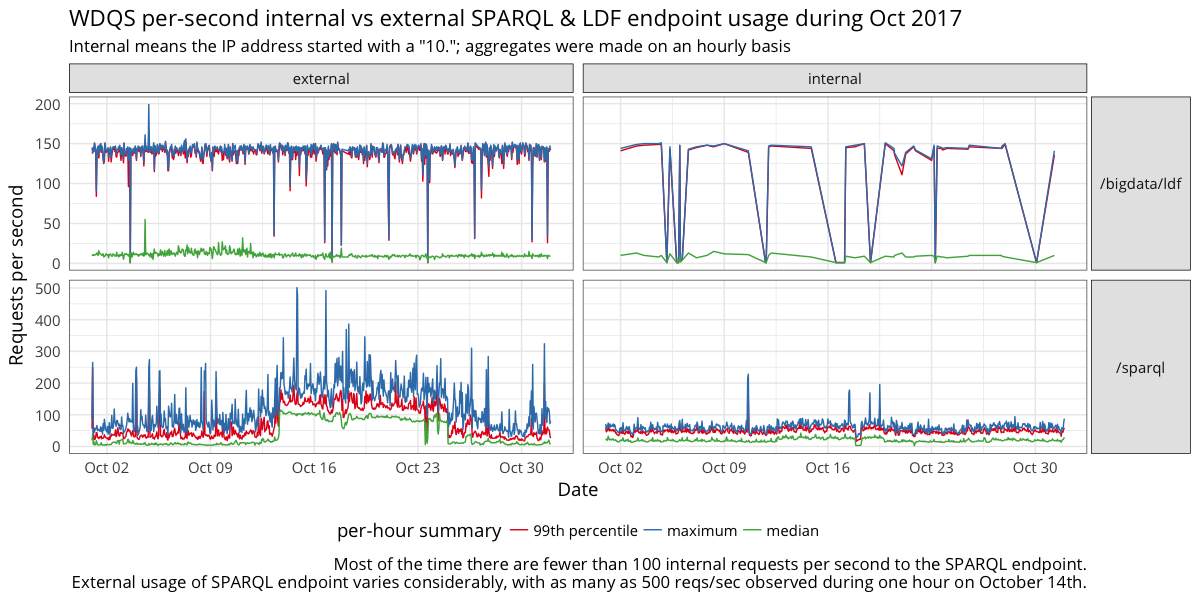
From the first graph I conclude the internal traffic is about 0.2-0.5 of the external one. Which means 3 or even 2 servers could serve it without much trouble, maybe even if we relax timeouts a bit. We also get some LDF traffic, but not too much, which means either keeping LDF server the same place or having another, internal, LDF server, is OK, but LDF is not really too popular with internal clients and running it off single server is ok.
From the 3-4 it looks like the internal traffic is dominated by bots and some labs tools (these are probaly the delta between 3 and 4)
In screenshot 4, we seem to have user traffic from internal.
These could be lab tools?
I'm probably misreading this, but why on graph 3 and 4 is the internal / user SPARQL endpoint different
I think one of them extends "bot" definition to include any user agent with github URL, and another uses standard bot definition.
A good heuristic of load generated by internal vs external traffic is probably the cumulated amount of query time
@mpopov - Would that be hard to do?
Comment Actions
@mpopov - there was a discussion earlier today with @EBjune and @DarTar about the actual usage of our SPARQL endpoint — "there are several people suggested it's the largest on the planet but we don't have good metrics yet other than the raw, bursty data, to back that statement"
Can you expound on that?
Comment Actions

Spider is anything Analytics marked as spider using user agent-based rules + additional rules seen in https://github.com/wikimedia-research/Discovery-WDQS-Adhoc-InternalExternal/blob/296307244922394abfb12262bc5826876cb142b9/T179850.hql#L6--L23
- internal traffic includes both traffic from labs and traffic from production networks. If we create a dedicated production wdqs cluster, it will most probably be serving production only, not labs (and we know that we have a few expensive bots on labs). Would it be possible / easy to add that differentiation in the analysis?
It would help if I knew what to look for so I'm not just digging through user agents without knowing what it is I'm looking for. @Smalyshev do you have a list of bots that you've created or some that you know of?
- on graph 2, 3 and 4 it is not clear to me what the aggregation period is, could you precise it?
Yes, sorry. This is all the WDQS webrequest data we have for 2017.
Yep!
I'm probably misreading this, but why on graph 3 and 4 is the internal / user SPARQL endpoint different
I think one of them extends "bot" definition to include any user agent with github URL, and another uses standard bot definition.
Correct. I noted the difference in the caption at the bottom and my bad for not making it clearer (e.g. including the distinction in the title). The extended "bot" definition can be found here: https://github.com/wikimedia-research/Discovery-WDQS-Adhoc-InternalExternal/blob/296307244922394abfb12262bc5826876cb142b9/T179850.hql#L6--L23
A good heuristic of load generated by internal vs external traffic is probably the cumulated amount of query time
@mpopov - Would that be hard to do?
Here ya go:

I'm not sure what is meant by "raw, bursty data" since we track daily traffic/usage in https://discovery.wmflabs.org/wdqs/
Also, since we might be the only ones that publicly publish our traffic/usage numbers, we can only speculate whether we're the largest on the planet. It's hard to compare against other SPARQL endpoints when we don't know their usage.
Comment Actions
do you have a list of bots that you've created or some that you know of?
I have my bots but not others. I suspect there are a bunch of uses of Listeria - https://www.wikidata.org/wiki/User:ListeriaBot. But there are all on labs. I odn't have any info about anything used in production, maybe Wikibase-Quality-Constraints team does?