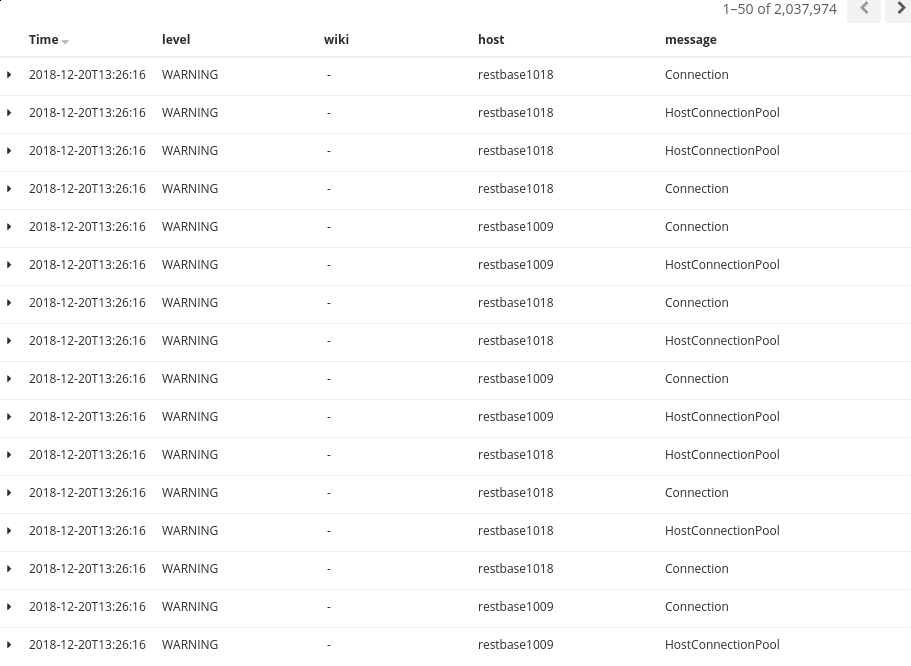
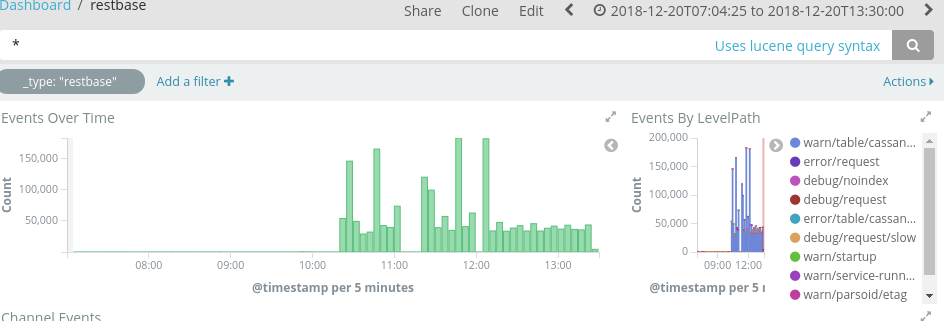
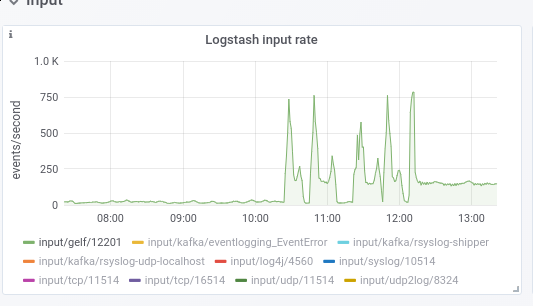
Happened today and yesterday during rolling restarts of cassandra hosts where an host will be down for some time (e.g. T212418). Restbase then logs about 10x its normal log volume when sth like this happens:
| fgiunchedi | |
| Dec 20 2018, 1:30 PM |
| F27716168: 2018-12-24-102006_1484x1330_scrot.png | |
| Dec 24 2018, 9:21 AM |
| F27687317: 2018-12-20-142908_944x321_scrot.png | |
| Dec 20 2018, 1:30 PM |
| F27687318: 2018-12-20-142917_911x666_scrot.png | |
| Dec 20 2018, 1:30 PM |
| F27687316: 2018-12-20-142853_533x306_scrot.png | |
| Dec 20 2018, 1:30 PM |
Happened today and yesterday during rolling restarts of cassandra hosts where an host will be down for some time (e.g. T212418). Restbase then logs about 10x its normal log volume when sth like this happens:
Not long back, we were alarmed to see a very high rate of range-slice requests (a type of query our app does not perform). I wasn't able to find a ticket, but this turned out to be the driver using a SELECT * FROM ... on a small system table as a sort of heartbeat. The queries themselves were harmless, but the number of them was shocking until we realized that every Node worker had it's own connection pool, and that ${workers} * ${hosts} was a very large number.
TL;DR We have one RESTBase worker per CPU, or ~864 workers total. If each worker has it's own connection pool, even a relatively low rate of log messages is going to be significantly amplified. Perhaps we could lower the worker count some?
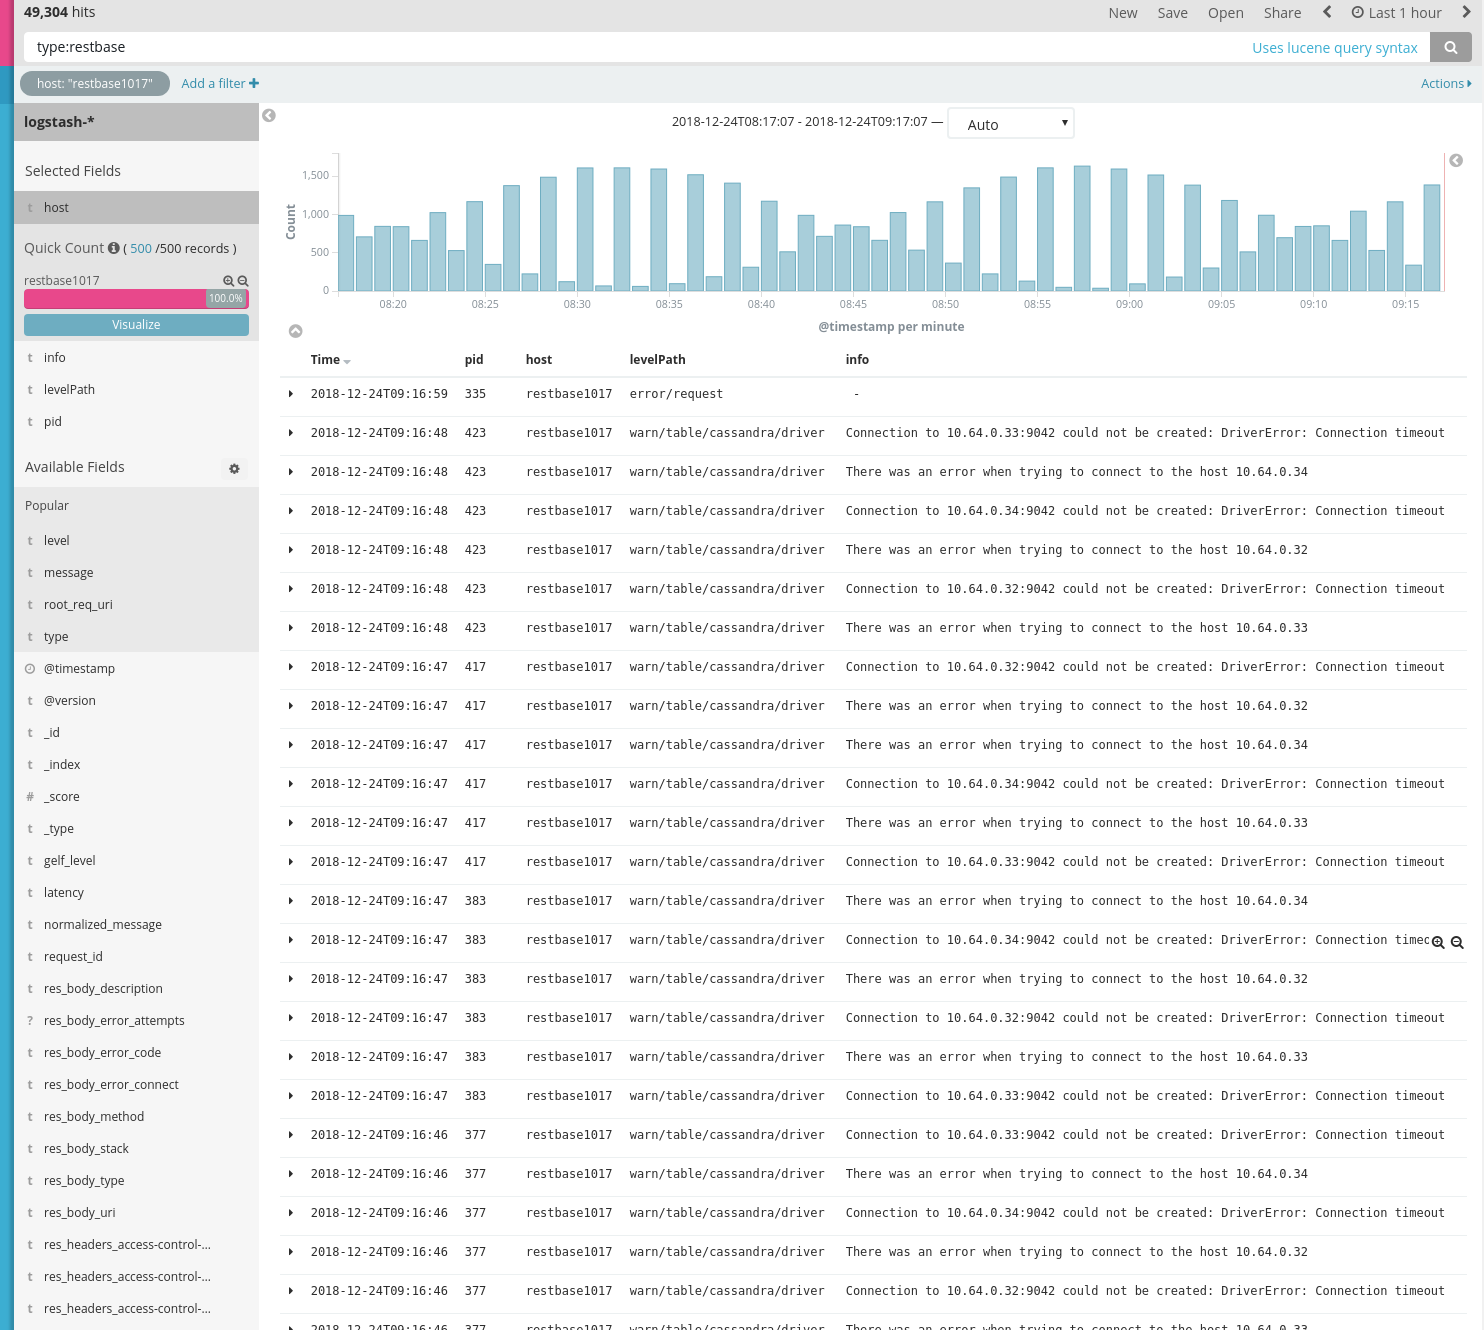
Agreed less workers will lessen the problem, though even per-worker logging (assuming different workers have different pid in logstash) seems a whole lot, I'm assuming because of retries (screenshot of https://logstash.wikimedia.org/goto/3e16e69f3c676481b0afa1b9eb40e6d2)
This is indeed a problem, causing issues also during deploys. I have had to increase the delay as well as the Scap deploy timeout because of the driver being too eager.
As far as I can tell, this is an actual issue in the driver, as it shouldn't be trying so hard to reach these instances when they are clearly marked as being down:
mobrovac@restbase1007 ~ $ nodetool-a status -r | grep restbase1016
DN  restbase1016-a.eqiad.wmnet  1.04 TiB   256          9.0%              dbb94fed-9456-4160-b3b9-40d494a84df0  a
DN  restbase1016-b.eqiad.wmnet  796.97 GiB  256          7.8%              b1b4945d-3ca2-4957-ac6a-5bab6ba0b22c  a
DN  restbase1016-c.eqiad.wmnet  888.07 GiB  256          8.0%              d891c6e2-9948-40c9-ad74-c47c5bdca497  a
We did see the driver trying to connect decommissioned nodes for quite a while after they have left the cluster during the previous round of decomissions/bootstraps. I guess right now it's trying to connect restbase1016 which was never properly decomissioned, but indeed the driver should not do that.
Perhaps increasing the reconnect timeout could be an improvement - we almost never see these errors in normal operation, only when cassandra dies or there's some decoms/bootstraps going on, so increased timeoput should not be an issue.
A bit of background regarding the current appearance:
As I understand, the driver does not recognize a node being marked as DOWN by Cassandra. I assume, 01-09 was when restbase1016 was force-removed from the cluster, but it was picked up by the driver only partially.
That is definitely the case. The last restbase1016 instance was removed on 2018-01-09:
[2019-01-09T13:32:04Z] <urandom> forcing removal of restbase1016-c (host down way too long to salvage)