Running until May 29. Chrome 68-74: https://github.com/WICG/event-timing
Description
Description
Details
Details
Customize query in gerrit
| Status | Subtype | Assigned | Task | ||
|---|---|---|---|---|---|
| Resolved | • Gilles | T216595 Add Origin Trial support to MediaWiki | |||
| Resolved | • Gilles | T216597 Event Timing origin trial |
Event Timeline
Comment Actions
Change 493065 had a related patch set uploaded (by Gilles; owner: Gilles):
[mediawiki/extensions/NavigationTiming@master] Event timing support
Comment Actions
Change 499709 had a related patch set uploaded (by Gilles; owner: Gilles):
[mediawiki/vagrant@master] Enable various origin trials
Comment Actions
Change 499710 had a related patch set uploaded (by Gilles; owner: Gilles):
[mediawiki/vagrant@master] Update origin trials tokens
Comment Actions
Change 499709 merged by jenkins-bot:
[mediawiki/vagrant@master] Enable various origin trials
Comment Actions
Change 499710 merged by jenkins-bot:
[mediawiki/vagrant@master] Update origin trials tokens
Comment Actions
Change 504501 had a related patch set uploaded (by Gilles; owner: Gilles):
[operations/mediawiki-config@master] Enable Event Timing origin trial on ruwiki and eswiki
Comment Actions
Change 493065 merged by jenkins-bot:
[mediawiki/extensions/NavigationTiming@master] Event timing support
Comment Actions
Change 504504 had a related patch set uploaded (by Gilles; owner: Gilles):
[mediawiki/extensions/NavigationTiming@wmf/1.33.0-wmf.25] Event timing support
Comment Actions
Change 504501 merged by jenkins-bot:
[operations/mediawiki-config@master] Enable Event Timing origin trial on ruwiki and eswiki
Comment Actions
Mentioned in SAL (#wikimedia-operations) [2019-04-17T07:45:43Z] <gilles@deploy1001> Synchronized wmf-config/InitialiseSettings.php: T216597 Enable Event Timing origin trial on ruwiki and eswiki (duration: 01m 04s)
Comment Actions
Change 504504 merged by Gilles:
[mediawiki/extensions/NavigationTiming@wmf/1.33.0-wmf.25] Event timing support
Comment Actions
Mentioned in SAL (#wikimedia-operations) [2019-04-17T07:51:57Z] <gilles@deploy1001> Synchronized php-1.33.0-wmf.25/extensions/NavigationTiming: T216597 Event timing support (duration: 01m 01s)
Comment Actions
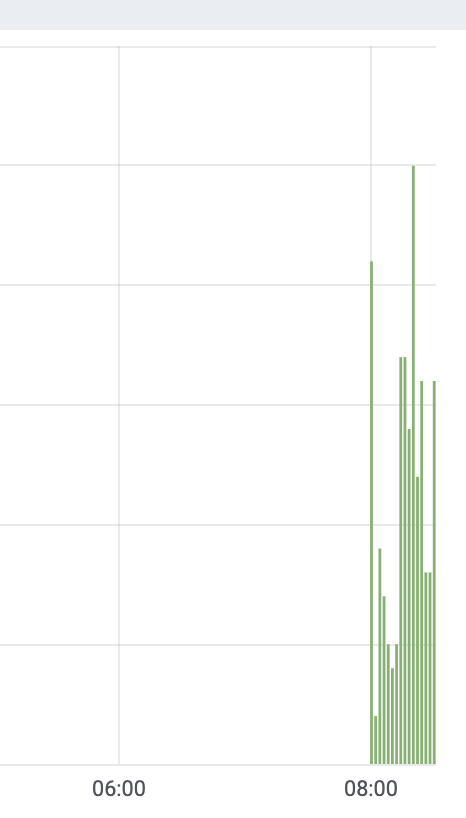
Data is coming in, as expected: https://grafana.wikimedia.org/d/000000018/eventlogging-schema?orgId=1&var-schema=EventTiming
Comment Actions
Change 504525 had a related patch set uploaded (by Gilles; owner: Gilles):
[mediawiki/extensions/NavigationTiming@wmf/1.34.0-wmf.1] Event timing support
Comment Actions
Change 504525 merged by jenkins-bot:
[mediawiki/extensions/NavigationTiming@wmf/1.34.0-wmf.1] Event timing support
Comment Actions
This seems to be happening a bunch, we already have a ton of data:
SELECT event.name, PERCENTILE(event.duration, 0.5) AS median_duration, COUNT(*) AS count FROM event.eventtiming WHERE year = 2019 GROUP BY event.name ORDER BY count DESC LIMIT 100;
| name | median_duration | count |
| mousemove | 80.0 | 832 |
| mouseover | 80.0 | 707 |
| touchend | 88.0 | 576 |
| mouseout | 72.0 | 512 |
| click | 88.0 | 457 |
| mouseup | 80.0 | 371 |
| mousedown | 80.0 | 307 |
| touchstart | 112.0 | 297 |
| touchmove | 88.0 | 183 |
| pointermove | 76.0 | 134 |
| keydown | 72.0 | 81 |
| keyup | 64.0 | 52 |
| pointerout | 72.0 | 43 |
| pointerover | 88.0 | 36 |
| lostpointercapture | 64.0 | 26 |
| keypress | 72.0 | 24 |
| pointercancel | 64.0 | 23 |
| contextmenu | 576.0 | 21 |
| pointerdown | 92.0 | 20 |
| beforeinput | 64.0 | 17 |
| gotpointercapture | 76.0 | 14 |
| input | 64.0 | 14 |
| auxclick | 64.0 | 11 |
| mouseenter | 80.0 | 10 |
| touchcancel | 544.0 | 7 |
| pointerup | 100.0 | 6 |
| compositionupdate | 56.0 | 5 |
| compositionstart | 56.0 | 2 |
| wheel | 72.0 | 1 |
Some scary ones like 'contextmenu' and 'touchcancel' we should try to find the source of.
Let's verify the sanity of our event collection. We tried to be quite conservative and disconnect the listener as soon as we've seen more than 10 events. But the first page received by the listener can contain more, particularly since the listener is only connected on load. All the events that happened before that get buffered and transmitted when the listener connects.
SELECT COUNT(*) AS count FROM event.eventtiming WHERE year = 2019 GROUP BY event.pageviewtoken ORDER BY count DESC LIMIT 10;
| count |
| 48 |
| 28 |
| 21 |
| 19 |
| 19 |
| 17 |
| 17 |
| 17 |
| 17 |
| 17 |
Let's look at the most awful one with 48 events...
SELECT event.cancelable, event.name, PERCENTILE(event.duration, 0.5) AS median_duration, COUNT(*) AS count FROM event.eventtiming WHERE year = 2019 AND event.pageviewtoken = '**redacted**' GROUP BY event.cancelable, event.name ORDER BY count DESC LIMIT 100;
It's coming from Chrome Mobile (browsing the desktop site) and most of the events are touch-related:
| cancelable | name | median_duration | count |
| false | touchmove | 416.0 | 31 |
| false | touchstart | 444.0 | 8 |
| false | touchend | 368.0 | 7 |
| true | keyup | 72.0 | 1 |
| true | keydown | 72.0 | 1 |
Let's look at the NavigationTiming data for that pageview. With a first paint of 1027 and a loadEventEnd of 1138, it doesn't look like a terribly slow pageload. The user is viewing the article, not editing it. Their effective connection type is 4G. It's got a CPU benchmark score of 381, which is pretty close to the median for mobile devices in Russia.
It seems like a ton of events to happen before onload, though. Let's see when they actually happened:
SELECT event.name, event.startTime, event.processingStart, event.processingEnd, event.duration FROM event.eventtiming WHERE year = 2019 AND event.pageviewtoken = '***redacted***' ORDER BY startTime LIMIT 50;

name	starttime	processingstart	processingend	duration
touchstart	4168	4202	4202	112
touchend	4168	4218	4218	112
touchmove	4168	4194	4195	112
touchend	4168	4188	4188	112
touchmove	4313	4333	4333	72
touchmove	4313	4332	4333	72
keydown	4314	4333	4333	72
keyup	4314	4344	4351	72
touchmove	4330	4342	4342	56
touchmove	4330	4343	4344	56
touchmove	4399	4414	4414	632
touchmove	4399	4414	4414	632
touchend	4399	4415	4415	632
touchstart	4424	4433	4433	608
touchmove	4424	4431	4431	608
touchmove	4475	4485	4486	552
touchmove	4475	4485	4485	552
touchmove	4493	4505	4505	536
touchstart	4493	4511	4511	536
touchstart	4493	4509	4509	536
touchmove	4493	4505	4506	536
touchmove	4504	4518	4518	528
touchmove	4504	4519	4519	528
touchmove	4504	4519	4519	528
touchend	4510	4537	4537	520
touchmove	4510	4527	4527	520
touchend	4510	4534	4534	520
touchmove	4510	4527	4527	520
touchmove	4510	4527	4527	520
touchmove	4561	4571	4571	472
touchmove	4561	4571	4571	472
touchstart	4561	4573	4573	472
touchmove	4612	4621	4621	416
touchstart	4612	4624	4624	416
touchmove	4630	4646	4646	400
touchend	4663	4679	4679	368
touchmove	4758	4764	4764	272
touchmove	4758	4764	4764	272
touchmove	4800	4806	4806	232
touchstart	4800	4810	4810	232
touchmove	4800	4806	4807	232
touchmove	4809	4815	4815	224
touchend	4852	4864	4864	176
touchmove	4868	4874	4874	160
touchmove	4936	4943	4943	96
touchmove	4936	4943	4943	96
touchstart	4936	4946	4946	96
touchmove	4946	4952	4952	88
They all happened after onload, over a period of 800ms. Odd that our collection limit isn't kicking in under those conditions.
The article that this person visited is https://ru.wikipedia.org/wiki/Слепаков,_Семён_Сергеевич The only thing that stands out in that article to me is the audio player.
What I find striking is that the event handlers are really fast but the events can be very long. Is this an indication that the slowdown isn't our fault? Or that some other undetermined thing than those events was blocking rendering?
Comment Actions
Actually it looks like I picked a very rare case, since there's only one other instance of slow touchmove on ruwiki, the rest is on eswiki.
The other instance is a pageview of https://ru.wikipedia.org/wiki/Великобритания which also has the audio player. Could be a coincidence, though, with only 2 samples we can't draw conclusions.
Comment Actions
While digging through the data, I noticed that the CPU benchmark is still only running for some of the navtiming samples. I think it would be useful data to have available for Event Timing, therefore I think it should be measured for every navtiming sample on eswiki and ruwiki. However before I do that, let's check if slow events are more common when the CPU benchmark is happening currently, which could be a sign that the benchmark itself might slow down events (it shouldn't since it's on a separate thread, but you never know...).
SELECT COUNT(*) FROM event.cpubenchmark WHERE year = 2019 AND event.pageviewToken IN (SELECT DISTINCT event.pageviewToken FROM event.navigationtiming WHERE year = 2019 AND month = 4 AND wiki = 'ruwiki' LIMIT 1000) AND event.pageviewToken != '00000000000000000000';


925


SELECT COUNT(*) FROM event.cpubenchmark WHERE year = 2019 AND event.pageviewToken IN (SELECT DISTINCT event.pageviewToken FROM event.eventtiming WHERE year = 2019 AND month = 4 AND wiki = 'ruwiki' LIMIT 1000) AND event.pageviewToken != '00000000000000000000';

911
All good, I'm going to make the CPU benchmark run for all navtiming samples on ruwiki and eswiki.
Comment Actions
Change 504841 had a related patch set uploaded (by Gilles; owner: Gilles):
[operations/mediawiki-config@master] Run CPU benchmark for all samples on eswiki/ruwiki
Comment Actions
Change 504841 merged by jenkins-bot:
[operations/mediawiki-config@master] Run CPU benchmark for all samples on eswiki/ruwiki
Comment Actions
Mentioned in SAL (#wikimedia-operations) [2019-04-18T09:41:10Z] <gilles@deploy1001> Synchronized wmf-config/InitialiseSettings.php: T216597 Run CPU benchmark for all samples on eswiki/ruwiki (duration: 01m 06s)
Comment Actions
The more I look at the breakdown, the more it seems like a lot of it could be whatever the user was doing at the time. The most common thing they would be doing on a desktop would be to move their mouse, hence the prominence of mousemove/mouseover. Likewise on mobile, it's all the different touch actions as people are dragging around the page.
Let's look at the page load with the most mousemove slow events:
name	starttime	processingstart	processingend	duration
mousemove	2671	2690	2690	56
mousemove	2885	3013	3013	128
mousemove	3962	4095	4095	136
mousemove	32369	32373	32373	56
mousemove	33874	33904	33904	56
mousemove	35097	35107	35107	56
mousemove	41837	41841	41841	56
mousemove	42721	42733	42733	56
mousemove	45294	45306	45306	56
mousemove	50393	50400	50400	56
mousemove	52781	52786	52786	64
This appears to happen mostly way after the page is fully loaded. First Paint was 1753 and loadEventEnd 1811 for that page load. No CPU benchmark was recorded. The user was editing the page. veaction is null, which suggests that it was a legacy editor edit.
Let's see how common it is for the mousemove slowdowns to be coming from action=edit:
action	veaction	count
NULL	NULL	225
delete	NULL	1
edit	NULL	95
history	NULL	9
info	NULL	1
submit	NULL	14
view	NULL	11042
view	edit	12
view	editsource	1
Actually not very common as whole. But how common when we get a bunch of slow events (top page views getting the most mousemove events)?
action	veaction	count
edit	NULL	4
view	NULL	40
view	edit	1
Not very common either, it was probably random that the top one was.
This would suggest that we're dealing with background noise again where the user was doing what they usually do and some random slowdown happened, unrelated to their action.
Comment Actions
Now let's look at events where there is a slow event handler involved. Does the breakdown of event types change?
SELECT event.name, COUNT(*) AS count FROM event.eventtiming WHERE year = 2019 AND event.processingend - event.processingstart > 50 GROUP BY event.name;

name	count
click	4464
contextmenu	29
input	12
keydown	19
keypress	13
keyup	1
mousedown	14
mouseenter	2
mouseout	19
mouseover	37
mouseup	10
touchend	6
touchstart	10
Now we're talking! This is looking like the ones we're really interested in. Let's check what the worst offenders on clicks are:
SELECT event.name, event.startTime, event.processingStart, event.processingEnd, event.duration FROM event.eventtiming WHERE year = 2019 AND event.name = 'click' AND event.processingend - event.processingstart > 50 ORDER BY processingend - processingstart DESC LIMIT 10;

name	starttime	processingstart	processingend	processing_duration	duration	pageviewtoken
click	103652	103653	117191	13538	13552
click	41334	41334	46231	4897	4904
click	47814	47814	51574	3760	3768
click	237170	237957	240371	2414	4160
click	38510	38510	40327	1817	1824
click	61007	61008	62806	1798	1816
click	11132	11141	12710	1569	1648
click	10473	10508	12023	1515	1760
click	67094	77915	79374	1459	7560
click	11020	11035	12443	1408	1632
Let's look at the details of the pageview with the worst offender (13 seconds!). Here are all the slow events for that particular pageview:
name	starttime	processingstart	processingend	duration
mousemove	43251	43266	43266	80
keydown	82963	82982	82985	64
click	103652	103653	117191	13552
mouseup	103652	103653	103653	13552
The previous ones look like they might have been just background activity. Looking at navtiming data, the action is "submit" (so... previewing changes/editing?). The CPU score is 201 which is pretty normal. The effective connection type is 4g. I'm not going to link to the article at hand, because it's pretty much only every been edited by the same user (looks like someone updating their own bio, TBH...). The article is nothing special, a short biography and a list of books that person has written.
The fact that it's on the submit page suggests that maybe this could be when the person actually submitted the change and the edit processing happened to be slow that one time?
Let's see what the action/veaction breakdown is like when we only look at slow event handlers:
SELECT event.action, event.veaction, COUNT(*) AS count FROM event.navigationtiming WHERE year = 2019 AND event.pageviewtoken IN (SELECT DISTINCT event.pageviewtoken FROM event.eventtiming WHERE year = 2019 AND event.processingend - event.processingstart > 50) GROUP BY event.action, event.veaction;

action	veaction	count
NULL	NULL	18
edit	NULL	15
history	NULL	1
submit	NULL	7
view	NULL	4008
view	edit	5
And like before, let's look at the breakdown when only considering the 50 slowest events:
action	veaction	count
NULL	NULL	1
edit	NULL	2
view	NULL	38
submit	NULL	1
Again, it seems like it was a rare occurrence that we captured as the worst offender. It's almost surprising how little editing is represented, but maybe it's simply because we don't capture a lot of edits in navtiming in general, given the sampling.
Let's find the worst offending view and look at what's happening for it.
name	starttime	processingstart	processingend	processing_duration	duration
click	195421	195552	195706	154	392
click	237170	237957	240371	2414	4160
In that case the effective connection type is slow-2g, interesting... Someone in Chile. First Paint is at 2278, loadEventEnd is 88035 (!). Their CPU benchmark is indicative of a slow device: 647. The article looks like a very plain one: https://es.wikipedia.org/wiki/Bandera_de_Paraguay What the hell did they click on after looking at this page for more than 2 minutes...?
I think this is where we're seeing the limit of this API. Without recording some additional information, potentially recording all the elements users click on, there's no way to know what they were doing on the page at the time the slow event happened.
With click events being the most common kind of actual slow event, we could consider recording clicked elements (up to a point) when the user is in the navtiming sample, using an observer.
Comment Actions
Change 505648 had a related patch set uploaded (by Gilles; owner: Gilles):
[mediawiki/extensions/NavigationTiming@master] Record click timings
Comment Actions
Change 505648 merged by Gilles:
[mediawiki/extensions/NavigationTiming@master] Record click timings
Comment Actions
Change 509630 had a related patch set uploaded (by Gilles; owner: Gilles):
[mediawiki/vagrant@master] Renew origin trial tokens
Comment Actions
Change 509630 merged by jenkins-bot:
[mediawiki/vagrant@master] Renew origin trial tokens
Comment Actions
Seems to be coming a lot from expanding sections on the mobile site. We need to check how often it's slow, now that we also capture when people click on it at all.
Comment Actions
Filed a task about the most common offender on long click event processing: T225946: [SPIKE 8hrs] Determine remedy for MobileFrontend lazy-loading images performance issues
Comment Actions
The next "big" offenders (many order of magnitude smaller than the previous one, which has 976,911 occurrences to date) in terms of slow click handlers are:
div.mw-ui-icon.mw-ui-icon-mf-arrow.mw-ui-icon-element...indicator with 52497 occurrences
This is another instance of the section expansion, this time for people who click on the arrow to expand a section.
"mf-section-0" with 16371 occurrences
Examples:
html.client-js.mf-font-size-null.issues-group-B body.mediawiki.ltr.sitedir-ltr.mw-hide-empty-elt.ns-0.ns-subject.mw-editable.page-El_conjuro_serie_de_películas.rootpage-El_conjuro_serie_de_películas.stable.issues-group-B.skin-minerva.action-view.minerva--amc-disabled.animations.touch-events div#mw-mf-viewport div#mw-mf-page-center main#content.mw-body div#bodyContent.content div#mw-content-text.mw-content-ltr div.mw-parser-output div#mf-section-0.mf-section-0 p
html.client-js.mf-font-size-null.issues-group-B body.mediawiki.ltr.sitedir-ltr.mw-hide-empty-elt.ns-0.ns-subject.mw-editable.page-MercadoLibre.rootpage-MercadoLibre.stable.issues-group-B.skin-minerva.action-view.minerva--amc-disabled.animations.touch-events div#mw-mf-viewport div#mw-mf-page-center main#content.mw-body div#bodyContent.content div#mw-content-text.mw-content-ltr div.mw-parser-output div#mf-section-0.mf-section-0 p
html.client-js.mf-font-size-null.issues-group-B body.mediawiki.ltr.sitedir-ltr.mw-hide-empty-elt.ns-0.ns-subject.mw-editable.page-Pablo_Picasso.rootpage-Pablo_Picasso.stable.issues-group-B.skin-minerva.action-view.minerva--amc-disabled.animations.touch-events div#mw-mf-viewport div#mw-mf-page-center main#content.mw-body div#bodyContent.content div#mw-content-text.mw-content-ltr div.mw-parser-output div#mf-section-0.mf-section-0 table.infobox.biography.vcard tbody tr td sup#cite_ref-CatRez_1-0.reference.separada a span.corchete-llamada
html.client-js.mf-font-size-null.issues-group-B body.mediawiki.ltr.sitedir-ltr.mw-hide-empty-elt.ns-0.ns-subject.mw-editable.page-Osmán_I.rootpage-Osmán_I.stable.issues-group-B.skin-minerva.action-view.minerva--amc-disabled.animations.touch-events div#mw-mf-viewport div#mw-mf-page-center main#content.mw-body div#bodyContent.content div#mw-content-text.mw-content-ltr div.mw-parser-output div#mf-section-0.mf-section-0 table.infobox.biography.vcard tbody tr td a.image img
These are actually various things. It's probably just more frequent for people to press and click on things above the fold, which is why mf-section-0 is so prominent.
In the examples above, we find clicks on citations, which bring up a hover citation display on Mobile Frontend, and clicking on an image, which brings up the MF lightbox. I don't find anything particularly wrong with the lightbox, looking at what it does in its click event handler. Could be just general slowness.
As for the reference lightbox display, it's causing a layout and style recalc, which explains why it shows up here. Filed a task about it: T226025: Expensive viewport size access in Reference Drawers
div.mw-mmv-wrapper div.mw-mmv-main.metadata-panel-is-closed div.mw-mmv-pre-image button.mw-mmv-close with 2279 occurences
This is the arrow to close Media Viewer. Filed a task about it: T226023: Media Viewer detach/shutdown can be expensive
div.mw-ui-icon.mw-ui-icon-mf-arrow.mw-ui-icon-element..mf-mw-ui-icon-rotate-flip.indicator with 1887 occurrences
This is another instance of the section expansion, this time for people who click on the arrow to collapse a section.
"toctext" with 1142 occurrences
Example: html.client-js.ve-available body.mediawiki.ltr.sitedir-ltr.mw-hide-empty-elt.ns-0.ns-subject.mw-editable.page-Казачество_на_Украине.rootpage-Казачество_на_Украине.skin-vector.action-view div#content.mw-body div#bodyContent.mw-body-content div#mw-content-text.mw-content-ltr div.mw-parser-output div#toc.toc ul li.toclevel-1.tocsection-9 a span.toctext
This is merely when clicking on a link in the table of contents. I'm surprised that there's an event handler there. After investigating, it seems to be some jQuery polyfill/fix for the "focusin" event. However, based on the comment in the jQuery, Chrome shouldn't need it... It's mostly anonymous users as well, so probably not a gadget or user script.
Comment Actions
Now, I think I've got the most common slow events covered. There is a long tail and always more to fix, of course.
As for events that have a long processing queue, there are most likely caused by long tasks, which aren't actionable at the moment due to lack of attribution.
The Event Timing API seems very useful and is letting us find real actionable performance problems. As for my main feedback about its lack of attribution (which forced me to implement the ClickTiming workaround), it's been clearly voiced already. I don't think there's anything more for us to get out of the origin trial at this stage.