Profile Information
Name: Aditya Jain
IRC nickname on Freenode: AdityaJ
Gmail ID: adi2007jain@gmail.com
GitHub profile: https://github.com/Jain-Aditya
Location: India
Typical working hours: Between 11 am and 6 pm UTC +5:30 (Will give more time if required)
Synopsis
Short summary describing your project and how it will benefit Wikimedia projects
As we all know, Wikimedia provides the essential infrastructure for free knowledge. There are various Wikimedia projects that are edited by volunteers around the world. Hashtag Search is a tool that allows users to search for uses of hashtags used in Wikimedia edit summaries. As of now, the functionalities of the tool are quite basic - Few simple search options are provided and the results are listed with the option to download them as CSV. Many Wikimedia campaigns uses this tool to track edits and the users might want to get into more details for a particular search.
This project ‘Create a Subpage for statistics and charts related to a hashtag search’ aims at creating a page which would display more detailed statistics, charts and graphs for a given search. Users can also optionally download the detailed data as CSV.
Possible Mentor(s)
Have you contacted your mentors already?
Yes
Deliverables
After the completion of Internship, the tool will have the following additional features:
- There will be an option beside the download link which will lead us to the statistics page.
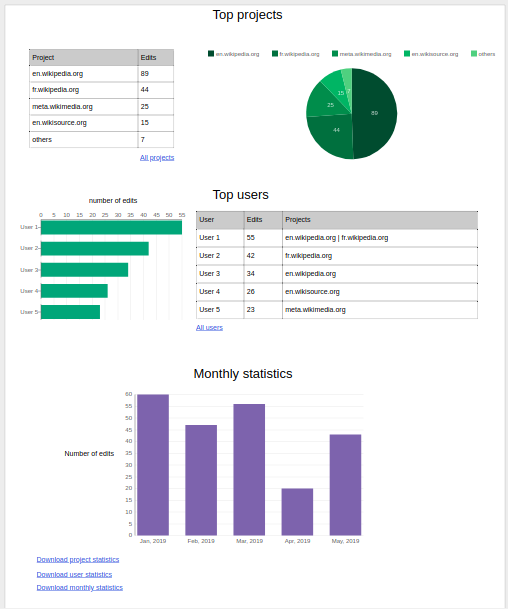
- The statistics page will have tables with their respective charts and graphs. The first table will display the wikimedia projects which are present in the search results and the number of edits belonging to that project sorted by decreasing order of their number of edits.
- The second table will display top 10 users who have used those hashtags in the edit summary sorted by decreasing order of their number of edits. (we will also display the wikimedia projects they have contributed to)
- There will be a bar graph for time vs number of edits.
- There will be an option to download each of these statistics as CSV.
- Also there will be test coverage for all the new APIs.
If time permits, following features will be added :
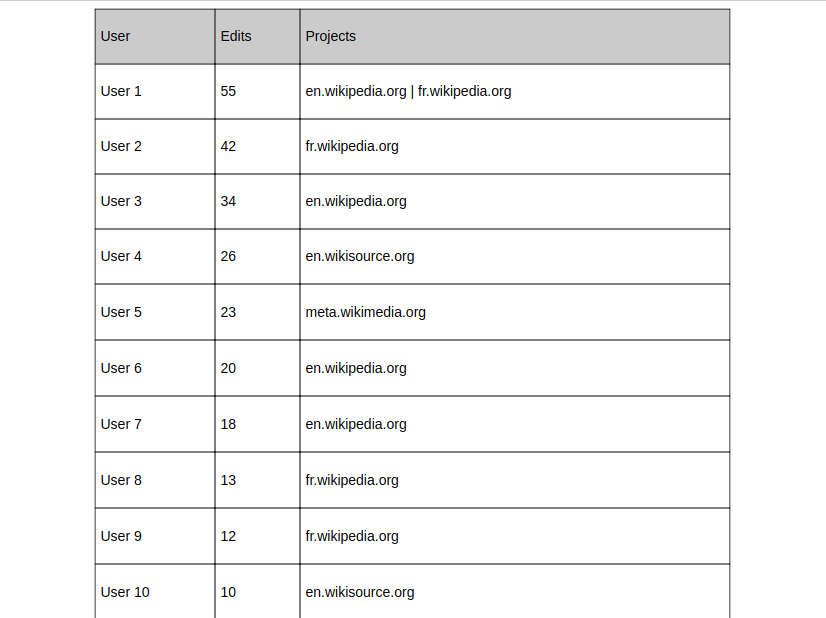
- As some users of the tool might be interested in full list of users, a link will be provided which will lead to a page displaying statistics of all the users.
- Similar thing will be done for displaying statistics of all the projects.
UI Mockups
The complete list of users would look like:
Implementation details
For rendering charts, I am planning to use a JavaScript library (Probably Chart JS). I will be exploring libraries in the community bonding period. I’ll go with the one whichever is more active in terms of development and is well documented.
There will be a separate option "Show Statistics" on the home page (which will be displayed only after some hashtag is searched for and results are displayed) which will lead us to the statistics page. The following APIs will be created to get the data and render graphs for this page:
- fetch number of edits per user sorted in decreasing order (along with the projects they have contributed to)
- fetch number of edits per project sorted in decreasing order.
- fetch number of edits for each month in the given time interval.
All of the above APIs will be paginated (default page no will be 1) and will return results according to the current search criteria. When the link is clicked, user will be redirected to a new page where graphs and tables will be rendered.
For downloading these statistics as CSV, there will be separate wrapper API endpoints which will internally make use of the above APIs to fetch data of all the pages and create a csv out of it.
Timelines
May 7 - May 14
- Community bonding period
- Study the current functionalities of the tool in detail
- Explore JavaScript libraries and finalize which one to use
- Discuss about the design and refine mockups
May 15 - May 22
- Though this is also a part of community bonding period, I’ll start working on APIs.
- Identify how JsonResponse of the APIs should be. (We will need this info when rendering charts and tables)
- Implementing the project statistics API
- Implementing the user statistics API
May 23 - June 7
- Implement an API for time vs number of edits bar graph.
- Implement “show statistics” option on the main page and integrate it with statistics page.
- Design a template for the statistics page. It will include the tags where to render the charts in the page.
June 8 - June 22
- Write Ajax calls to render charts and tables. (This phase might require minor API modifications)
- Gather feedback from the users by announcing the features on mailing lists or other channels.
June 23 - July 7
- Write APIs for downloading statistics as CSV
- Integrate the download csv APIs with UI
July 8 - July 15
- Write test cases for the new APIs
July 16 - July 30
- I will utilize this time to implement any additional features (which are feasible within the given time) and filing them which are suggested by the users as the feedback.
August 1 - August 26
- Documentation and bug fixes
Participation
- I will be submitting PRs on the already existing codebase https://github.com/Samwalton9/hashtags
- I have been and will be in constant touch with my mentor, Sam Walton.
- For sharing status and discussing ideas, I will be using phabricator. I will be active on IRC and gmail during my working hours.
- I will be writing blog for sharing my experience and progress on this project. I plan to do it after every evaluation.
About Me
Your education
I am a third year Computer Science undergraduate student at Bundelkhand Institute of Engineering and Technology, Jhansi (India).
How did you hear about this program?
I heard about this program in a campus session regarding open source development.
Will you have any other time commitments, such as school work, another job, planned vacation, etc, during the duration of the program?
I will be completely free till mid-July. After that my college will start but I will still be able to give 7-8 hours on weekends and 3-4 hours on weekdays as there wouldn’t be any exams during that period.
We advise all candidates eligible for Google Summer of Code and Outreachy to apply for both programs. Are you planning to apply to both programs and, if so, with what organization(s)?
I am only applying for Google Summer of Code with Wikimedia organization.
What does making this project happen mean to you?
I am passionate about problem solving and software development. I have been using Wikipedia since childhood and it always helped me in understanding complex things and has proven to be the best resources among others available on the Internet. What wikipedia today is just because of its community. Building this tool will definitely help Wikimedia community to grow more and this feeling motivates me more towards its development. Also, till now I haven’t worked on any project that would impact millions of people. This project gives me that opportunity and, at the same time, challenges me to learn and grow.
Past Experience
I have been learning Software Development and Algorithms since my freshman year and I am enjoying it so far. I have mostly worked on Python, Django, Flask, MySQL, Postgres, Javascript, Heroku.
Following are some of my personal projects:
- Discussion-Forum: A django application that uses MySQL database. It allows admin to create categories for which user may start any discussion. Also other users can post comments on that discussion. The link to the repo is: https://github.com/Jain-Aditya/DiscussionForum
- Book-Review app: A flask application that allows logged-in users to search for books by their author name or by ISBN number. I have used Postgres database for this application which is hosted on Heroku. This application fetches the book ratings and reviews from the API provided by goodreads. The link to the repo is: https://github.com/Jain-Aditya/Book-Review
Contributions to Wikimedia
I have been exploring Wikimedia projects since January 2018. So far I have explored and fixed some bugs of Pywikibot, Worklist tool, Library-Card-Platform and Hashtags.
- (Merged) T215034: Strip timezone information from CSV download. https://github.com/Samwalton9/hashtags/pull/5
- (Merged) T207367: Add a message if user attempts an unsupported search. https://github.com/Samwalton9/hashtags/pull/6
- (Merged) T216727: Display a notice if database appears to be significantly behind current time. https://github.com/Samwalton9/hashtags/pull/9
- (Merged) Hashtags: Add default to EXCLUDED. https://github.com/Samwalton9/hashtags/pull/7
- (Merged) T188737: In the list of "templates used on this page" when editing, highlight redirect templates by italicising them (like we do elsewhere). https://gerrit.wikimedia.org/r/#/c/mediawiki/core/+/416220/
- (Merged) T215246: Gracefully handle server errors on /applications/apply/<random_number> https://github.com/WikipediaLibrary/TWLight/pull/241
- (Merged) T215782: Server error when updating an Invalid application to another status https://github.com/WikipediaLibrary/TWLight/pull/243
- (Merged) T184115: Pywikibot: Add missing doc string params. https://gerrit.wikimedia.org/r/#/c/pywikibot/core/+/481332/
- (Merged) Pywikibot: Basestring is a description of parameter value's type. https://gerrit.wikimedia.org/r/#/c/pywikibot/core/+/481322/
- (Merged) Worklist tool: Can't create worklist from PetScan query ("PetScan articles could not be saved"). https://github.com/MeghaSharma21/WorklistTool-GSoC-2018/pull/47
- (Merged) Worklist tool: Added import statement "from django.conf.urls import url, include" in app/urls.py https://github.com/MeghaSharma21/WorklistTool-GSoC-2018/pull/45
- (Merged) Worklist tool: Added a constant https://github.com/MeghaSharma21/WorklistTool-GSoC-2018/pull/44
- (Under Review) T216398: Allow AND/OR searching for multiple hashtags. https://github.com/Samwalton9/hashtags/pull/25
- (Under Review) T206125: Consider re-addition of Google Drive integration. https://github.com/Samwalton9/hashtags/pull/28