Page MenuHomePhabricator

Disable/remove unused features on Tendril
Closed, DeclinedPublic

Assigned To
None
Authored By
Marostegui
Aug 26 2019, 9:19 AM
Referenced Files
F31810767: Captura de pantalla 2020-05-10 a las 9.13.28.png
May 10 2020, 7:31 AM
F31803099: host-overview (5).png
May 5 2020, 7:08 AM
F27612064: db1115_memory.png
Aug 26 2019, 9:19 AM
F30103245: host-overview (1).png
Aug 26 2019, 9:19 AM

Description

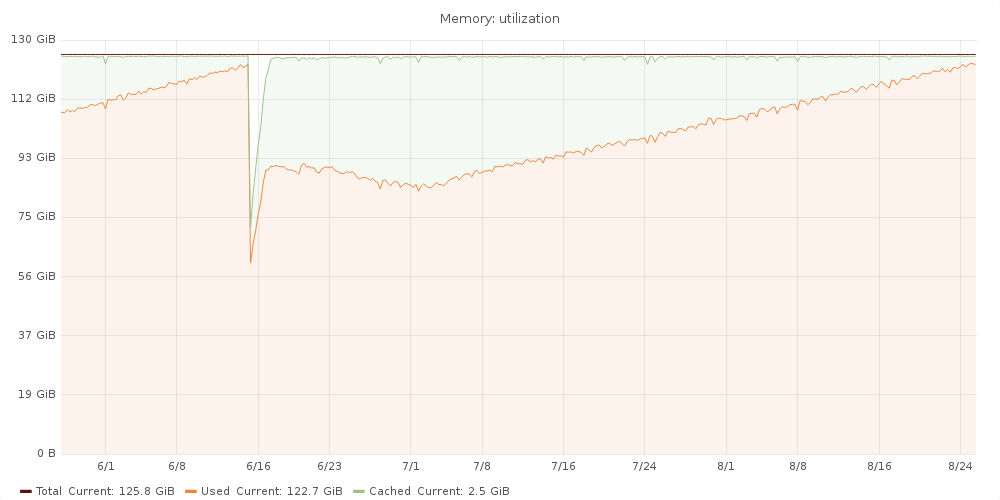
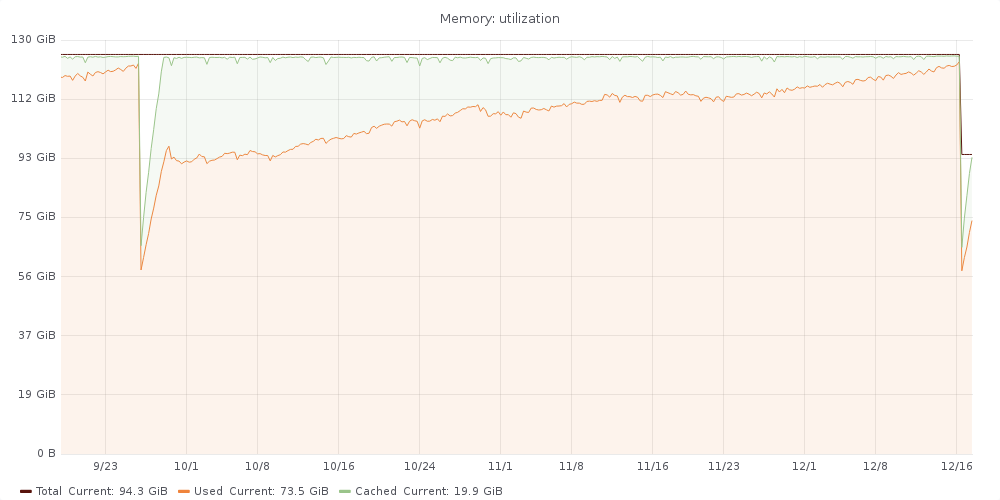
Tendril seems to be having an excessive amount of memory consumption that keeps growing over the time until it makes OOM to kick in and start killing some processes, typically MySQL or nagios, causing pages

Examples of some tasks:
T231165: db1115 (tendril) paged twice in 24h due to OOM
T196726: db1115 (tendril DB) had OOM for some processes and some hw (memory) issues

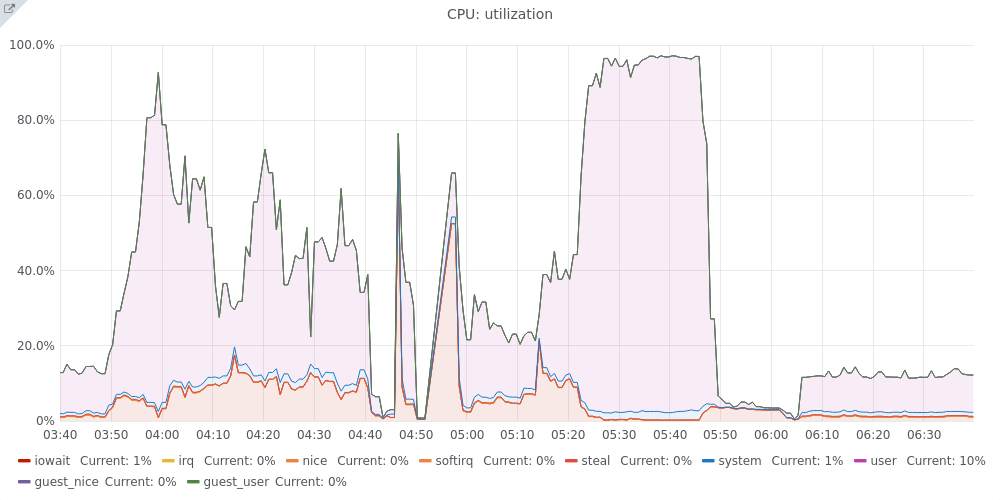
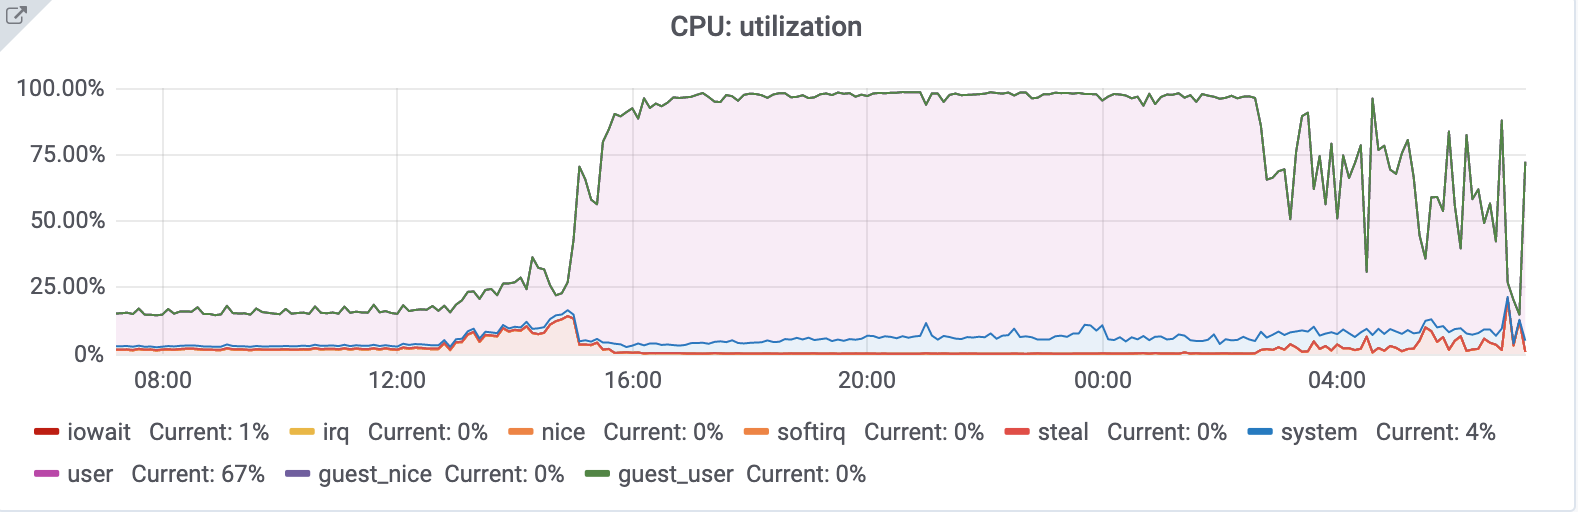
Some graphs that show this behavior:

host-overview (1).png (500×1 px, 37 KB)

db1115_memory.png (500×1 px, 40 KB)

MySQL pool size is already quite low:

innodb_buffer_pool_size        = 20G

Given that we don't really know at this point what can be causing that excessive and steady memory usage, let's disable/remove stuff that we don't currently use.
Tendril has lots of events, triggers, graphing and so forth, that we don't use anymore, and can probably be disabled without affecting anything on our current workflow.

Related Objects

Event Timeline

Change 594405 had a related patch set uploaded (by Marostegui; owner: Marostegui):
[operations/puppet@production] tendril.my.cnf: Enable tokudb for 10.1

https://gerrit.wikimedia.org/r/594405

Change 594405 merged by Marostegui:
[operations/puppet@production] tendril.my.cnf: Enable tokudb for 10.1

https://gerrit.wikimedia.org/r/594405

We had an issue with tendril today where tendril was very slow and almost unresponsive, at first I thought it was another case of T231769: Investigate possible memory leak on db1115, but it wasn't.
First of all we realized that after restarting mysql we got some errors with TokuDB not being loaded:

daemon.log:May  5 05:00:00 db1115 mysqld[1029]: 2020-05-05  5:00:00 140204559673088 [ERROR] Event Scheduler: [root@208.80.154.151][tendril.tendril_global_status_log_5m] Unknown storage engine 'TokuDB'

That resulted on a tables failing. This was due to a mistake on https://gerrit.wikimedia.org/r/#/c/operations/puppet/+/585115/3/modules/profile/templates/mariadb/mysqld_config/tendril.my.cnf.erb which as been fixed with: https://gerrit.wikimedia.org/r/#/c/operations/puppet/+/594405/

However, after manually enabling TokuDB we also saw that the host was super loaded as soon as MySQL was started, and the CPU was over the roof:

05:31:43 up 36 min,  3 users,  load average: 64.56, 57.27, 36.13

host-overview (5).png (500×1 px, 86 KB)

The host was full of connections that were piling up, but one of them was taking ages to complete:

| 240574 | root     | 10.64.32.25       | tendril            | Connect |  852 | Copying to tmp table | insert into processlist_query_log
        (server_id, stamp, id, user, host, db, time, info)
        select p.server_id, now(), p.id, p.user, p.host, p.db, p.time, p.info
        from processlist p
        left join processlist_query_log q
          on q.server_id = @server_id
          and p.id = q.id
          and p.user = q.user
          and p.host = q.host
          and p.db = q.db
          and p.info = q.info
          and p.time > q.time
          and q.stamp > now() - interval 7 day
        where
          p.server_id = @server_id
          and p.command = 'Query'
          and q.server_id is null

That was the only query that would remain running after stopping the event scheduler.
One of the involved tables is: processlist_query_log which is a huge table:

1-rw-rw---- 1 mysql mysql 5.2K May 5 04:57 processlist_query_log.frm
2-rw-rw---- 1 mysql mysql 424 May 5 00:00 processlist_query_log.par
3-rw-rw---- 1 mysql mysql 2.9G Apr 7 01:34 processlist_query_log#P#p737886.ibd
4-rw-rw---- 1 mysql mysql 3.8G Apr 8 01:32 processlist_query_log#P#p737887.ibd
5-rw-rw---- 1 mysql mysql 3.0G Apr 9 00:03 processlist_query_log#P#p737888.ibd
6-rw-rw---- 1 mysql mysql 3.0G Apr 10 02:15 processlist_query_log#P#p737889.ibd
7-rw-rw---- 1 mysql mysql 3.0G Apr 11 02:42 processlist_query_log#P#p737890.ibd
8-rw-rw---- 1 mysql mysql 2.8G Apr 12 02:43 processlist_query_log#P#p737891.ibd
9-rw-rw---- 1 mysql mysql 2.7G Apr 13 03:11 processlist_query_log#P#p737892.ibd
10-rw-rw---- 1 mysql mysql 3.3G Apr 14 02:21 processlist_query_log#P#p737893.ibd
11-rw-rw---- 1 mysql mysql 3.2G Apr 15 03:15 processlist_query_log#P#p737894.ibd
12-rw-rw---- 1 mysql mysql 2.8G Apr 16 03:08 processlist_query_log#P#p737895.ibd
13-rw-rw---- 1 mysql mysql 3.1G Apr 17 03:21 processlist_query_log#P#p737896.ibd
14-rw-rw---- 1 mysql mysql 2.7G Apr 18 03:22 processlist_query_log#P#p737897.ibd
15-rw-rw---- 1 mysql mysql 3.9G Apr 19 03:23 processlist_query_log#P#p737898.ibd
16-rw-rw---- 1 mysql mysql 3.2G Apr 20 03:25 processlist_query_log#P#p737899.ibd
17-rw-rw---- 1 mysql mysql 3.2G Apr 21 06:07 processlist_query_log#P#p737900.ibd
18-rw-rw---- 1 mysql mysql 3.2G Apr 22 03:52 processlist_query_log#P#p737901.ibd
19-rw-rw---- 1 mysql mysql 2.9G Apr 23 03:42 processlist_query_log#P#p737902.ibd
20-rw-rw---- 1 mysql mysql 2.9G Apr 24 03:42 processlist_query_log#P#p737903.ibd
21-rw-rw---- 1 mysql mysql 3.0G Apr 25 03:44 processlist_query_log#P#p737904.ibd
22-rw-rw---- 1 mysql mysql 3.1G Apr 26 03:45 processlist_query_log#P#p737905.ibd
23-rw-rw---- 1 mysql mysql 2.8G Apr 27 03:48 processlist_query_log#P#p737906.ibd
24-rw-rw---- 1 mysql mysql 3.3G Apr 28 00:19 processlist_query_log#P#p737907.ibd
25-rw-rw---- 1 mysql mysql 3.3G Apr 29 00:59 processlist_query_log#P#p737908.ibd
26-rw-rw---- 1 mysql mysql 3.2G Apr 30 00:57 processlist_query_log#P#p737909.ibd
27-rw-rw---- 1 mysql mysql 3.3G May 1 00:54 processlist_query_log#P#p737910.ibd
28-rw-rw---- 1 mysql mysql 11G May 2 00:58 processlist_query_log#P#p737911.ibd
29-rw-rw---- 1 mysql mysql 16G May 3 00:56 processlist_query_log#P#p737912.ibd
30-rw-rw---- 1 mysql mysql 15G May 4 00:56 processlist_query_log#P#p737913.ibd
31-rw-rw---- 1 mysql mysql 14G May 5 01:00 processlist_query_log#P#p737914.ibd
32-rw-rw---- 1 mysql mysql 2.5G May 5 05:55 processlist_query_log#P#p737915.ibd
33-rw-rw---- 1 mysql mysql 160K May 5 00:03 processlist_query_log#P#p737916.ibd

According to the ibd creation dates, it looks like the partitions are purged every month, but for some reason they had lots of rows lately.
For instance:

-rw-rw---- 1 mysql mysql  11G May  2 00:58 processlist_query_log#P#p737911.ibd

-rw-rw---- 1 mysql mysql  16G May  3 00:56 processlist_query_log#P#p737912.ibd

-rw-rw---- 1 mysql mysql  15G May  4 00:56 processlist_query_log#P#p737913.ibd

That's lots of rows for just 24h.

The subquery involving a left join on that huge table was likely going to take hours, creating those CPU usages.
After truncating the table, everything went back to normal, as that query is now able to finish quickly as the table decreased its size.

For some reason, seeing the file sizes, something has made the partitions to increase almost 5 times since 1st May. Normally it used to be around 3GB or 4GB per day, but since 1st May they are bigger than 10GB. That needs some investigation too.

Mentioned in SAL (#wikimedia-operations) [2020-05-10T07:11:12Z] <marostegui> Truncate tendril. processlist_query_log T231185

Mentioned in SAL (#wikimedia-operations) [2020-05-10T07:11:23Z] <marostegui> Restart mysql on db1115 T231185

This has happened again:

root@cumin1001:~# mysql.py -hdb1115 -e "show processlist" | grep Copy
35178632	root	10.64.32.25	tendril	Connect	15049	Copying to tmp table	insert into processlist_query_log \n        (server_id, stamp, id, user, host, db, time, info)\n       	0.000
35964338	root	10.64.32.13	tendril	Connect	5533	Copying to tmp table	insert into processlist_query_log\n        (server_id, stamp, id, user, host, db, time, info)\n       	0.000
36340984	root	10.64.32.13	tendril	Connect	1032	Copying to tmp table	insert into processlist_query_log\n        (server_id, stamp, id, user, host, db, time, info)\n       	0.000
36421610	root	10.64.32.25	tendril	Connect	10	Copying to tmp table	insert into processlist_query_log\n        (server_id, stamp, id, user, host, db, time, info)\n       	0.000
36423267	root	10.64.32.25	tendril	Connect	2	Copying to tmp table	insert into processlist_query_log\n        (server_id, stamp, id, user, host, db, time, info)\n       	0.000
36429799	root	10.64.32.25	tendril	Connect	0	Copying to tmp table	insert into strings (string)\n                  select lower(concat( NAME_CONST('con_prefix',_latin1'	0.000

For some reason that processlist_query_log table is getting lots more data and the select which is under that insert take ages to complete:

-rw-rw---- 1 mysql mysql  11G May  6 00:56 processlist_query_log#P#p737915.ibd
-rw-rw---- 1 mysql mysql  16G May  7 00:56 processlist_query_log#P#p737916.ibd
-rw-rw---- 1 mysql mysql  16G May  8 00:57 processlist_query_log#P#p737917.ibd
-rw-rw---- 1 mysql mysql  15G May  9 01:01 processlist_query_log#P#p737918.ibd
-rw-rw---- 1 mysql mysql 9.2G May 10 06:27 processlist_query_log#P#p737919.ibd
-rw-rw---- 1 mysql mysql  48M May 10 06:47 processlist_query_log#P#p737920.ibd

After truncating processlist_query_log again I stopped the event_scheduler to let all the threads stop, once it was fully clean, I started it but the spike was massive and the host stalled again.
Finally, I restarted MySQL.

CPU graph is scary with a sudden spike:

Captura de pantalla 2020-05-10 a las 9.13.28.png (512×1 px, 125 KB)

After restarting mysql the server went back to crazy values and had like 1200 connections again

I am still investigating

Mentioned in SAL (#wikimedia-operations) [2020-05-10T08:01:43Z] <marostegui> Disable unused events like %_schema T252324 T231185

All the events like es1020_eqiad_wmnet_3306_schema have been disabled across all the hosts as they were running every minute and we don't really use them.

This comment was removed by Marostegui.

Mentioned in SAL (#wikimedia-operations) [2020-11-17T08:43:42Z] <marostegui> Truncate tendril.global_status_log - T231185

Change 641932 had a related patch set uploaded (by Marostegui; owner: Marostegui):
[operations/software/tendril@master] tendril: Disable innodb_locks event.

https://gerrit.wikimedia.org/r/641932

Change 641932 merged by Marostegui:
[operations/software/tendril@master] tendril: Disable innodb_locks event.

https://gerrit.wikimedia.org/r/641932

I am going to close this as we'll not work on individual pieces for tendril, but rather we'll work to totally remove it and replace it with orchestrator and something else.

Tendril has been acting weirdly for quite a few hours. I have narrowed the issue to global_variables and general_log_sampled tables
This first table has never given any issues before. We don't use this table for anything, so I have truncated it (along with the other source of issues ones, the global_status_log*) as it was around 10G.
The host was struggling to do any operation with this global_variables table involved.

While investigating, I have also seen this:

-rw-rw---- 1 mysql mysql 798G Apr 22 12:53 general_log_sampled.ibd

I am seeing inserts happening on this table but taking such a long time:

|   887 | root            | 10.64.32.25          | tendril            | Connect     |  122 | Sending data                                                          | insert into general_log_sampled

This table probably needs truncation and might be the source of issues today but I don't want to do it on a day off and with not a very stable connection at the moment. So I will probably do it tomorrow morning.
The first entry on the table is from August 2020 anyways, I can try to delete stuff older than 2021 and then optimize, but not sure if it is worth the effort.

The table slave_status_log is also giving lots of issues, it is partitioned and it is huge. So I have truncated it too as there were plenty of connections trying to insert there.

I still don't know what's going on - tendril is down at the moment. I am running out of battery on my laptop

Tendril is back up, but very slow. I think we really need to truncate general_log_sampled

processlist_query_log, is holding lots of transactions. That table is partitioned and total size was around 50G. We obviously don't use that for anything, so I have truncated it.
The server is not yet at the level of response it was before, - I am running out of ideas.

I have set innodb_purge_threads = 3 to see if it helps reducing the purge lag the server started to increase since 2AM.
So far it is slowly recovering: https://grafana.wikimedia.org/d/000000273/mysql?viewPanel=11&orgId=1&var-server=db1115&var-port=9104&from=1619048989651&to=1619113649936

Waited for the innodb_list_length to be 0, and I have started the event_scheduler again...we'll see how it goes.

I think tendril is definitely back and operating normally.
It is hard to actually describe what was the culprit this time. There were definitely huge tables creating lots of contention (I have truncated all those, as we don't really use them, apart from the query "snapshot".

Something started at 2am that made the purge lag go thru the roof and made the server super slow.
In the end I stopped mysql, changed innodb_purge_threads = 3 , started back with the event scheduler stopped, let the list_length to go back to 0 (it was around 4M), once that was 0. I started the event scheduler again and so far it's been working fine.

Looks like we are back to normal values operation-wise for tendril: https://grafana.wikimedia.org/d/000000273/mysql?viewPanel=2&orgId=1&var-server=db1115&var-port=9104&from=1619053676862&to=1619115163226

https://grafana.wikimedia.org/d/000000273/mysql?viewPanel=16&orgId=1&var-server=db1115&var-port=9104&from=1619053676862&to=1619115163226

https://grafana.wikimedia.org/d/000000273/mysql?viewPanel=11&orgId=1&var-server=db1115&var-port=9104&from=1619053676862&to=1619115163226

https://grafana.wikimedia.org/d/000000273/mysql?viewPanel=37&orgId=1&var-server=db1115&var-port=9104&from=1619053676862&to=1619115163226

There was recently maintenance on tendril to migrate its web frontend. While in theory puppet should setup everything automatically, make sure that 1) its memcache instance is setup correctly and it is working as intended 2) the maintenance operations setup in a cron job are running as usual. I wonder if increase on table size could be caused by some of these 2 things breaking on migration- e.g. the cron job deleting old records failing to execute and that is why we have a large table? I wouldn't expect innodb to have performance issues, but tokudb, but if it configuration change worked I won't complain :-).

The large table matches whatever happened during the night (and is still happening): https://grafana.wikimedia.org/d/000000377/host-overview?viewPanel=12&orgId=1&refresh=5m&var-server=db1115&var-datasource=thanos&var-cluster=mysql&from=1609545600000&to=now

-rw-rw---- 1 mysql mysql 103G Apr 23 07:27 general_log_sampled.ibd

As far as I remember the events to delete data are not meant to be for this table, but only for general_status_log ones. We've never deleted stuff from this table (first record was from 2020 - which was when we last truncated it).
The amount of data generated increased yesterday for some reason.

Keep in mind that I am not 100% sure this table was the culprit.

Just to be clear- I was just guessing on possible explanations, I think you know better the internals than me. Other option is to start truncating it, either manually or on a cronjob, if that makes sense.

Other option is to start truncating it, either manually or on a cronjob, if that makes sense.

Yeah, that's possibly what I will do, I want to see first if this table is only used on the query report or what, as that is valuable data and we use it for slow queries. But researching what tendril uses for what is such an archeology work...

So it grew like 40G in 5 hours...:

-rw-rw---- 1 mysql mysql 140G Apr 23 12:25 general_log_sampled.ibd

From what I gathered, it is definitely being used on the activity report we use. As I truncated it yesterday and a search for 48h queries only shows queries from 6PM UTC (which is around the time I truncated it).
This rate of growth is impossible to handle, so maybe what we can do is delete rows older than 24h (or 48h) every day or every 12h or so. But we've seen issues trying to do deletes from global_status_* tables, which are also huge.

+------+-------------+---------------------+------+---------------+------+---------+------+-----------+-------------+
| id   | select_type | table               | type | possible_keys | key  | key_len | ref  | rows      | Extra       |
+------+-------------+---------------------+------+---------------+------+---------+------+-----------+-------------+
|    1 | SIMPLE      | general_log_sampled | ALL  | NULL          | NULL | NULL    | NULL | 349064873 | Using where |
+------+-------------+---------------------+------+---------------+------+---------+------+-----------+-------------+

Tendril is struggling again, the size of the table after a week since its truncation:

-rw-rw---- 1 mysql mysql 1.1T Apr 29 14:15 general_log_sampled.ibd

For the record:

[16:21:20]  <marostegui> I think it is also global_status causing issues
[16:22:56]  <marostegui> tendril is back
[16:23:02]  <marostegui> It was a combination of both tables from what I can see
[16:23:23]  <marostegui> I truncated the 1T one and it sort of recovered, but it didn't fully recover until I truncated global_status_log