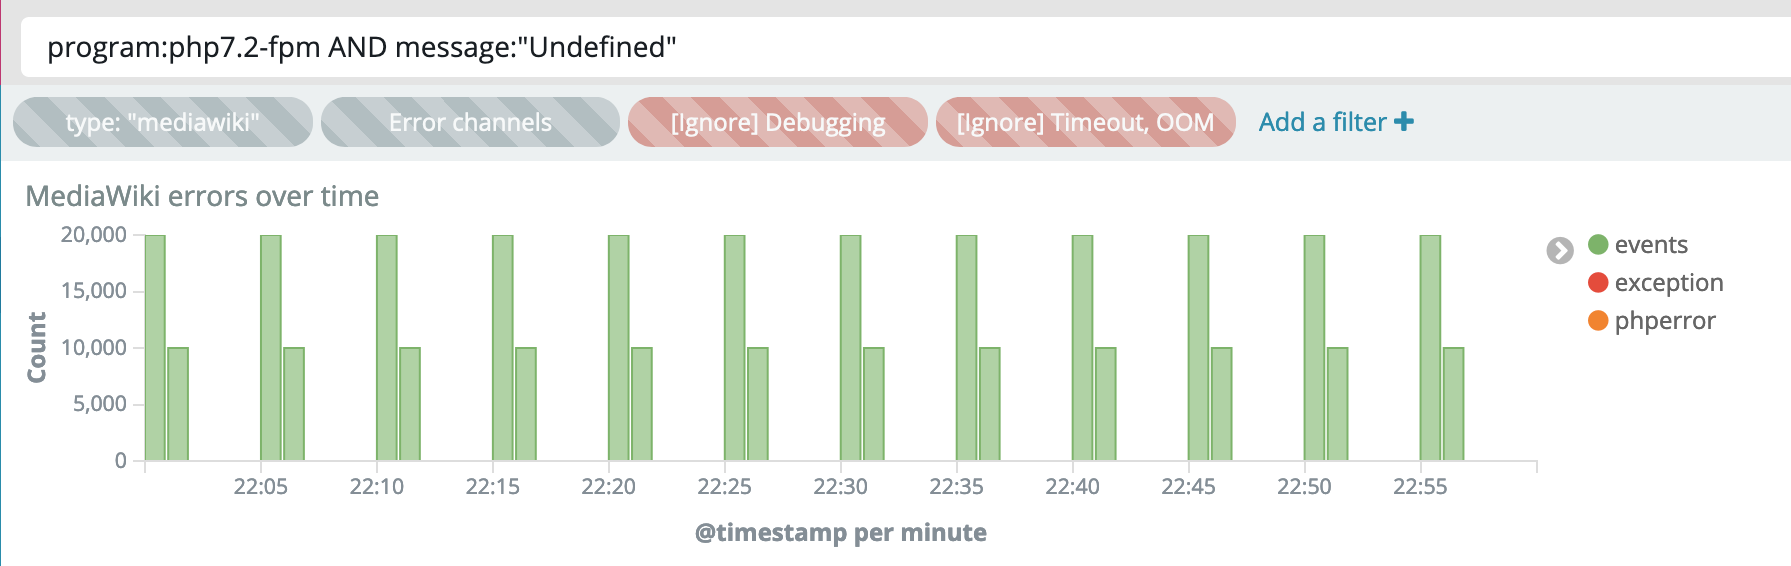
There was a minor incident today causing the Kafka-to-Logstash intake to get clogged for a few hours. It confirmed to me a suspicion I've held which is that the UI timestamp (used for bar charts and message feed sorting), seems to be based on Logstash intake, not based on message dispatch from the source application.
I thought for a while that this is perhaps because the source timestamp is hard to obtain or at least something we don't have right now. However I think I understand now that we do:
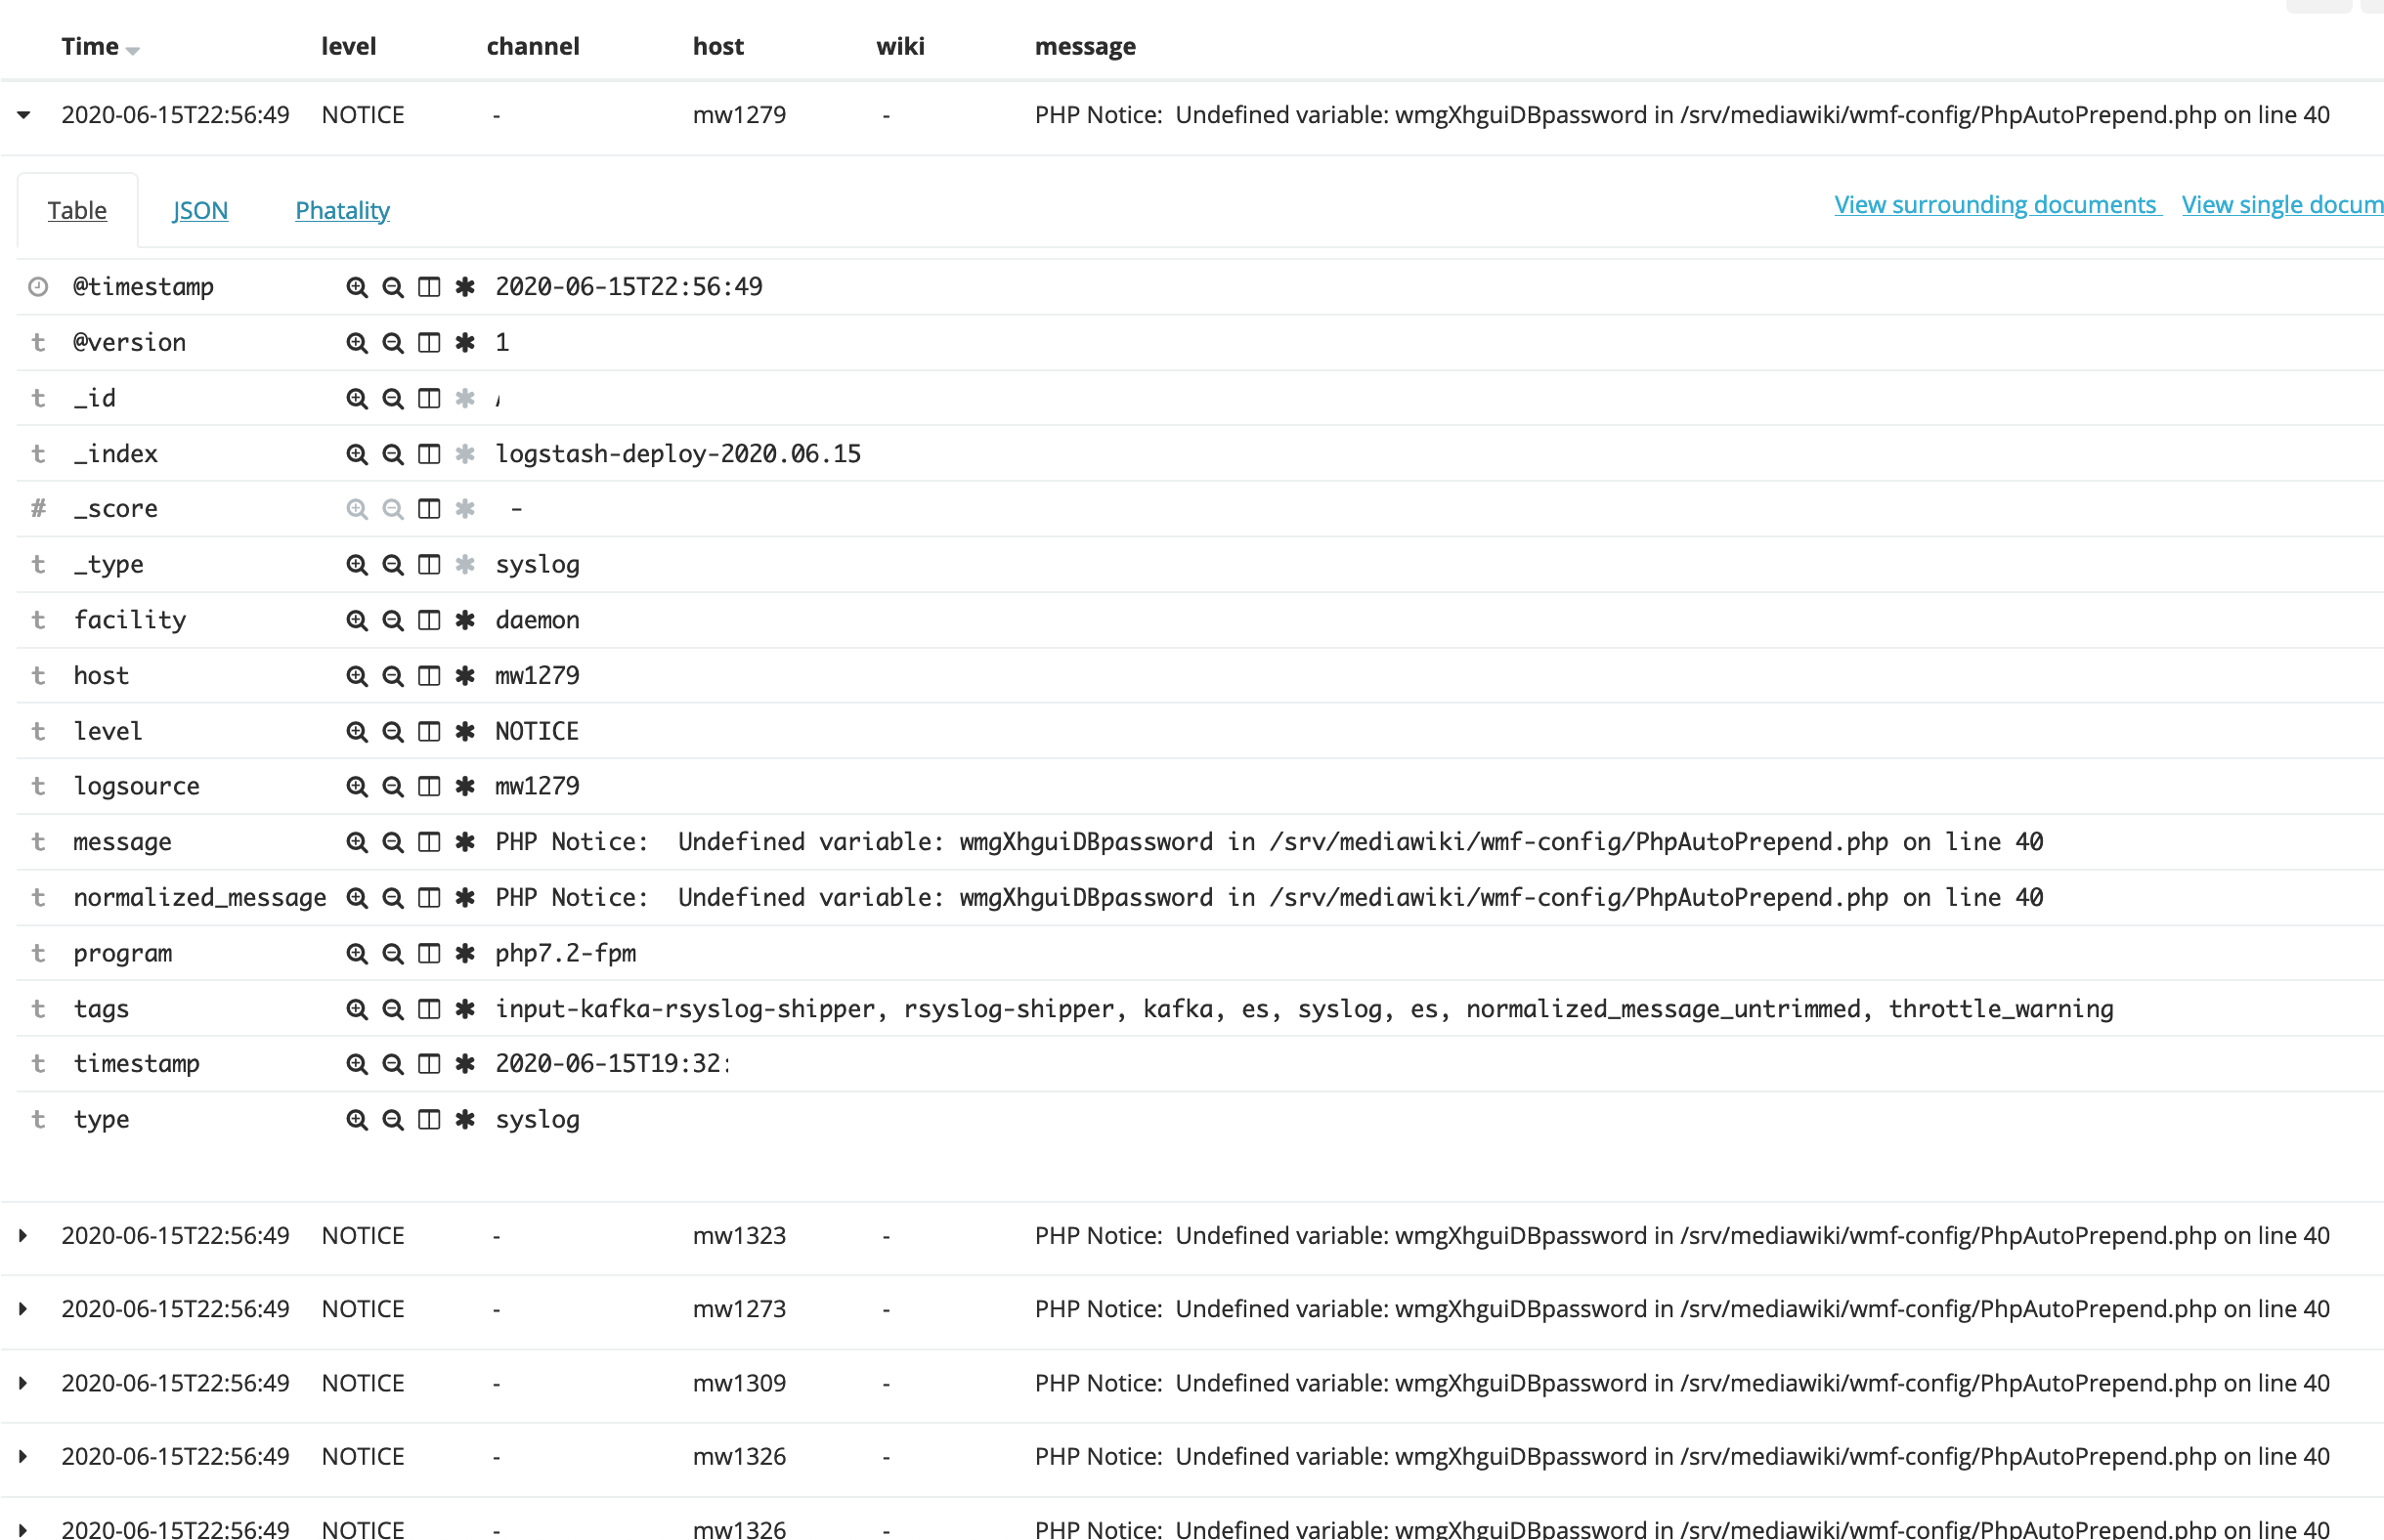
It seems @timestamp is the one used for time slice queries, UI charts, sorting, etc. and timestamp (no @) is the unused internal field for debug purposes, indicating when the message was dispatched in or to rsyslog, I think?
A similar issue exists with the Prometheus metrics we have for Logstash, however once understood, I think those are much easier to work with as-is. It also logically makes sense that you can't/shouldn't backdate or mutate such metrics. They are simply about the intake.
For Kibana and develop UX though, this intake information is imho the internal/debugging one, not the other way around. Could we flip this around for PHP/MW? Or perhaps for everything if people don't mind?
Alternatively, if we want to ensure a consistent meaning for the non-@ internal timestamp as being original application dispatch, perhaps we could make them both the same for PHP/MW, and if we want to store the Logstash intake time, put that in a separate field.