Page MenuHomePhabricator

puppetdb seems to be slow on host reimage
Closed, ResolvedPublic

Assigned To
Authored By
Volans
Sep 22 2020, 6:49 PM
Referenced Files
F34661383: image.png
Sep 29 2021, 11:32 AM
F34661345: image.png
Sep 29 2021, 10:53 AM
F34661351: image.png
Sep 29 2021, 10:53 AM
F34629504: image.png
Sep 2 2021, 5:03 PM
F34629521: image.png
Sep 2 2021, 5:03 PM

Description

NOTE: We have applied a bandage to clear down the queue directory if the queue gets too large, this is a temporary fix untill we can fix the underlining issues

@Papaul has reported some failures in the reimages in codfw. In all cases cumin2001 is failing to reboot the host because of missing the host key in the known hosts files even after the reimage script runs puppet on cumin2001.

This seems due to some "slowness" in PuppetDB, apparently more pronounced when hitting the codfw endpoint given that it seems it doesn't happen in eqiad (yet?).

Looking at puppetboard is clear that the puppet run on cumin2001 didn't add the new key and it gets added at the next run.

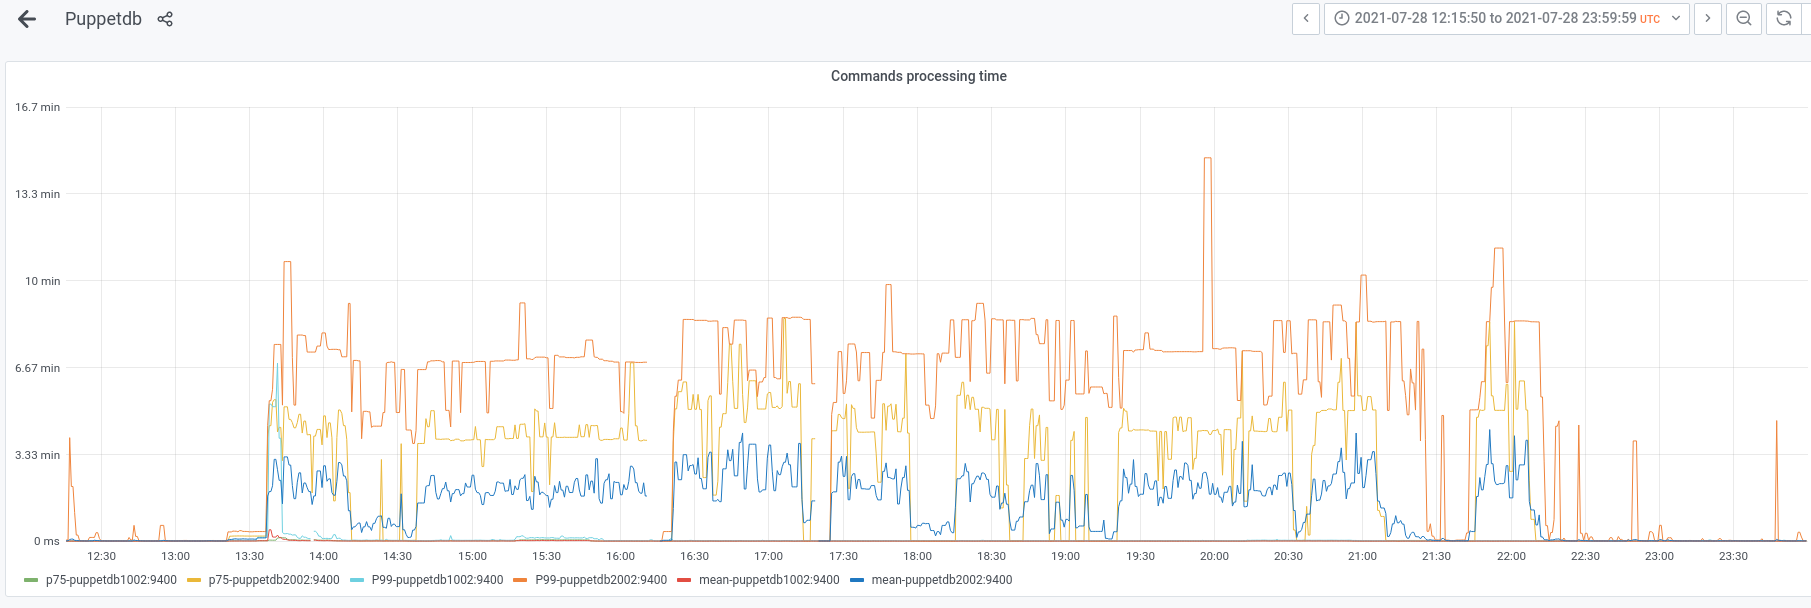
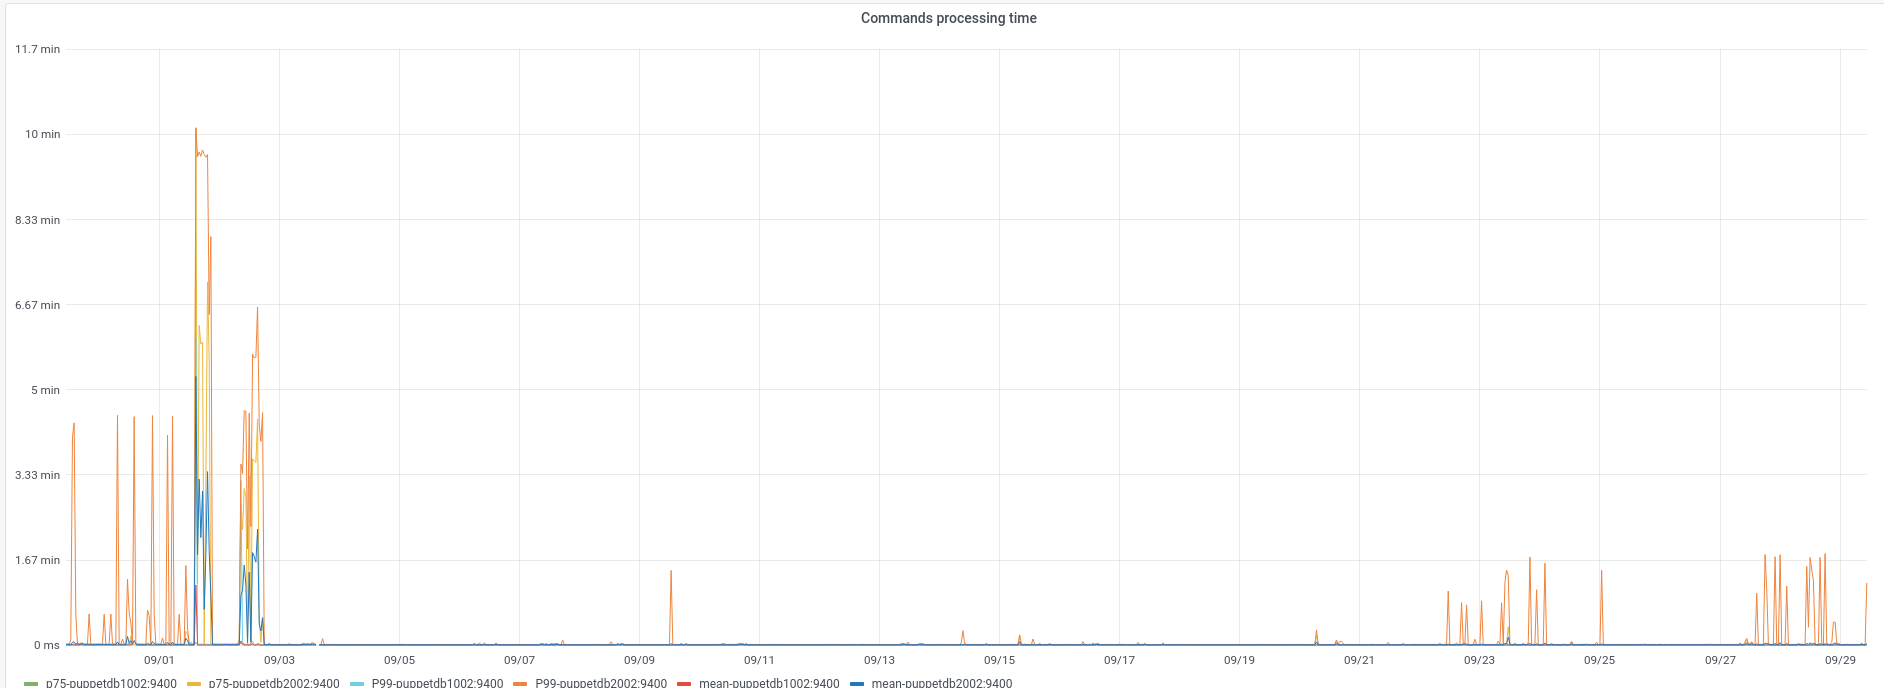
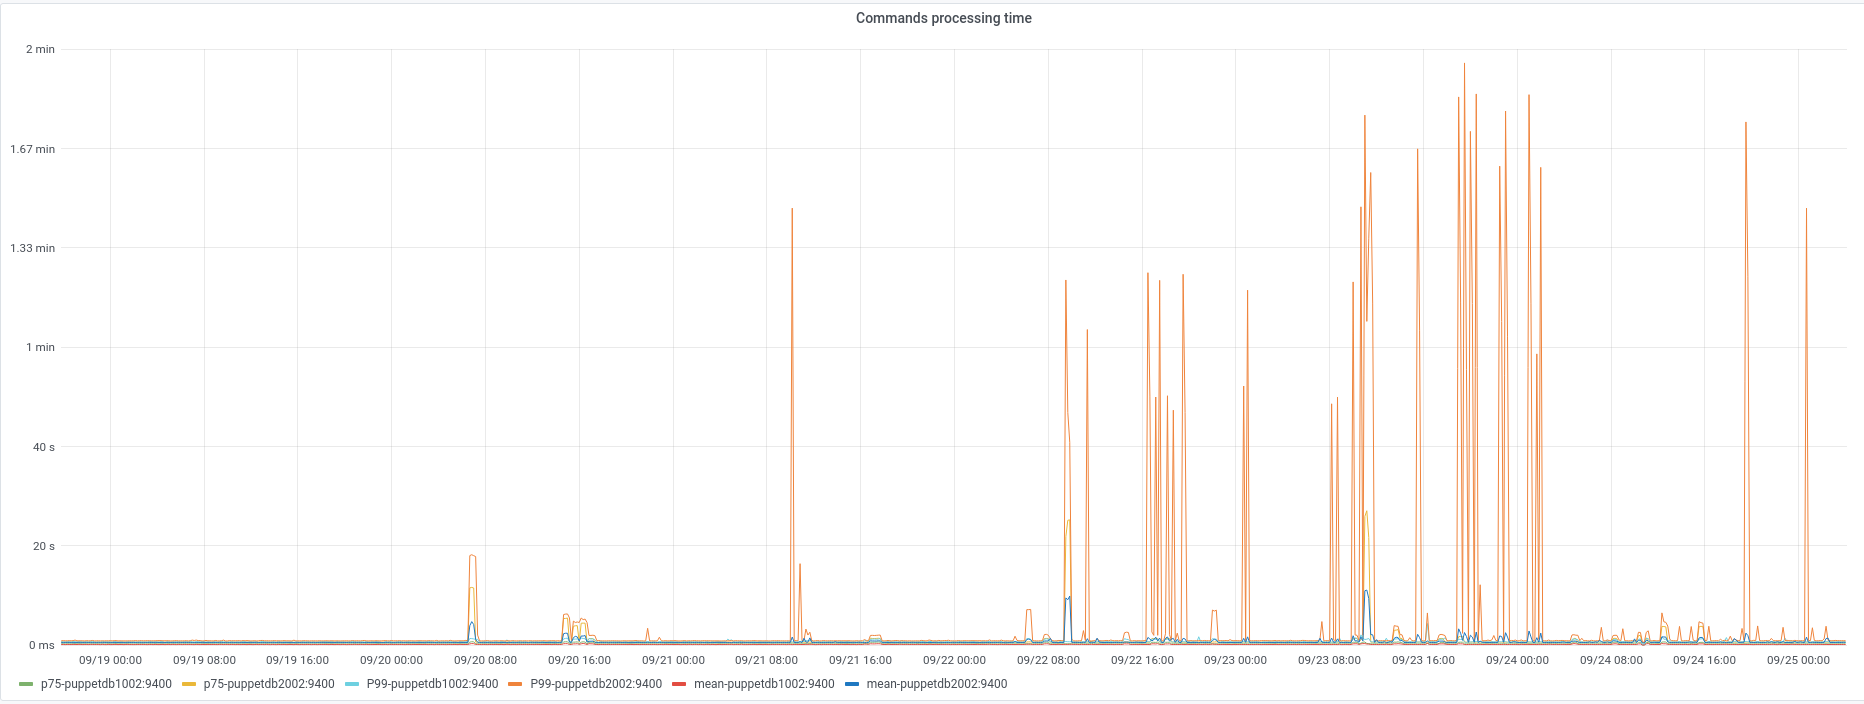
I've noticed in puppetdb2002 logs that the newly reimage host requests are pretty slow while they return to normal speed after the first runs.

$ grep maps2007 /var/log/puppetdb/puppetdb.log
2020-09-22T16:49:07.163Z INFO  [p.p.command] [6920576-1600793314103] [33053 ms] 'replace facts' command processed for maps2007.codfw.wmnet
2020-09-22T16:52:39.061Z INFO  [p.p.command] [6920581-1600793319454] [211865 ms] 'replace catalog' command processed for maps2007.codfw.wmnet
2020-09-22T16:52:56.040Z INFO  [p.p.command] [6920730-1600793510925] [65067 ms] 'store report' puppet v5.5.10 command processed for maps2007.codfw.wmnet
2020-09-22T16:57:51.132Z INFO  [p.p.command] [6921001-1600793864301] [6776 ms] 'replace catalog' command processed for maps2007.codfw.wmnet
2020-09-22T16:58:00.829Z INFO  [p.p.command] [6921011-1600793879724] [1096 ms] 'store report' puppet v5.5.10 command processed for maps2007.codfw.wmnet
2020-09-22T16:58:12.900Z INFO  [p.p.command] [6920998-1600793859260] [33633 ms] 'replace facts' command processed for maps2007.codfw.wmnet
2020-09-22T17:09:49.713Z INFO  [p.p.command] [6921542-1600794589093] [614 ms] 'replace facts' command processed for maps2007.codfw.wmnet
2020-09-22T17:09:55.388Z INFO  [p.p.command] [6921546-1600794594102] [1230 ms] 'replace catalog' command processed for maps2007.codfw.wmnet
2020-09-22T17:10:07.579Z INFO  [p.p.command] [6921561-1600794607019] [535 ms] 'store report' puppet v5.5.10 command processed for maps2007.codfw.wmnet
2020-09-22T17:39:47.507Z INFO  [p.p.command] [6922899-1600796386980] [519 ms] 'replace facts' command processed for maps2007.codfw.wmnet
2020-09-22T17:39:53.468Z INFO  [p.p.command] [6922905-1600796392117] [1271 ms] 'replace catalog' command processed for maps2007.codfw.wmnet

While I don't see the same pattern in a host reimaged in eqiad:

2020-09-22T17:02:07.653Z INFO  [p.p.command] [9294140-1600794127628] [15 ms] 'deactivate node' command processed for an-worker1101.eqiad.wmnet
2020-09-22T17:23:25.746Z INFO  [p.p.command] [9295662-1600795405509] [227 ms] 'replace facts' command processed for an-worker1101.eqiad.wmnet
2020-09-22T17:23:33.735Z INFO  [p.p.command] [9295670-1600795410672] [2995 ms] 'replace catalog' command processed for an-worker1101.eqiad.wmnet
2020-09-22T17:33:25.822Z INFO  [p.p.command] [9296433-1600796004907] [867 ms] 'store report' puppet v5.5.10 command processed for an-worker1101.eqiad.wmnet
2020-09-22T17:41:30.269Z INFO  [p.p.command] [9296963-1600796489912] [348 ms] 'replace facts' command processed for an-worker1101.eqiad.wmnet
2020-09-22T17:41:36.086Z INFO  [p.p.command] [9296975-1600796495402] [622 ms] 'replace catalog' command processed for an-worker1101.eqiad.wmnet
2020-09-22T17:41:57.488Z INFO  [p.p.command] [9297003-1600796517405] [72 ms] 'store report' puppet v5.5.10 command processed for an-worker1101.eqiad.wmnet
2020-09-22T17:50:09.042Z INFO  [p.p.command] [9297592-1600797008966] [65 ms] 'replace facts' command processed for an-worker1101.eqiad.wmnet

I think we should look at why puppetdb2002 is so slow in certain requests.

That said I also looked briefly at the postgres DB and I'm wondering if we could improve our configuration, in particular regarding vacuum because it seems too big to me for the data it should hold, but maybe it's all normal.
On Grafana the filesystem utilization on puppetdb1002 is growing but slowly, maybe related to the normal grow of the catalogs and hosts.

For what is worth I'm reporting here some data, might be useful if we start looking at it or even if just to compare back in few weeks.

Total size of the DB

   name    |  owner   |  size
-----------+----------+---------
 puppetdb  | puppetdb | 16 GB

Biggest relations:

                      relation                       |  size
-----------------------------------------------------+---------
 public.idx_factsets_jsonb_merged                    | 4999 MB
 public.edges_certname_source_target_type_unique_key | 3352 MB
 public.catalog_resources                            | 1473 MB
 public.edges                                        | 1100 MB
 public.fact_paths_path_trgm                         | 673 MB
 public.catalog_resources_encode_idx                 | 568 MB
 public.resource_params_hash_expr_idx                | 516 MB

Total size of biggest tables:

           relation           | total_size
------------------------------+------------
 public.factsets              | 5040 MB
 public.edges                 | 4454 MB
 public.catalog_resources     | 3419 MB
 public.resource_params       | 1933 MB
 public.fact_paths            | 867 MB
 public.resource_params_cache | 363 MB

With more detailed info:

    table_schema    |       table_name        | row_estimate |   total    |   index    |   toast    |   table
--------------------+-------------------------+--------------+------------+------------+------------+------------
 public             | factsets                |         1623 | 5040 MB    | 5002 MB    | 35 MB      | 2696 kB
 public             | edges                   |   8.3642e+06 | 4454 MB    | 3353 MB    | 8192 bytes | 1101 MB
 public             | catalog_resources       |   3.2955e+06 | 3419 MB    | 1946 MB    | 8192 bytes | 1474 MB
 public             | resource_params         |  3.37787e+06 | 1933 MB    | 1479 MB    | 46 MB      | 408 MB
 public             | fact_paths              |       239540 | 867 MB     | 788 MB     | 8192 bytes | 79 MB
 public             | resource_params_cache   |       271284 | 363 MB     | 100 MB     | 51 MB      | 212 MB
 public             | reports                 |        72713 | 270 MB     | 61 MB      | 27 MB      | 182 MB
 public             | resource_events         |        15140 | 168 MB     | 154 MB     | 216 kB     | 14 MB
 public             | catalogs                |         1623 | 3096 kB    | 2256 kB    | 8192 bytes | 832 kB
 public             | certnames               |         1623 | 1944 kB    | 1512 kB    | 8192 bytes | 424 kB
`

Details

SubjectRepoBranchLines +/-
operations/puppetproduction+3 -30
operations/puppetproduction+5 -1
operations/puppetproduction+15 -2
operations/puppetproduction+10 -1
operations/puppetproduction+15 -2
operations/puppetproduction+17 -50
operations/puppetproduction+30 -16
operations/puppetproduction+59 -7
operations/puppetproduction+1 -3
operations/puppetproduction+21 -13
operations/puppetproduction+51 -40
operations/puppetproduction+14 -41
operations/puppetproduction+8 -0
operations/puppetproduction+0 -1
operations/puppetproduction+9 -15
operations/puppetproduction+38 -0
operations/puppetproduction+1 -0
operations/puppetproduction+13 -0
operations/puppetproduction+23 -1
operations/puppetproduction+1 -1
operations/puppetproduction+57 -39
operations/puppetproduction+2 -0
operations/puppetproduction+111 -88
operations/puppetproduction+47 -32
operations/puppetproduction+1 -0
operations/puppetproduction+67 -0
operations/puppetproduction+2 -0
Show related patches Customize query in gerrit

Event Timeline

There are a very large number of changes, so older changes are hidden. Show Older Changes

I have created a draft puppetdb postgress dash board to help investigate further

I have noticed we get very regular spikes of command processing which also corresponds to high inserts in the puppetdb. wonder if there is some batching going on, or if a couple of nodes (icinga) are causing a lot of churn

The spikes don't seem to follow the 30m usual puppet frequency but more a 20 minutes one: 00, 20, 40...
For reference the current puppet runs for the alert hosts are at 18,48 for alert1001 and 23,53 for alert2001.

For reference the current puppet runs for the alert hosts are at 18,48 for alert1001 and 23,53 for alert2001.

Thanks

Fyi i have also updated the puppetdb grafana board to use the thanos data store and fixed some of the metricts

i noticed that the when we get the high store reports we get a corrosponding entry in the postgres log

2021-07-28 20:06:52.013 GMT [db:puppetdb,sess:6101adfe.de9,pid:3561,vtid:67/1476806,tid:147349992] LOG:  duration: 210990.369 ms  execute <unnamed>: UPDATE certnames SET latest_report_id = $1,latest_report_timestamp = $2 WHERE certname = $3AND ( latest_report_timestamp < $4      OR latest_report_timestamp is NULL )
2021-07-28 20:06:52.013 GMT [db:puppetdb,sess:6101adfe.de9,pid:3561,vtid:67/1476806,tid:147349992] DETAIL:  parameters: $1 = '48891629', $2 = '2021-07-28 19:00:12.245+00', $3 = 'kafka-logging2001.codfw.wmnet', $4 = '2021-07-28 19:00:12.245+00'
NOTE: NOTE: We have applied a bandage to clear down the queue directory if the queue gets too large, this is a temporary fix untill we can fix the underlining issues

So there was an issue yesterday when the autovacum process kicked in and caused a lot of locking on the database, this in turn caused a lot the command processing to skyrocket, which also meant that the stockpile queue was filling up before it could clear. When the stockpile queue mount reaches 100% capacity the puppetdb starts to error and puppet runs fail. We experienced this yesterday for about 5-010 minutes. the resolution was to sudo find /var/lib/puppetdb/stockpile/cmd/q -type f -delete this means that we lost a number of reports yesterday while the vacuum process was taking place. During this time the java memory usage and GC events where also struggling, see the Java section on the puppetdb grafana page

During the whole vacuum period a lot of the submissions for reports where taking 1m -> 15m and the log message in the puppetdb file for long store report operations often matched an equivalent message in the postgres logs on puppetdb1002 (see above). A cursory look at the postgress log today shows that most long queries seem to relate to large factsetes or operations on the faces table.

faces
2021-07-29 11:54:30.955 GMT [db:puppetdb,sess:61028c1b.5041,pid:20545,vtid:65/1448366,tid:147510070] LOG:  duration: 11016.221 ms  execute <unnamed>: with recursive live_paths(path, value) as   (select key as path, value      from (select (jsonb_each(stable||volatile)).* from factsets) as base_case      union        select path||'#~'||sub_level.key as path,               sub_level.value          from live_paths,          lateral (select *                     from (select (jsonb_each(value)).*                             where jsonb_typeof(value) = 'object') as sub_fields                     union (select generate_series(0, jsonb_array_length(value - 1))::text as key,                                   jsonb_array_elements(value) as value                              where jsonb_typeof(value) = 'array')) as sub_level)   select path into unlogged tmp_live_paths from live_paths

The large fact sets we see in the logs often relate to k8s hosts which have an huge factset. however this is not always the case and below i have pasted one of the smaller ones just as an example

factset
2021-07-29 11:45:26.625 GMT [db:puppetdb,sess:610288ab.447a,pid:17530,vtid:15/1534261,tid:147508572] LOG:  duration: 10117.497 ms  execute <unnamed>: UPDATE factsets SET timestamp = $1,environment_id = $2,producer_timestamp = $3,hash = $4,producer_id = $5,paths_hash = $6,volatile = $7 WHERE id=$8
2021-07-29 11:45:26.625 GMT [db:puppetdb,sess:610288ab.447a,pid:17530,vtid:15/1534261,tid:147508572] DETAIL:  parameters: $1 = '2021-07-29 11:45:16.452+00', $2 = '1', $3 = '2021-07-29 11:45:16.417+00', $4 = '\x9a27742e0c8a611e3aedf893e8419e2e64b24e99', $5 = '1', $6 = '\x512793fcb192e1648149166d756a7a8ffc57fe21', $7 = '{"os": {"name": "Debian", "distro": {"id": "Debian", "release": {"full": "10", "major": "10"}, "codename": "buster", "description": "Debian GNU/Linux 10 (buster)"}, "family": "Debian", "release": {"full": "10.10", "major": "10", "minor": "10"}, "selinux": {"enabled": false}, "hardware": "x86_64", "architecture": "amd64"}, "path": "/usr/bin:/bin:/usr/sbin:/sbin", "memory": {"swap": {"used": "0 bytes", "total": "976.00 MiB", "capacity": "0%", "available": "976.00 MiB", "used_bytes": 0, "total_bytes": 1023406080, "available_bytes": 1023406080}, "system": {"used": "9.98 GiB", "total": "62.54 GiB", "capacity": "15.95%", "available": "52.56 GiB", "used_bytes": 10712141824, "total_bytes": 67146801152, "available_bytes": 56434659328}}, "uptime": "92 days", "memoryfree": "52.56 GiB", "net_driver": {"eno1": {"speed": 1000, "driver": "tg3", "duplex": "full", "firmware_version": "FFV21.80.8 bc 5720-v1.39"}, "eno2": {"speed": -1, "driver": "tg3", "duplex": "unknown", "firmware_version": "FFV21.80.8 bc 5720-v1.39"}}, "mountpoints": {"/": {"size": "72.83 GiB", "used": "2.14 GiB", "device": "/dev/mapper/vg0-root", "options": ["rw", "relatime", "errors=remount-ro"], "capacity": "2.93%", "available": "70.70 GiB", "filesystem": "ext4", "size_bytes": 78203613184, "used_bytes": 2292998144, "available_bytes": 75910615040}, "/run": {"size": "6.25 GiB", "used": "633.79 MiB", "device": "tmpfs", "options": ["rw", "nosuid", "noexec", "relatime", "size=6557308k", "mode=755"], "capacity": "9.90%", "available": "5.63 GiB", "filesystem": "tmpfs", "size_bytes": 6714683392, "used_bytes": 664576000, "available_bytes": 6050107392}, "/srv": {"size": "276.49 GiB", "used": "64.03 MiB", "device": "/dev/mapper/vg0-srv", "options": ["rw", "relatime"], "capacity": "0.02%", "available": "276.43 GiB", "filesystem": "ext4", "size_bytes": 296881291264, "used_bytes": 67137536, "available_bytes": 296814153728}, "/dev/shm": {"size": "31.27 GiB", "used": "0 bytes", "device": "tmpfs", "options": ["rw", "nosuid", "nodev"], "capacity": "0%", "available": "31.27 GiB", "filesystem": "tmpfs", "size_bytes": 33573400576, "used_bytes": 0, "available_bytes": 33573400576}, "/run/lock": {"size": "5.00 MiB", "used": "0 bytes", "device": "tmpfs", "options": ["rw", "nosuid", "nodev", "noexec", "relatime", "size=5120k"], "capacity": "0%", "available": "5.00 MiB", "filesystem": "tmpfs", "size_bytes": 5242880, "used_bytes": 0, "available_bytes": 5242880}, "/run/user/112": {"size": "6.25 GiB", "used": "0 bytes", "device": "tmpfs", "options": ["rw", "nosuid", "nodev", "relatime", "size=6557304k", "mode=700", "uid=112", "gid=119"], "capacity": "0%", "available": "6.25 GiB", "filesystem": "tmpfs", "size_bytes": 6714679296, "used_bytes": 0, "available_bytes": 6714679296}, "/sys/fs/cgroup": {"size": "31.27 GiB", "used": "0 bytes", "device": "tmpfs", "options": ["ro", "nosuid", "nodev", "noexec", "mode=755"], "capacity": "0%", "available": "31.27 GiB", "filesystem": "tmpfs", "size_bytes": 33573400576, "used_bytes": 0, "available_bytes": 33573400576}}, "uptime_days": 92, "uptime_hours": 2219, "block_devices": [{"dev": "sda", "size": 480103981056, "type": "disk", "uuid": "", "fstype": "", "mountpoint": ""}, {"dev": "sda1", "size": 298844160, "type": "part", "uuid": "", "fstype": "", "mountpoint": ""}, {"dev": "sda2", "size": 479803211776, "type": "part", "uuid": "6a11b179-b788-20ce-273e-fa41232b0d36", "fstype": "linux_raid_member", "mountpoint": ""}, {"dev": "sdb", "size": 480103981056, "type": "disk", "uuid": "", "fstype": "", "mountpoint": ""}, {"dev": "sdb1", "size": 298844160, "type": "part", "uuid": "", "fstype": "", "mountpoint": ""}, {"dev": "sdb2", "size": 479803211776, "type": "part", "uuid": "6a11b179-b788-20ce-273e-fa41232b0d36", "fstype": "linux_raid_member", "mountpoint": ""}, {"dev": "md0", "size": 479667945472, "type": "raid1", "uuid": "vepioz-kY7A-WLTv-xJ4u-yFwn-0C04-eEzYDk", "fstype": "LVM2_member", "mountpoint": ""}, {"dev": "md0", "size": 479667945472, "type": "raid1", "uuid": "vepioz-kY7A-WLTv-xJ4u-yFwn-0C04-eEzYDk", "fstype": "LVM2_member", "mountpoint": ""}, {"dev": "vg0-root", "size": 79997960192, "type": "lvm", "uuid": "c5404704-3ee0-4f19-a2ff-19accb2cd55e", "fstype": "ext4", "mountpoint": "/"}, {"dev": "vg0-root", "size": 79997960192, "type": "lvm", "uuid": "c5404704-3ee0-4f19-a2ff-19accb2cd55e", "fstype": "ext4", "mountpoint": "/"}, {"dev": "vg0-swap", "size": 1023410176, "type": "lvm", "uuid": "da979242-803f-48c8-9204-0e22994c0c23", "fstype": "swap", "mountpoint": "[SWAP]"}, {"dev": "vg0-swap", "size": 1023410176, "type": "lvm", "uuid": "da979242-803f-48c8-9204-0e22994c0c23", "fstype": "swap", "mountpoint": "[SWAP]"}, {"dev": "vg0-srv", "size": 302707113984, "type": "lvm", "uuid": "10d3a7ff-1efb-48b5-9aa5-1a3579f67b43", "fstype": "ext4", "mountpoint": "/srv"}, {"dev": "vg0-srv", "size": 302707113984, "type": "lvm", "uuid": "10d3a7ff-1efb-48b5-9aa5-1a3579f67b43", "fstype": "ext4", "mountpoint": "/srv"}], "load_averages": {"1m": 0.08, "5m": 0.02, "15m": 0.01}, "memoryfree_mb": 53820.28515625, "memorysize_mb": 64036.1796875, "puppet_config": {"agent": {"server": "puppet"}, "master": {"ssldir": "/var/lib/puppet/ssl", "localcacert": "/var/lib/puppet/ssl/certs/ca.pem"}, "ssldir": "/var/lib/puppet/ssl", "hostcert": "/var/lib/puppet/ssl/certs/snapshot1014.eqiad.wmnet.pem", "hostpubkey": "/var/lib/puppet/ssl/public_keys/snapshot1014.eqiad.wmnet.pem", "hostprivkey": "/var/lib/puppet/ssl/private_keys/snapshot1014.eqiad.wmnet.pem", "localcacert": "/var/lib/puppet/ssl/certs/ca.pem"}, "system_uptime": {"days": 92, "hours": 2219, "uptime": "92 days", "seconds": 7990731}, "uptime_seconds": 7990731, "operatingsystemrelease": "10.10"}', $8 = '2284'

While investigating this issue we noticed that the faces table seems to be constantly growing. Currently w have the following information for the edges database

  • number of certnames: 1718. This value seems correct i.e. we don't have any old nodes in the database
  • row count 15435928, this has almost doubled the value since riccardo posted above (8364200)
  • db size 7931 MB this has almost doubled the value since riccardo posted above (4999 MB)

Looking at some random hosts we see the following number of rows in the edges table:

serverrowsnotes
sretest10016856has minimum set of resources
alert100114795probably has the most resources
kubernetes2001.codfw.wmnet7037has a lot of facts
db1096.eqiad.wmnet7122random host
mw1324.eqiad.wmnet12562random host

Im not really sure ho to interpret theses values however it feels right to me that alerts would be much higher then other nodes as it has a lot of resources and therefore a lot of edges. however the fact that the table has almost doubled makes me think that all the numbers are higher then they should be and data is not been cleaned up properly. @colewhite also noticed that a lot of DELETE queries aimed at this table where blocked for long periods (possibly dropped?)

Further steps

In order to dig into this more i think we should investigate at least the following streams:

  • Look at tuning the autovacum settings, looking at our config we have the default values which may not be the best values for such large databases, more research required here
  • understand if the continuous growth on the edges database is expected or if we need to do some maintenance
  • Look again at filtering the facts. specifically disk and interface related facts on k8s hosts. Under normal operations it seems that factsets updates (along with edges) are the ones that take the longest

@colewhite @herron thanks for the help with this yesterday and could you please review the above and add anything i may have missed thanks

I should also note that currently we dont know when the next vacume process will occuer and it is quite possible that when it dose it will knock out the puppetdb server in codfw again

jbond raised the priority of this task from Medium to High.Jul 30 2021, 12:17 AM
jbond updated the task description. (Show Details)

Until the root cause has been found and fixed within the autovacuum logic; how about we add a reconciliation systemd timer which checks disk consumption on the stockpile tmpfs and which deletes files if less than a gigabyte is remaining? Seems like an acceptable interim workaround to ensure that Puppet continues to work fine?

Until the root cause has been found and fixed within the autovacuum logic; how about we add a reconciliation systemd timer which checks disk consumption on the stockpile tmpfs and which deletes files if less than a gigabyte is remaining? Seems like an acceptable interim workaround to ensure that Puppet continues to work fine?

As the queue is on a tmpfs when the queue starts fighting for memory As such I wonder if we should be more aggressive then that. under normal operations the queue is less then 100MB. so we could remove files if the q gets larger then 1G.

As such I wonder if we should be more aggressive then that. under normal operations the queue is less then 100MB. so we could remove files if the q gets larger then 1G.

Yeah, sounds good to me, given that peak shown in Grafana that should kick in reliably enough if we run the reconciliantion timer every five minutes.

ack ill draft something shortly

Change 709034 had a related patch set uploaded (by Jbond; author: John Bond):

[operations/puppet@production] P:puppetdb: add script to automatically clean down the stockpile dir

https://gerrit.wikimedia.org/r/709034

Change 709034 merged by Jbond:

[operations/puppet@production] P:puppetdb: add script to automatically clean down the stockpile dir

https://gerrit.wikimedia.org/r/709034

jbond updated the task description. (Show Details)

To replicate what I had found in the task description (source) here is the same data as of now:
And yes I would say that most tables have grown in size despite the small increment in the number of hosts.

   name    |  owner   |  size
-----------+----------+---------
 puppetdb  | puppetdb | 28 GB
                      relation                       |  size
-----------------------------------------------------+---------
 public.idx_factsets_jsonb_merged                    | 9166 MB
 public.edges_certname_source_target_type_unique_key | 6607 MB
 public.edges                                        | 2213 MB
 public.catalog_resources                            | 2154 MB
 public.fact_paths_path_trgm                         | 1327 MB
 public.catalog_resources_encode_idx                 | 922 MB
 public.resource_params_hash_expr_idx                | 752 MB
 public.catalog_resources_type_title_idx             | 649 MB
           relation            | total_size
-------------------------------+------------
 public.factsets               | 9214 MB
 public.edges                  | 8822 MB
 public.catalog_resources      | 5302 MB
 public.resource_params        | 2771 MB
 public.fact_paths             | 1549 MB
 public.resource_params_cache  | 514 MB
 public.resource_events        | 377 MB
 public.reports                | 320 MB
   table_schema    |       table_name        | row_estimate |   total    |   index    |   toast    |   table
-------------------+-------------------------+--------------+------------+------------+------------+------------
public             | factsets                |         1719 | 9214 MB    | 9170 MB    | 41 MB      | 2696 kB
public             | edges                   |  1.54767e+07 | 8822 MB    | 6608 MB    | 8192 bytes | 2214 MB
public             | catalog_resources       |  4.31735e+06 | 5302 MB    | 3148 MB    | 8192 bytes | 2155 MB
public             | resource_params         |  4.70399e+06 | 2771 MB    | 2170 MB    | 54 MB      | 548 MB
public             | fact_paths              |       267422 | 1549 MB    | 1466 MB    | 8192 bytes | 83 MB
public             | resource_params_cache   |       410264 | 514 MB     | 154 MB     | 55 MB      | 305 MB
public             | resource_events         |        45615 | 377 MB     | 355 MB     | 192 kB     | 22 MB
public             | reports                 |        82570 | 320 MB     | 66 MB      | 65 MB      | 188 MB
public             | catalogs                |         1719 | 3688 kB    | 2608 kB    | 8192 bytes | 1072 kB
public             | certnames               |         1719 | 2016 kB    | 1584 kB    | 8192 bytes | 424 kB

I've also found this PuppetDB issue that might be related, even if not per-se directly, as a shift in the way the data is stored in the factset table and related performance of the related API endpoint.

Looking at the factset volatile entry for a random host (cumin2002), I see some entries that are pretty large, namely:

  • cpu_flags
  • cpu_details.flags (duplicate of the above)
  • mountpoints, because it includes those of the type /run/user/$ID too

Looking at the stable one (already smaller, so less of an issue):

  • processors.models looks like is an array of the same type (the CPU model) for all its cores. While I can understand that 2-core hosts could in theory have different CPUs, I don't see how different cores of the same CPU could differ from each other.
  • processor$ID: has again the full CPU model, duplicated from the above

Doing the same exercise for a more problematic host wrt facts (kubernetes1012.eqiad.wmnet)...
Volatile (~300KB):

  • numa (includes all the cali* interfaces)
  • networking.lo:LVS: has the IPs of all the services hosted on k8s
  • networking.cali*: all the calico ephemeral interfaces
  • partitions: all the /dev/mapper/docker-* mounted partitions
  • mountpoints: all the /var/lib/docker/devicemapper/* partitions, /var/lib/kubelet/pods/* ones, /var/lib/docker/containers/* ones
  • block_devices: same as the above

Stable (16KB):

  • interface-related facts: mtu_cali*, netmask6_cali*, ipaddress6_cali*, macaddress_cali*

I think that we should definitely filter the more spamming facts outlined above, that should reduce the size of the table and complexity of some queries on the DB side.
As for the rest I agree with what was outlined by John in T263578#7246024 "Further steps" section.
The other suggestion that I have is to strongly consider moving PuppetDB to physical hosts with larger resources.

I did some additional investigation on the edges table and so far I found this:

  • did query a random host for this API: curl -vvo test1 "localhost:8080/pdb/query/v4/catalogs/cumin2002.codfw.wmnet"
  • Looked at the content of the edges field:
$ jq '.edges' test1 | grep source_type | sort | uniq -c | sort -nr | head
   2954       "source_type": "Admin::Hashuser",
   2665       "source_type": "Admin::Hashgroup",
    895       "source_type": "Class",
    329       "source_type": "Admin::User",
  • The Admin::Hashuser and Admin::Hashgroup seems to have tons of relations that I don't think are justified.

Those might be related to some relation that we might have added into the Puppet code.
At a first look of modules/admin/manifests/init.pp I can't see anything obvious that changed recently in those resources and our ordering is there since long time. Those are the last commits from that file:

  • a3dcc1fde5 C:admin: add ability to manage home
  • 1550da850c sudo: add new flag purge_sudoeres_d
  • d441a45184 admin: add support for system users and groups
  • f1b1c6f495 admin: ensure correct ordering of resources [Feb. 2019]

Trying to query /pdb/query/v4/catalogs/<NODE>/edges was never ending, I stopped the curl when the file was 200+MB and from a cursory look at it it was getting all the edges not only those related to the host I selected. That needs surely some more investigation.

Change 715461 had a related patch set uploaded (by Jbond; author: John Bond):

[operations/puppet@production] puppetdb: block additional facts

https://gerrit.wikimedia.org/r/715461

Change 715547 had a related patch set uploaded (by Jbond; author: John Bond):

[operations/puppet@production] C:puppetdb::app: move blacklist file to correct config

https://gerrit.wikimedia.org/r/715547

Change 715547 merged by Jbond:

[operations/puppet@production] C:puppetdb::app: move blacklist file to correct config

https://gerrit.wikimedia.org/r/715547

Mentioned in SAL (#wikimedia-sre) [2021-08-31T11:38:33Z] <jbond> sudo gnt-instance modify --disk add:size=100G puppetdb1002.eqiad.wmnet T263578

Mentioned in SAL (#wikimedia-sre) [2021-08-31T11:38:38Z] <jbond> sudo gnt-instance modify --disk add:size=100G puppetdb2002.codfw.wmnet T263578

Change 715724 had a related patch set uploaded (by Jbond; author: John Bond):

[operations/puppet@production] admin: droprequire

https://gerrit.wikimedia.org/r/715724

Change 715724 merged by Jbond:

[operations/puppet@production] admin: droprequire

https://gerrit.wikimedia.org/r/715724

Change 715728 had a related patch set uploaded (by Jbond; author: John Bond):

[operations/puppet@production] admin: drop dependencies between adminuser and admingroup

https://gerrit.wikimedia.org/r/715728

Mentioned in SAL (#wikimedia-operations) [2021-08-31T13:47:07Z] <jbond> disable puppet fleet wide to preform puppetdb maintance T263578

I have added a new 100GB disk so that the system has enough space to preform the vacume. this has meant doing the following

  • add new ganeti disk
  • format as ext4 and mount to /mnt/srv
  • sudo rsync -av /srv/ /mnt/srv/
  • update mount so that the new system is mounted in /srv
  • reboot
  • test
  • delete the old /srv data

Mentioned in SAL (#wikimedia-operations) [2021-08-31T14:29:59Z] <jbond> enable puppet fleet wide to post preform puppetdb maintance T263578

https://www.2ndquadrant.com/en/blog/postgresql-vacuum-and-analyze-best-practice-tips/ has some good advice on autovacum settings, this is something we should tweek shortly after preforming the full vacume

  • The Admin::Hashuser and Admin::Hashgroup seems to have tons of relations that I don't think are justified.

Indeed every user has a relationship with every group and every group membership. We can simplify this significantly, the first dependency can simply be dropped as puppet aurorequires will take care of that, the second dependency can be refactored so that we only add the dependency for users that actually members.

This is not something that has changed recently however every new user/group causes an exponential growth of relations (even for empty groups)

Change 715461 merged by Jbond:

[operations/puppet@production] puppetdb: block additional facts

https://gerrit.wikimedia.org/r/715461

Mentioned in SAL (#wikimedia-operations) [2021-09-01T10:20:58Z] <jbond> start filtering more puppet facts G:715461 - T263578

Change 715728 merged by Jbond:

[operations/puppet@production] admin: drop dependencies between adminuser and admingroup

https://gerrit.wikimedia.org/r/715728

Just a quick update, i preformed the facts change at roughly 10:30 UTC, you can see in the graph below that we had a spike in command processing at about this time lasting for about 30 minutes then a smaller speak lasting another 30 minutes. the second peak is due to the fact that i originally forgot to filter block_devices and i merged thay change at roughly 11 UTC. This initial spike is not unexpected as it had to delete a bunch of data it no longer cared about. after this the command processing looked a lot better, that is until around 14:28 when as you can see we saw our worst performance yet. Once this died down though we do see that the facts change seems to have had a posatve overall affect however its not the fix we wanted.

image.png (559×1 px, 128 KB)

https://grafana.wikimedia.org/d/000000477/puppetdb?viewPanel=7&orgId=1&from=1630485398493&to=1630532764190

What happened at 14:28, well i merged a fairly trivial change which added some additional groups. shortly after this another group was also added. This reminded me that we also had a bunch of groups added by analytics on the 28th Jul. The same day we had the last issues and when we check the times we see that the occurred with in minutes of that change being merged.

image.png (608×1 px, 155 KB)

https://grafana.wikimedia.org/d/000000477/puppetdb?viewPanel=7&orgId=1&from=1627474550345&to=1627516799000

This gives a very strong pointer that the issues occurs when adding new groups and possibly smaller spikes when we add new users (i didn't check). As such fixing the admin::hashuser/admin::hashgroup relations ships sould hopefully help a lot. That fix has been applied and comparing the number of edges for cumin (similar to T263578#7264013) we see the numbers have reduced significantly.

$ jq .edges faces/cumin1001_post_change |  grep source_type | sort | uniq -c | sort -nr | head
    905       "source_type": "Class",
    337       "source_type": "Admin::User",
    278       "source_type": "File",
    266       "source_type": "User",
    217       "source_type": "Admin::Hashuser",
    132       "source_type": "Stage",
    113       "source_type": "Systemd::Unit",
     76       "source_type": "Systemd::Syslog",
     74       "source_type": "Package",
     66       "source_type": "Exec",

Applying this change lead to another processing spike as postgress needed to remove a bunch of stuff from edges. however i expect that to die normalise by tomorrow

https://grafana.wikimedia.org/d/000000477/puppetdb?viewPanel=7&orgId=1&from=now-6h&to=now&refresh=1m

The next action i will take is to disable puppet fleet wide tomorrow and then run a VACUME FULL ANALYSE on the pupetdb database (after taking an lvm snapshot of the postgress data drive). After this has completed we should look at updating the autovacum settings so that they are more aligned with the usage patterns of puppetdb

Thanks a lot for the detailed update @jbond!

So far the graph is looking much healthier with the odd peak in the range of ~20s instead of 5-10m

Mentioned in SAL (#wikimedia-operations) [2021-09-03T15:00:38Z] <jbond> disable puppet fleet wide to preform puppetdb database maintance - T263578

Mentioned in SAL (#wikimedia-operations) [2021-09-03T15:17:20Z] <jbond> create lvm snapshot puppetdb1002_data_snapshot on ganeti1012 - T263578

Mentioned in SAL (#wikimedia-operations) [2021-09-03T15:21:04Z] <jbond> create lvm snapshot puppetdb2002_data_snapshot on ganeti2023 - T263578

created snapshots as a roll back stratagy post vacum

ganeti1012
$ sudo lvdisplay ganeti/puppetdb1002_data_snapshot                             
 Configuration setting "activation/thin_check_executable" unknown.
 --- Logical volume ---
 LV Path                /dev/ganeti/puppetdb1002_data_snapshot
 LV Name                puppetdb1002_data_snapshot
 VG Name                ganeti
 LV UUID                gPMRxI-eE5F-Q2cM-wvrT-0MsC-OIaR-Dpwfe2
 LV Write Access        read/write
 LV Creation host, time ganeti1012, 2021-09-03 15:17:24 +0000
 LV snapshot status     active destination for 9fde319c-7b68-4c91-8aee-7714e990efe6.disk1_data
 LV Status              available
 # open                 0
 LV Size                100.00 GiB
 Current LE             25600
 COW-table size         100.00 GiB
 COW-table LE           25600
 Allocated to snapshot  0.00%
 Snapshot chunk size    4.00 KiB
 Segments               1
 Allocation             inherit
 Read ahead sectors     auto
 - currently set to     6144
 Block device           253:38
ganeti2023
$ sudo lvdisplay ganeti/puppetdb2002_data_snapshot              
  Configuration setting "activation/thin_check_executable" unknown.
  --- Logical volume ---
  LV Path                /dev/ganeti/puppetdb2002_data_snapshot
  LV Name                puppetdb2002_data_snapshot
  VG Name                ganeti
  LV UUID                n9dtqz-xPFF-aQwQ-gxJL-zjMW-u2tQ-Rr3Vmy
  LV Write Access        read/write
  LV Creation host, time ganeti2023, 2021-09-03 15:20:59 +0000
  LV snapshot status     active destination for 735bee7b-6c91-4b7c-8035-34d81272a3eb.disk1_meta
  LV Status              available
  # open                 0
  LV Size                128.00 MiB
  Current LE             32
  COW-table size         132.00 MiB
  COW-table LE           33
  Allocated to snapshot  0.00%
  Snapshot chunk size    4.00 KiB
  Segments               1
  Allocation             inherit
  Read ahead sectors     auto
  - currently set to     6144
  Block device           253:34

VACUUM FULL VERBOSE ANALYZE; is running on pupetdb1002 in a tmux session under my user

VACUUM FULL VERBOSE ANALYZE; is running on pupetdb1002 in a tmux session under my user

Well that completed very fast here are the new sizes

    table_schema    |       table_name        | row_estimate |   total    |   index    |   toast    |   table    
--------------------+-------------------------+--------------+------------+------------+------------+------------
 public             | catalog_resources       |  4.44147e+06 | 3040 MB    | 1069 MB    | 8192 bytes | 1971 MB
 public             | resource_params         |  4.71688e+06 | 1329 MB    | 886 MB     | 25 MB      | 418 MB
 public             | edges                   |  6.32321e+06 | 1252 MB    | 613 MB     | 8192 bytes | 638 MB
 public             | resource_params_cache   |       398378 | 340 MB     | 78 MB      | 28 MB      | 235 MB
 public             | reports                 |        80413 | 229 MB     | 37 MB      | 46 MB      | 147 MB
 public             | factsets                |         1741 | 26 MB      | 11 MB      | 14 MB      | 1088 kB
 public             | resource_events         |        29853 | 22 MB      | 9664 kB    | 8192 bytes | 13 MB
 public             | fact_paths              |        33882 | 18 MB      | 12 MB      | 8192 bytes | 6560 kB

Mentioned in SAL (#wikimedia-operations) [2021-09-03T15:53:28Z] <jbond> enable puppet fleet wide to post puppetdb database maintance - T263578

Change 719302 had a related patch set uploaded (by Jbond; author: John Bond):

[operations/puppet@production] P:base: drop broad dependency

https://gerrit.wikimedia.org/r/719302

Change 719302 merged by Jbond:

[operations/puppet@production] P:base: drop broad dependency

https://gerrit.wikimedia.org/r/719302

Change 719518 had a related patch set uploaded (by Jbond; author: John Bond):

[operations/puppet@production] puppetdb: log \"long\" autovacuum tasks

https://gerrit.wikimedia.org/r/719518

Change 719518 merged by Jbond:

[operations/puppet@production] puppetdb: log \"long\" autovacuum tasks

https://gerrit.wikimedia.org/r/719518

After doing the work to compact this again the database as a whole is most tables have a row count of either equal to the number of hosts or less. We do have three tables which have a row count > 1m:

  • catalog_resources: 4411641
  • edges: 6199063
  • resource_params: 4687884
  • resource_params_cache: 395700

For now i have added the log_autovacuum_min_duration = 250ms to see how bad the autovacum process is

joanna_borun changed the task status from Open to In Progress.Sep 21 2021, 3:59 PM

puppetdb was fairly stable for some time, however we had to add some of the facts back into puppetdb specifically the numa and partitions facts which has unfortunately made the graphs a bit more spiky

image.png (688×1 px, 71 KB)

The numa fact was added back on September 21st however it wasn't fully deployed to puppetdb2002 until the 22nd at ~9:30. the partitions fact was added back on the 23rd

Below we show a zoomed in version of the processing times graph which shows the stat changes fairly close to when theses facts where added back. however there is an earlier peak at ~10:15 on the 21st worth exploring

image.png (704×1 px, 108 KB)

Its also worth noting that the increase in processing times no longer aligns with postgress locking (it aligned perfectly previously) however the number of requested checkpoints increased at a similar time

image.png (709×1 px, 113 KB)

however there is an earlier peak at ~10:15 on the 21st worth exploring

This alligned to the following puppetdb log event

2021-09-21T10:09:02.367Z INFO  [p.p.command] [1269153-1632218854364] [87974 ms] 'store report' puppet v5.5.22 command processed for puppetmaster2001.codfw.wmnet

however there was nothing of interest i.e. a slow sql query in the postgress logs

2021-09-21 10:08:27.913 GMT [db:,sess:6149af05.4d71,pid:19825,vtid:80/377144,tid:160897854] LOG:  automatic an
alyze of table "puppetdb.public.factsets" system usage: CPU: user: 1.08 s, system: 0.13 s, elapsed: 22.46 s
2021-09-21 10:12:52.602 GMT [db:,sess:6149aff5.4e2c,pid:20012,vtid:80/377210,tid:0] LOG:  automatic vacuum of 
table "puppetdb.public.factsets": index scans: 1
        pages: 0 removed, 167 remain, 0 skipped due to pins, 0 skipped frozen
        tuples: 227 removed, 1731 remain, 0 are dead but not yet removable, oldest xmin: 160898574
        buffer usage: 143898 hits, 0 misses, 15868 dirtied
        avg read rate: 0.000 MB/s, avg write rate: 2.636 MB/s
        system usage: CPU: user: 1.26 s, system: 0.09 s, elapsed: 47.02 s

Change 724730 had a related patch set uploaded (by Jbond; author: John Bond):

[operations/puppet@production] P:tlsproxy::instance: move defaults to hiera

https://gerrit.wikimedia.org/r/724730

Change 724733 had a related patch set uploaded (by Jbond; author: John Bond):

[operations/puppet@production] P:tlsproxy::instance: Drop numa_networking global

https://gerrit.wikimedia.org/r/724733

Change 662688 had a related patch set uploaded (by Jbond; author: John Bond):

[operations/puppet@production] interface: update rps script to also set the number of queues via ethtool

https://gerrit.wikimedia.org/r/662688

Change 662699 had a related patch set uploaded (by Jbond; author: John Bond):

[operations/puppet@production] interfaces: remove ethtool configueration

https://gerrit.wikimedia.org/r/662699

Change 724730 merged by Jbond:

[operations/puppet@production] P:tlsproxy::instance: move defaults to hiera

https://gerrit.wikimedia.org/r/724730

Change 730210 had a related patch set uploaded (by BBlack; author: BBlack):

[operations/puppet@production] interface-rps.py: no-op format/comment fixups

https://gerrit.wikimedia.org/r/730210

Change 730210 merged by Jbond:

[operations/puppet@production] interface-rps.py: no-op format/comment fixups

https://gerrit.wikimedia.org/r/730210

Change 662688 merged by Jbond:

[operations/puppet@production] interface: update rps script to also set the number of queues via ethtool

https://gerrit.wikimedia.org/r/662688

Change 662699 merged by Jbond:

[operations/puppet@production] interfaces: remove ethtool configueration

https://gerrit.wikimedia.org/r/662699

This seems to happen again, today's reimages of ganeti2012 and ganeti2028 failed since the host key change didn't get properly recorded. Riccardo noticed that https://grafana.wikimedia.org/d/000000477/puppetdb?orgId=1&viewPanel=7&from=now-2h&to=now shows puppetdb spikes of up to 2m and looking back at the past months, these spikes happened before as well.

Did we maybe add new facts recently?

It seems the postgresql replication on puppetdb2002 has stopped working

2022-07-18 10:50:43 GMT LOG:  started streaming WAL from primary at AD0C/7E000000 on timeline 1
2022-07-18 10:50:43 GMT FATAL:  could not receive data from WAL stream: ERROR:  requested WAL segment 000000010000AD0C0000007E has already been removed

As such anything querying puppetdb2002 is getting stale data. The route cause of this issues seems to correlates with the power issue in codfw last week and the following sal entry

16:11 cwhite: repair networking on puppetdb2002

For the record, the last state change of the Icinga alert that is alerting since then is Last State Change: 2022-07-12 16:11:29, related to the SAL log entry listed above.

i have re-synced puppetdb, however we need to prevent this from happening again. It seems we can increase the wal_keep_size but it may be better to create a replication slot . will create a child task to investigate

I retried the ganeti2028 reimage and everything works fine again, thanks!

Change 818450 had a related patch set uploaded (by Jbond; author: jbond):

[operations/puppet@production] P:adduser: apply adduser before any packages are installed

https://gerrit.wikimedia.org/r/818450

Change 818450 merged by Jbond:

[operations/puppet@production] P:adduser: apply adduser before any packages are installed

https://gerrit.wikimedia.org/r/818450

Change 819541 had a related patch set uploaded (by Jbond; author: Jbond):

[operations/puppet@production] P:adduser: apply adduser before any packages are installed

https://gerrit.wikimedia.org/r/819541

Change 819580 had a related patch set uploaded (by Jbond; author: jbond):

[operations/puppet@production] P:adduser: apply adduser before any packages are installed

https://gerrit.wikimedia.org/r/819580

Change 819581 had a related patch set uploaded (by Jbond; author: jbond):

[operations/puppet@production] P:apt: apply apt before any packages are installed

https://gerrit.wikimedia.org/r/819581

Change 819580 merged by Jbond:

[operations/puppet@production] P:adduser: apply adduser before any packages are installed

https://gerrit.wikimedia.org/r/819580

Change 819541 abandoned by Jbond:

[operations/puppet@production] P:adduser: apply adduser before any packages are installed

Reason:

https://gerrit.wikimedia.org/r/819541

Note to myself: Check if this is still an issue, and if yes, are we still working on it.

This should be resolved now ill tentativly close it, thanks for the ping and please re-open if there are still issues

Change 819581 abandoned by Jbond:

[operations/puppet@production] P:apt: apply apt before any packages are installed

Reason:

we have fixed this issue with a different patch

https://gerrit.wikimedia.org/r/819581