Page MenuHomePhabricator

varnishkafka 1.1.0 CPU usage increase
Closed, ResolvedPublic

Description

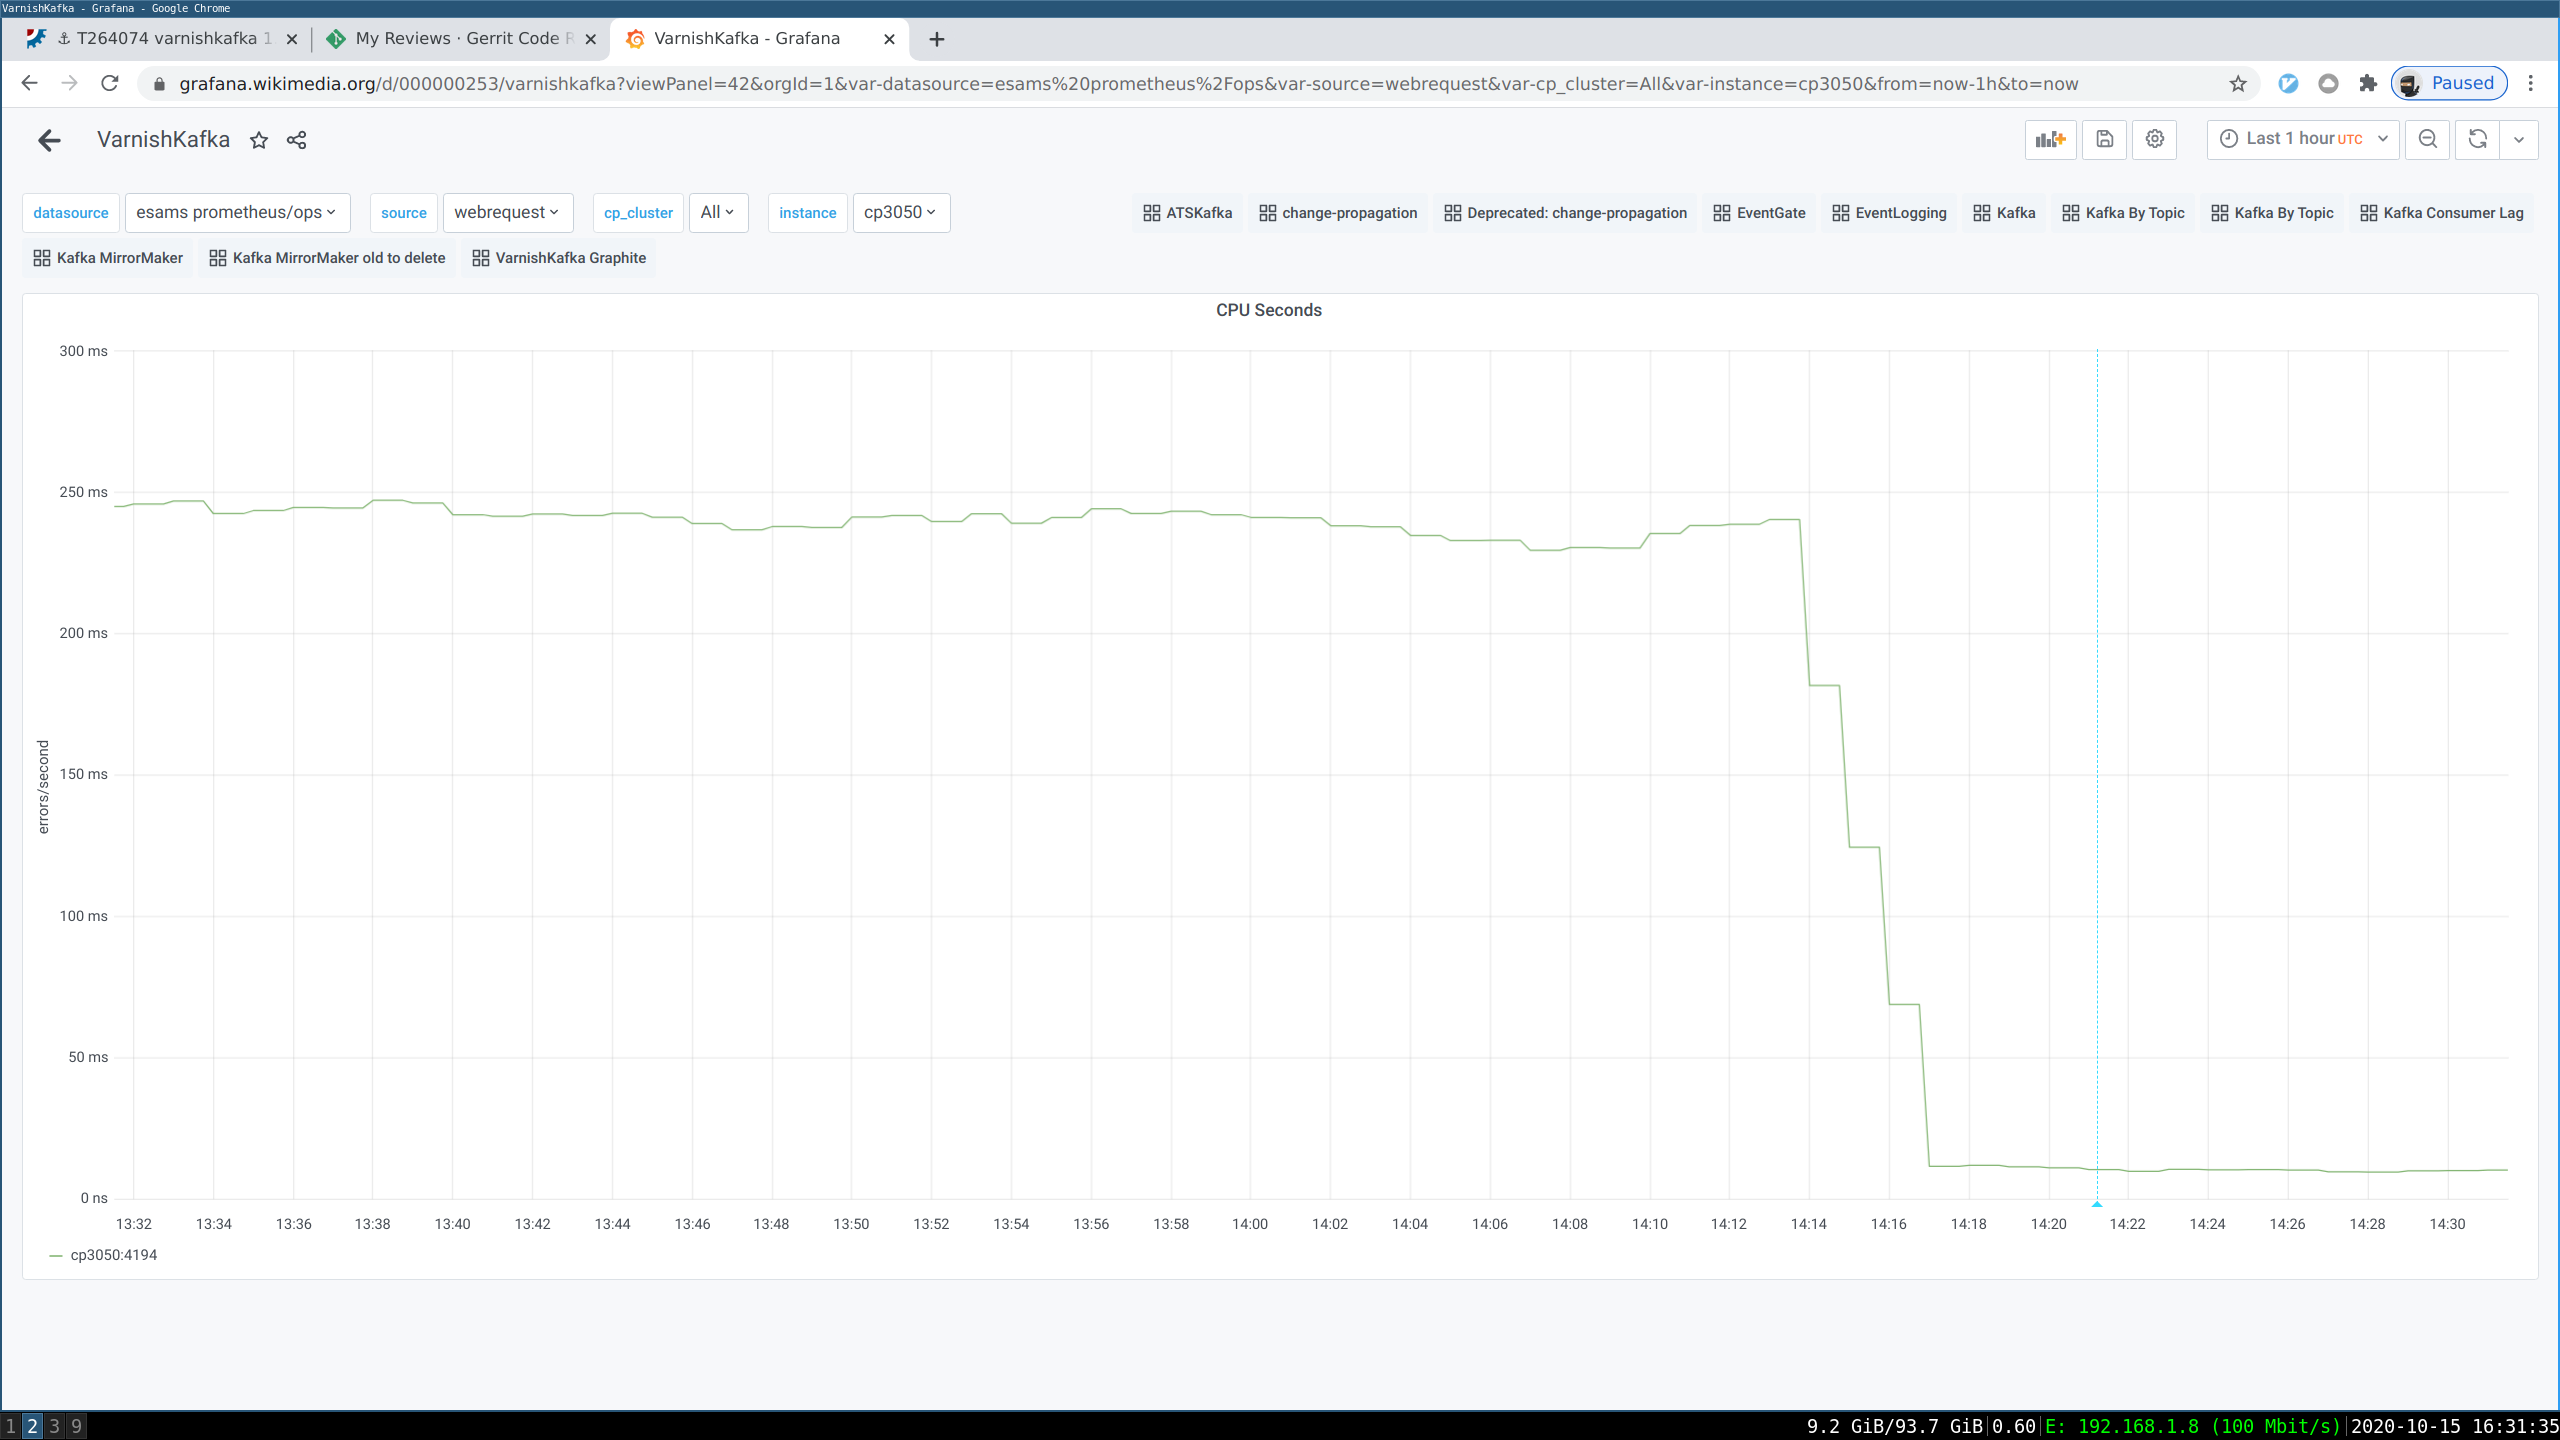
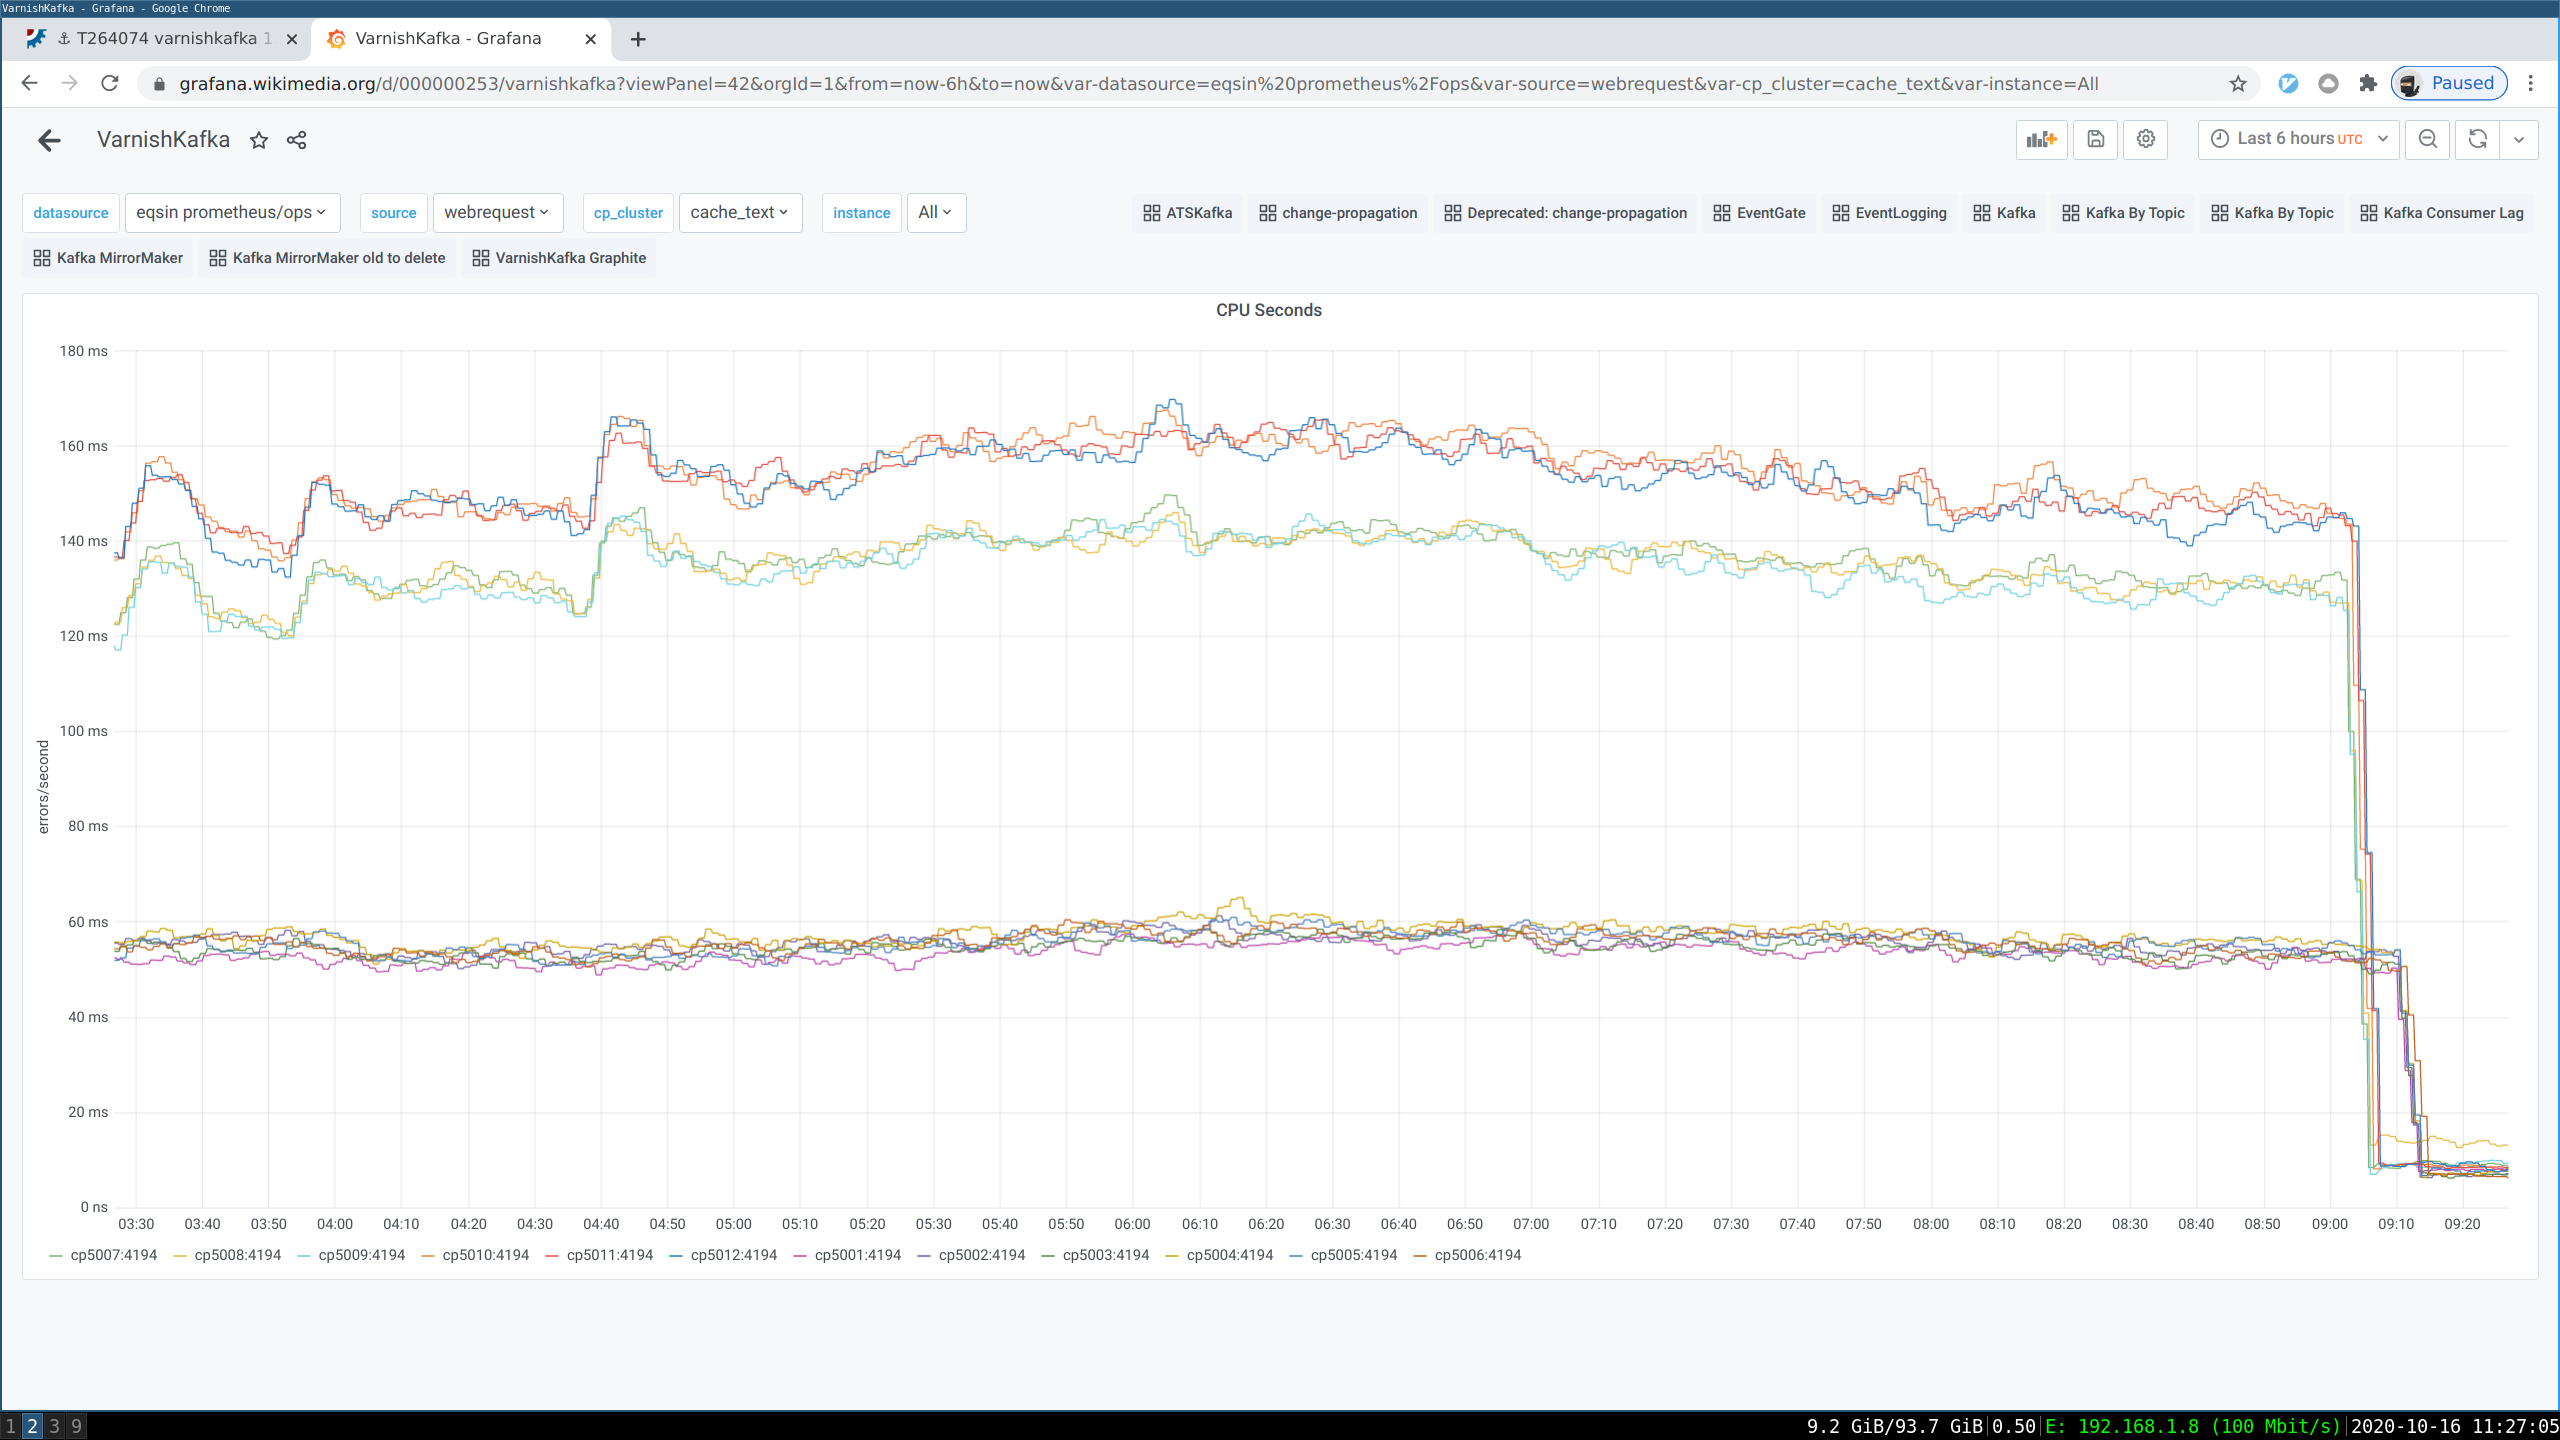
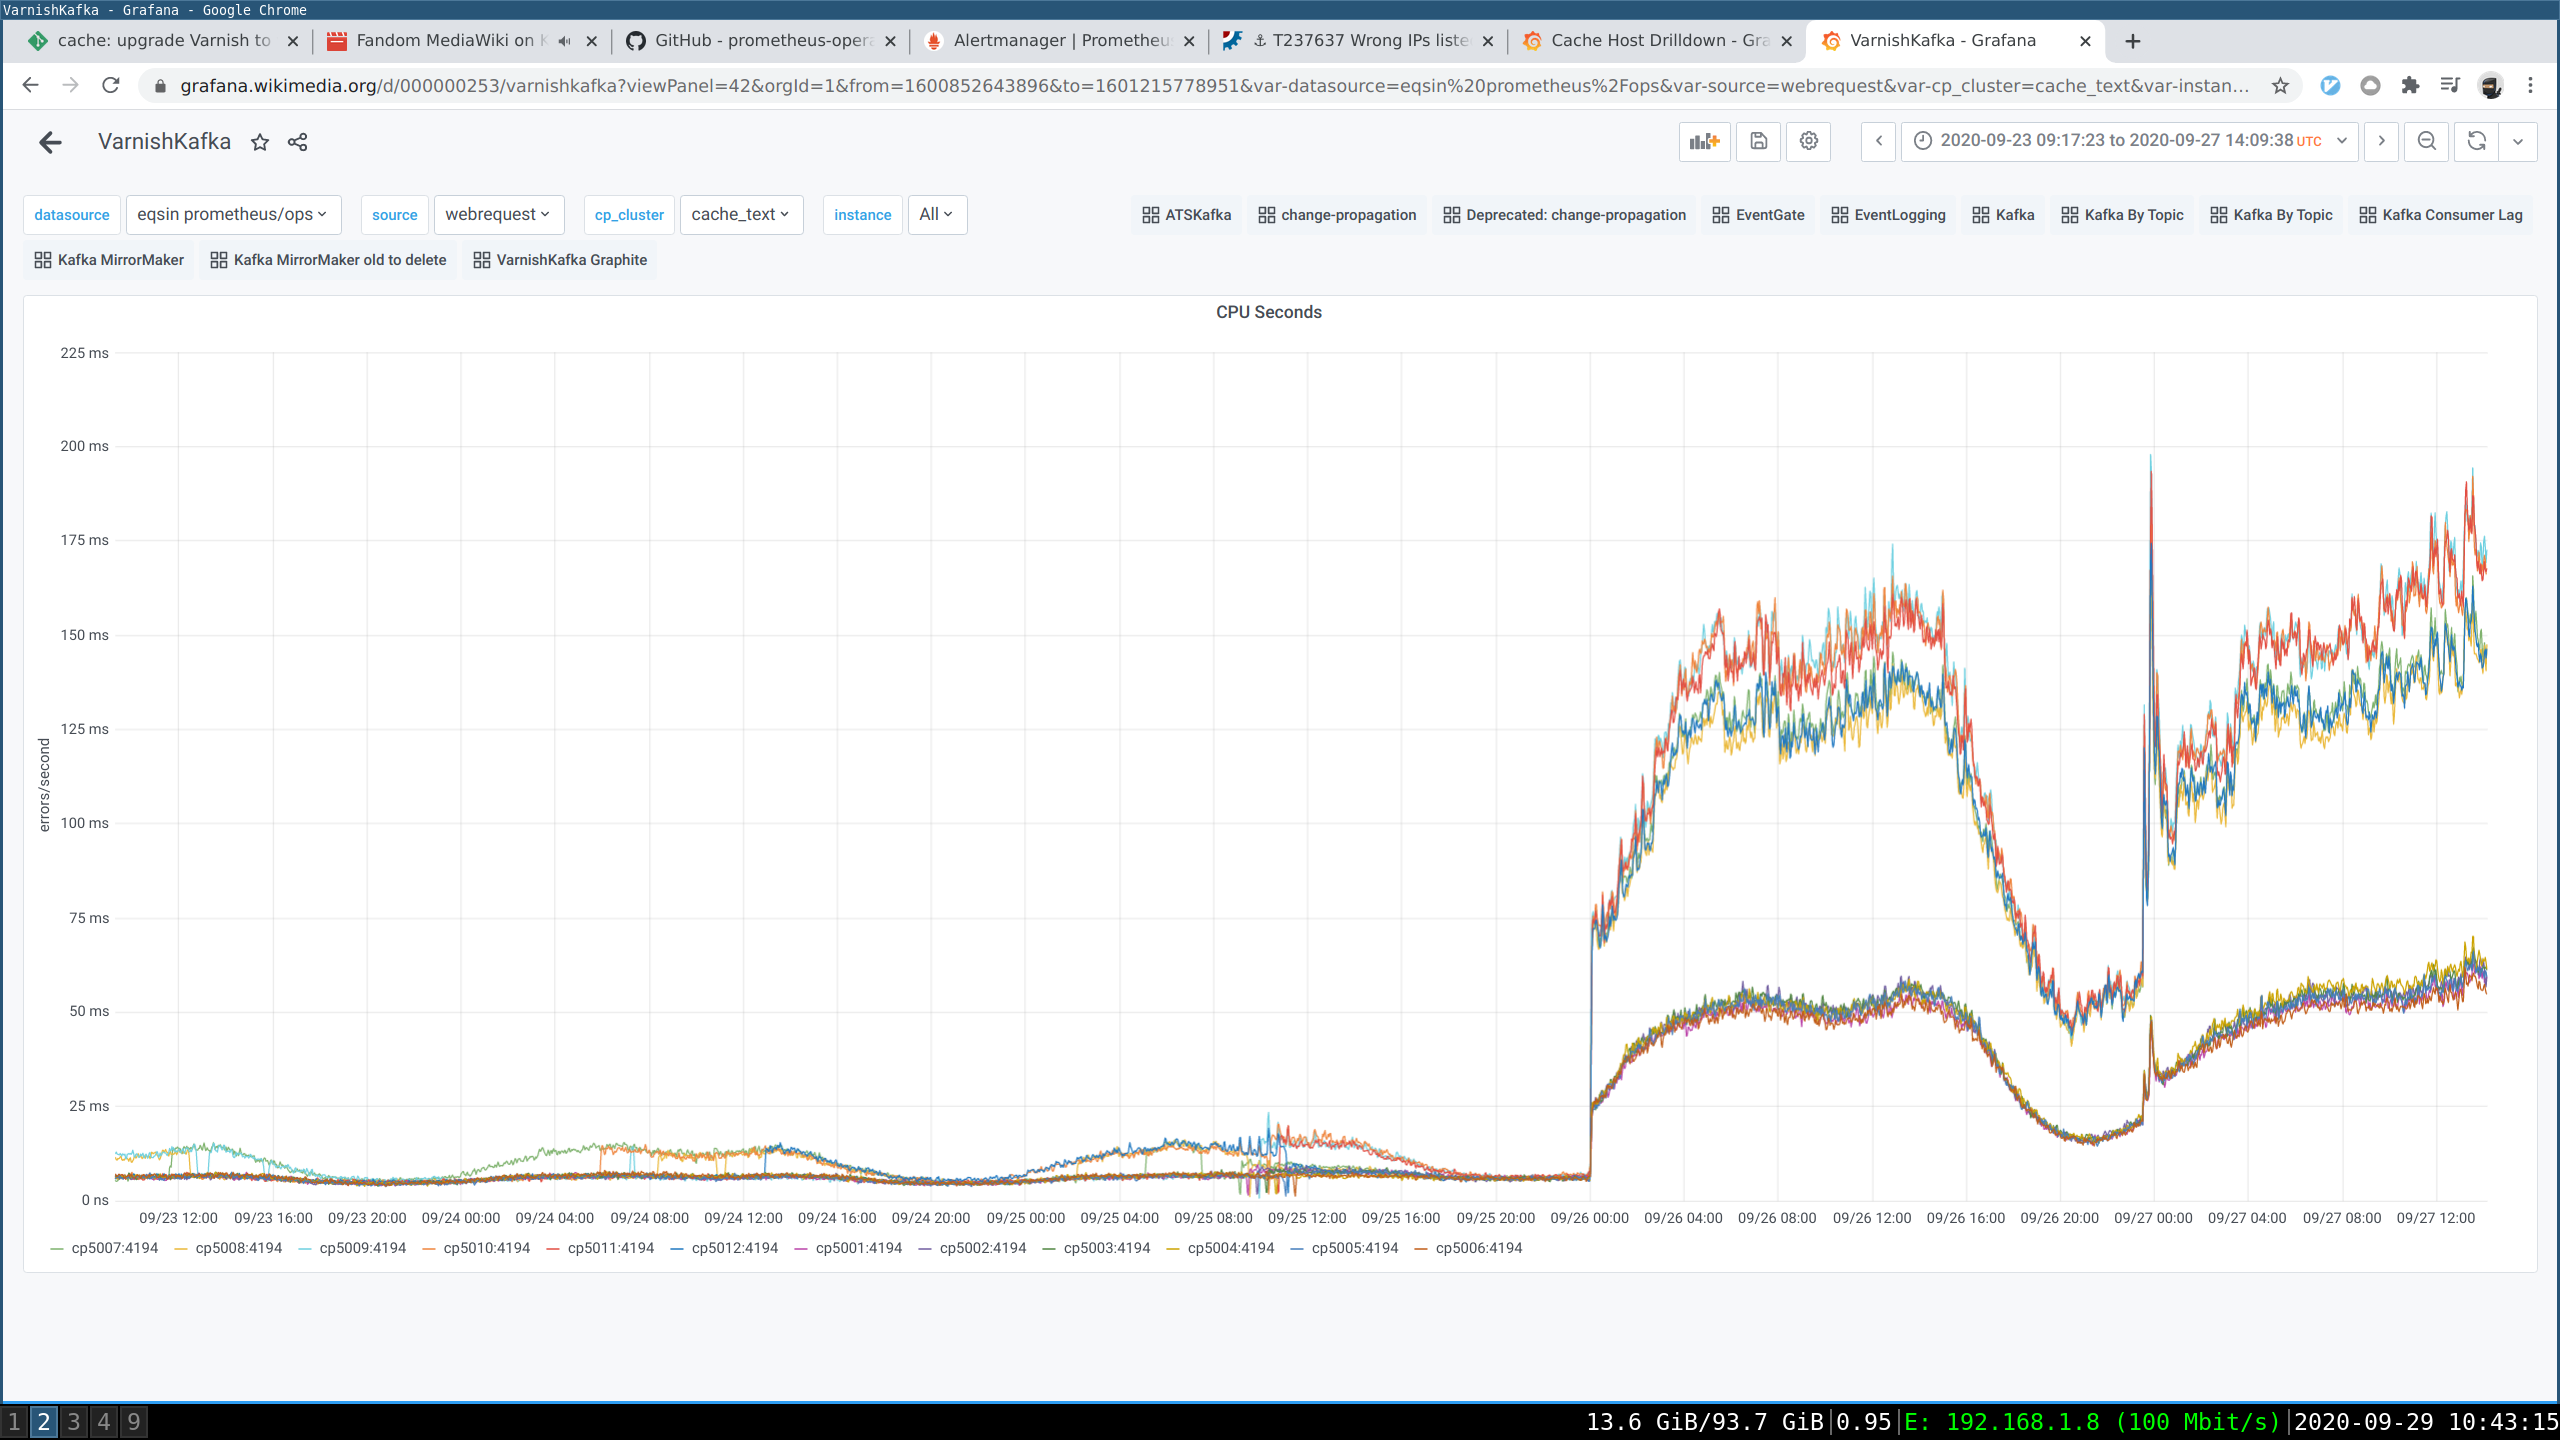
The upgrade from varnishkafka 1.0.14 to 1.1.0, in the context of the migration to Varnish 6 (T263557), resulted in a visible CPU usage increase:

Screenshot from 2020-09-29 10-43-15.png (1×2 px, 462 KB)

This issue is important but not critical given that Analytics is currently working on confirming if the data produced by atskafka is good enough to permanently get rid of varnishkafka so that, among other things, we won't have to deal with this sort of issues anymore.

Event Timeline

Restricted Application added a subscriber: Aklapper. · View Herald Transcript

I also checked with top on cp5011 to better visualize the graph, and the usage is really too much from what I used to see. We are in the process of evaluating atskafka but it will take probably some time to be able to migrate all our traffic to it, I think it is better to know if the increase is brought by the new VUT/VSL api or if it is something else. Maybe we could pick one eqsin cp node and run perf/systemtap/something-else and see if we can get some useful info?

I think it is better to know if the increase is brought by the new VUT/VSL api or if it is something else.

Other units such as varnishmtail.service, which uses varnishncsa, don't show any CPU usage increase. The culprit is thus either something else, or an area of VUT/VSL used by varnishkafka and not by varnishncsa.

https://github.com/wikimedia/varnishkafka/commit/b0675e80c2a059ba3a508d8ebfc16a79bee3e154 shows a big change in usage of VUT/VSL, that afaics should be easier (more responsibilities left to VUT afaics), but it might not be. Let's try to figure out if there are hot code paths (I can set up time to investigate during the next days). Is it ok to run perf or similar on one eqsin node?

herron triaged this task as High priority.Sep 30 2020, 5:23 PM

I am not an expert in perf but I tried to do the following on cp5012: sudo perf record -F 99 -p 29945 --call-graph dwarf sleep 10 (the pid is varnishkafka-webrequest)

And I got:

perf report

  Children      Self  Command         Shared Object           Symbol
-   31.30%     0.00%  varnishkafka    varnishkafka            [.] 0x0000558dba73595c                                                                                                                                                                                                                                                                                       ▒
     0x558dba73595c                                                                                                                                                                                                                                                                                                                                                        ▒
   - VUT_Main                                                                                                                                                                                                                                                                                                                                                              ▒
      - 16.37% VSM_Status                                                                                                                                                                                                                                                                                                                                                  ◆
         + 15.53% vsm_refresh_set                                                                                                                                                                                                                                                                                                                                          ▒
         + 0.84% __fxstat64                                                                                                                                                                                                                                                                                                                                                ▒
      - 14.75% VSLQ_Dispatch                                                                                                                                                                                                                                                                                                                                               ▒
         - 12.73% vslq_process_ready                                                                                                                                                                                                                                                                                                                                       ▒
            + 6.77% vut_dispatch                                                                                                                                                                                                                                                                                                                                           ▒
            + 5.85% vslq_runquery                                                                                                                                                                                                                                                                                                                                          ▒
         + 1.94% vtx_scan                                                                                                                                                                                                                                                                                                                                                  ▒
-   31.30%     0.08%  varnishkafka    libvarnishapi.so.2.0.0  [.] VUT_Main                                                                                                                                                                                                                                                                                                 ▒
   - 31.22% VUT_Main                                                                                                                                                                                                                                                                                                                                                       ▒
      - 16.37% VSM_Status                                                                                                                                                                                                                                                                                                                                                  ▒
         + 15.53% vsm_refresh_set                                                                                                                                                                                                                                                                                                                                          ▒
         + 0.84% __fxstat64                                                                                                                                                                                                                                                                                                                                                ▒
      - 14.75% VSLQ_Dispatch                                                                                                                                                                                                                                                                                                                                               ▒
         + 12.73% vslq_process_ready                                                                                                                                                                                                                                                                                                                                       ▒
         + 1.94% vtx_scan                                                                                                                                                                                                                                                                                                                                                  ▒
-   21.48%     0.00%  varnishkafka    varnishkafka            [.] 0x0000558dba735e09                                                                                                                                                                                                                                                                                       ▒
     0x558dba735e09                                                                                                                                                                                                                                                                                                                                                        ▒
     __libc_start_main                                                                                                                                                                                                                                                                                                                                                     ▒
     0x558dba73595c                                                                                                                                                                                                                                                                                                                                                        ▒
   - VUT_Main                                                                                                                                                                                                                                                                                                                                                              ▒
      - 11.60% VSLQ_Dispatch                                                                                                                                                                                                                                                                                                                                               ▒
         + 10.12% vslq_process_ready                                                                                                                                                                                                                                                                                                                                       ▒
         + 1.48% vtx_scan                                                                                                                                                                                                                                                                                                                                                  ▒
      + 9.78% VSM_Status                                                                                                                                                                                                                                                                                                                                                   ▒
+   21.48%     0.00%  varnishkafka    libc-2.28.so            [.] __libc_start_main                                                                                                                                                                                                                                                                                        ▒
+   16.37%     0.00%  varnishkafka    libvarnishapi.so.2.0.0  [.] VSM_Status                                                                                                                                                                                                                                                                                               ▒
+   15.53%     0.00%  varnishkafka    libvarnishapi.so.2.0.0  [.] vsm_refresh_set                                                                                                                                                                                                                                                                                          ▒
+   14.75%     0.00%  varnishkafka    libvarnishapi.so.2.0.0  [.] VSLQ_Dispatch                                                                                                                                                                                                                                                                                            ▒
+   12.73%     0.11%  varnishkafka    libvarnishapi.so.2.0.0  [.] vslq_process_ready

Most of the usage seems to be VUT related, especially for fxstatat64 (no idea where it is used).

I found https://github.com/varnishcache/varnish-cache/issues/2788 that might be what's happening. The fix is https://github.com/varnishcache/varnish-cache/commit/ed1696efc92cb6a9aa96d2b8e586be8dbbb1736b, backported to 6.1 IIUC (and we have 6.0.6). @ema is there any chance to add this patch to our current package and test if it fixes?

That looks very promising, great find!

@ema is there any chance to add this patch to our current package and test if it fixes?

Definitely, please feel free to go ahead if you have the time.

Definitely, please feel free to go ahead if you have the time.

Implicit but it's probably better to state it clearly: if you do have the time great, if you don't Traffic will find it. :)

yeah.. I'll handle the backport :)

ah snap I didn't check, will do the next time using the gerrit repo. It is not clear to me why we have all those fstat calls though..

Most of the usage seems to be VUT related, especially for fxstatat64 (no idea where it is used).

You are indeed correct. The new varnishkafka using VUT is calling fxstatat, an implementation of fstatat(2), more than 100K times per second on cp3050:

# 26620 is the PID of varnishkafka-webrequest
root@cp3050:~# stap -x 26620 -e 'global c ; probe process("/lib/x86_64-linux-gnu/libc.so.6").function("__fxstatat") { if (pid() == target()) c++ } probe timer.s(1) {println(c) ; c=0}'
103056
104567
106165
105561
96655
^C

The old varnishkafka implementation (no VUT) never calls it:

# 30038 is the PID of varnishkafka-webrequest
root@cp3052:~# stap -x 30038 -e 'global c ; probe process("/lib/x86_64-linux-gnu/libc.so.6").function("__fxstatat") { if (pid() == target()) c++ } probe timer.s(1) {println(c) ; c=0}'
0
0
0
0
^C

The reason is that VUT as currently used by varnishkafka continuously calls VSM_Status, which calls fstat. The following script prints the PIDs calling VSM_Status, and how many times they did it per second. The number of VSM_Status calls does not match the number of fxstatat calls. Perhaps internally fstatat calls fxstatat multiple times? Anyways, that's a detail.

root@cp3050:~# stap -e 'global c 
> probe process("/usr/lib/x86_64-linux-gnu/libvarnishapi.so.2").function("VSM_Status") {
>   c[pid()]++
> }
> probe timer.s(1) {
>   foreach (p in c-) { 
>     printf("%d: %d\n", p, c[p])
>   }
>   delete c
>   println("---")
> }'
26709: 21046
26620: 16935
44201: 83
2279: 83
26831: 82
26765: 73
22978: 66
---
26709: 22876
26620: 17944
26831: 92
44201: 92
2279: 91
26765: 82
22978: 82
---
26709: 25969
26620: 17514
2279: 93
26831: 93
44201: 93
22978: 84
26765: 83

The PIDs above are:

26620varnishkafka-webrequest
26709varnishkafka-eventlogging
2279vanrishkafka-statsv
26831varnishfetcherr's varnishlog
22978varnishmtail's varnishncsa

Note that varnishlog and varnishncsa, also using VUT, behave much better than varnishkafka. In particular, the varnishncsa instance used by varnishmtail is processing the same amount of requests that varnishkafka does (there's no -q):

root     22978 11.8  0.0  89132 87004 ?        S    Oct06 1001:50  \_ /usr/bin/varnishncsa -P /run/varnishncsa-mtail.pid -n frontend -c -b -F side %{Varnish:side}x\turl %U\tcache_status %{X-Cache-Status}o\thttp_status %s\thttp_method %m\tcache_control %{Cache-Control}o\tinm %{If-None-Match}i\tttfb %{Varnish:time_firstbyte}x\tcache_int %{X-Cache-Int}o\t

And yet it calls fxstatat ~ 300 times per second instead of 100K:

root@cp3050:~# stap -x 22978 -e 'global c ; probe process("/lib/x86_64-linux-gnu/libc.so.6").function("__fxstatat") { if (pid() == target()) c++ } probe timer.s(1) {println(c) ; c=0}'
304
344
340
340
^C

So yeah, we need to find out what's wrong with varnishkafka's usage of VUT compared to varnishncsa.

Thanks Ema, really great analysis! I am wondering if we could quickly test how varnishncsa behaves when we pass -q, that seems to be the big difference between the two. I skimmed quickly in the code but I don't see anything really outstanding, VUT usage is basically setting callbacks and then nothing more. If the problem is not the query parameter, we could try to dive deep into the code and see.

I am wondering if we could quickly test how varnishncsa behaves when we pass -q, that seems to be the big difference between the two.

We do have daemons using -q, such as for example varnishlog as invoked by varnish-frontend-slowlog.service:

/usr/bin/varnishlog -q 'ReqMethod ne "PURGE" and (Timestamp:Start[3] > 60.000000 or Timestamp:Req[3] > 60.000000 or Timestamp:ReqBody[3] > 60.000000 or Timestamp:Waitinglist[3] > 60.000000 or Timestamp:Fetch[3] > 60.000000 or Timestamp:Process[3] > 60.000000 or Timestamp:Restart[3] > 60.000000)' -T 600 -n frontend

That's currently PID 26765 on cp3050, and it is calling fxstatat ~300 times per second:

root@cp3050:~# stap -x 26765 -e 'global c ; probe process("/lib/x86_64-linux-gnu/libc.so.6").function("__fxstatat") { if (pid() == target()) c++ } probe timer.s(1) {println(c) ; c=0}'
328
332
332
^C

There is another test that we could do, namely grouping. As far as I can see in the varnishkafka change, the grouping for request seems not preserved, ending up in defaulting to call transaction_scribe for every transaction. I don't see -g request set for the varnishncsa case, maybe -b is enough? Anyway, doing another test with/without -g request may be enough to see if there is a big difference or not.

The function VUT_Main is the main loop of VUT programs. The while loop boils down to:

while {
  // things [...]
  VUT_Status() // <- this calls fstat multiple times
  do {
    i = VSLQ_Dispatch(your_callback) // <- your_callback is where program logic resides
  } while (i == vsl_more)
  // other things   
}

I've been looking at how many times varnishkafka and varnishncsa call both VSM_Status and VSLQ_Dispatch per second. PID 26620 is varnishkafka, and PID 34439 is varnishncsa.

global c

probe process("/usr/lib/x86_64-linux-gnu/libvarnishapi.so.2.0.0").function("VSLQ_Dispatch") {
        if (pid() == 26620) { c["varnishkafka","VSLQ_Dispatch"]++ }

        if (pid() == 34439) { c["varnishncsa","VSLQ_Dispatch"]++ }
}

probe process("/usr/lib/x86_64-linux-gnu/libvarnishapi.so.2.0.0").function("VSM_Status") {
        if (pid() == 26620) { c["varnishkafka","VSM_Status"]++ }

        if (pid() == 34439) { c["varnishncsa","VSM_Status"]++ }
}

probe timer.s(1) {
        foreach ([program,f] in c) {
                printf("%s %s: %d\n", program, f, c[program,f])
        }
        println("---")
        delete c
}

Here's the results for three seconds of tracing:

VSLQ_DispatchVSM_Status
varnishkafka76427642
varnishncsa3176554
VSLQ_DispatchVSM_Status
varnishkafka79187918
varnishncsa3382274
VSLQ_DispatchVSM_Status
varnishkafka89168916
varnishncsa3156176

My guess thus was that varnishncsa's VSLQ_Dispatch calls would return vsl_more most of the time, while varnishkafka's would return 0. Tracing the return values of VSLQ_Dispatch for both processes is clear that that is not the case:

global c

probe process("/usr/lib/x86_64-linux-gnu/libvarnishapi.so.2.0.0").function("VSLQ_Dispatch").return {
        if (pid() == 26620 || pid() == 34439)
                c[pid(),$return]++
}

probe timer.s(1) {
        foreach ([program,ret] in c) {
                printf("%d %d: %d\n", program, ret, c[program,ret])
        }

        println("---")
}
return 0return 1
varnishkafka118524
varnishncsa11318524

So varnishkafka seems to be correctly looping continuously in the do-while part of VUT_Main. Why is VSM_Status being called so often remains an open question.

Change 633696 had a related patch set uploaded (by Elukey; owner: Elukey):
[operations/software/varnish/varnishkafka@master] Set VUT grouping parameter to 'request' by default

https://gerrit.wikimedia.org/r/633696

Mentioned in SAL (#wikimedia-operations) [2020-10-13T09:32:39Z] <ema> cp3050: set grouping by request (vut->g_arg = 2) on varnishkafka-webrequest T264074

Mentioned in SAL (#wikimedia-operations) [2020-10-13T09:51:37Z] <ema> cp3052: systemctl restart varnishkafka-webrequest.service T264074

Mentioned in SAL (#wikimedia-operations) [2020-10-13T09:55:30Z] <ema> cp3054: systemctl restart varnishkafka-webrequest.service T264074

Mentioned in SAL (#wikimedia-operations) [2020-10-13T10:09:22Z] <ema> cp3050: *reload* varnishkafka-webrequest T264074

Mentioned in SAL (#wikimedia-operations) [2020-10-13T10:19:24Z] <ema> cp3050: clear varnishkafka-webrequest's vut->sighup via stap T264074

So varnishkafka seems to be correctly looping continuously in the do-while part of VUT_Main. Why is VSM_Status being called so often remains an open question.

The do-while part which I've simplified in my head, and thus on this task, as while (i == vsl_more) actually looks like this: while (i == vsl_more && !vut->sighup && !vut->sigusr1);

When we send HUP to varnishkafka by means of systemctl reload, vut->sighup is set by VUT_Signaled. This makes the do-while condition false, which makes varnishkafka leave the do-while loop. The code in VUT_Main responsible for resetting vut->sighup looks like this:

if (vut->sighup && vut->sighup_f) {
	/* sighup callback */
	vut->sighup = 0;
	i = vut->sighup_f(vut);

Given that in varnishkafka we don't define sighup_f, the value of vut->sighup is never set back to 0. For this reason, after we send the first HUP signal, varnishkafka begins executing one VSM_Setup call after each VSLQ_Dispatch (in other words: the do-while loop always runs one single time from that point onwards), making the patch addressing varnish issue 2788 useless.

Other tools like varnishncsa do set sighup_f and are thus not affected by this bug.

Transitioning the task to Ema since he is following up with upstream to patch Varnish :)

I've opened https://github.com/varnishcache/varnish-cache/issues/3436 for 6.5/master, https://github.com/varnishcache/varnish-cache/issues/3437 for 6.0.6 (LTS), and proposed https://github.com/varnishcache/varnish-cache/pull/3438 as a fix for the latter.

The next steps are:

  • applying the patch to our varnish package
  • deploying it on cp3050, restarting varnishkafka-webrequest to pick the updated libvarnishapi2
  • reloading varnishkafka-webrequest and making sure that CPU usage stays the same

Change 634018 had a related patch set uploaded (by Ema; owner: Ema):
[operations/debs/varnish4@debian-wmf] 6.0.6-1wm2: clear vut->sighup even if sighup_f is not defined

https://gerrit.wikimedia.org/r/634018

Mentioned in SAL (#wikimedia-traffic) [2020-10-15T14:11:15Z] <ema> cp3050: upgrade varnish to 6.0.6-1wm2 T264074

Mentioned in SAL (#wikimedia-traffic) [2020-10-15T14:12:50Z] <ema> cp3050: restart varnishkafka-webrequest w/ libvarnishapi2 6.0.6-1wm2 T264074

Mentioned in SAL (#wikimedia-traffic) [2020-10-15T14:21:18Z] <ema> cp3050: systemctl reload varnishkafka-webrequest.service T264074

Change 634018 merged by Ema:
[operations/debs/varnish4@debian-wmf] 6.0.6-1wm2: clear vut->sighup even if sighup_f is not defined

https://gerrit.wikimedia.org/r/634018

I've upgraded cp3050 to 6.0.6-1wm2 and restarted varnishkafka-webrequest.service at 14:12 to pick up the new library. Varnishkafka's CPU usage went down immediately as expected. I've then reloaded the service at 14:21: on systems affected by this bug that would have resulted in CPU usage going back up. On cp3050 CPU usage stayed the same.

Screenshot from 2020-10-15 16-31-37.png (1×2 px, 158 KB)

I'll shortly upload varnish 6.0.6-1wm2 to apt.wikimedia.org, tomorrow we can proceed with the upgrades.

Mentioned in SAL (#wikimedia-operations) [2020-10-15T14:41:14Z] <ema> varnish 6.0.6-1wm2 uploaded to apt.wikimedia.org component/varnish6 T264074

Change 634245 had a related patch set uploaded (by Ema; owner: Ema):
[operations/puppet@production] varnish: add SystemTap script to trace VSM_Status/VSLQ_Dispatch

https://gerrit.wikimedia.org/r/634245

Change 634245 merged by Ema:
[operations/puppet@production] varnish: add SystemTap script to trace VSM_Status/VSLQ_Dispatch

https://gerrit.wikimedia.org/r/634245

Change 634461 had a related patch set uploaded (by Ema; owner: Ema):
[operations/puppet@production] varnish: do not install -dbg package

https://gerrit.wikimedia.org/r/634461

Change 634461 merged by Ema:
[operations/puppet@production] varnish: do not install -dbg package

https://gerrit.wikimedia.org/r/634461

Mentioned in SAL (#wikimedia-operations) [2020-10-16T07:59:04Z] <ema> text@ulsfo: upgrade varnish to 6.0.6-1wm2, restart varnishkafka instances T264074

Mentioned in SAL (#wikimedia-operations) [2020-10-16T08:08:59Z] <ema> upload@ulsfo: upgrade varnish to 6.0.6-1wm2, restart varnishkafka-webrequest T264074

Mentioned in SAL (#wikimedia-operations) [2020-10-16T08:24:19Z] <ema> text@eqiad: upgrade varnish to 6.0.6-1wm2, restart varnishkafka instances T264074

Mentioned in SAL (#wikimedia-operations) [2020-10-16T08:29:57Z] <ema> upload@eqiad: upgrade varnish to 6.0.6-1wm2, restart varnishkafka-webrequest T264074

Mentioned in SAL (#wikimedia-operations) [2020-10-16T08:48:50Z] <ema> text@codfw: upgrade varnish to 6.0.6-1wm2, restart varnishkafka instances T264074

Mentioned in SAL (#wikimedia-operations) [2020-10-16T08:53:50Z] <ema> upload@codfw: upgrade varnish to 6.0.6-1wm2, restart varnishkafka-webrequest T264074

Mentioned in SAL (#wikimedia-operations) [2020-10-16T09:01:22Z] <ema> text@eqsin: upgrade varnish to 6.0.6-1wm2, restart varnishkafka instances T264074

Mentioned in SAL (#wikimedia-operations) [2020-10-16T09:08:24Z] <ema> upload@eqsin: upgrade varnish to 6.0.6-1wm2, restart varnishkafka-webrequest T264074

Mentioned in SAL (#wikimedia-operations) [2020-10-16T09:19:35Z] <ema> upload@esams: upgrade varnish to 6.0.6-1wm2, restart varnishkafka-webrequest T264074

Mentioned in SAL (#wikimedia-operations) [2020-10-16T09:23:56Z] <ema> text@esams (except for cp3050/cp3052): upgrade varnish to 6.0.6-1wm2, restart varnishkafka instances T264074

All varnishkafka instances restarted with 6.0.6-1wm2, CPU usage looks like this now:

Screenshot from 2020-10-16 11-27-08.png (1×2 px, 434 KB)

Closing.

Change 633696 merged by Elukey:
[operations/software/varnish/varnishkafka@master] Add the possibility to set the VSL grouping option

https://gerrit.wikimedia.org/r/633696