Page MenuHomePhabricator

8-10% response start regression (Varnish 5.1.3-1wm15 -> 6.0.6-1wm1)
Closed, ResolvedPublic

Description

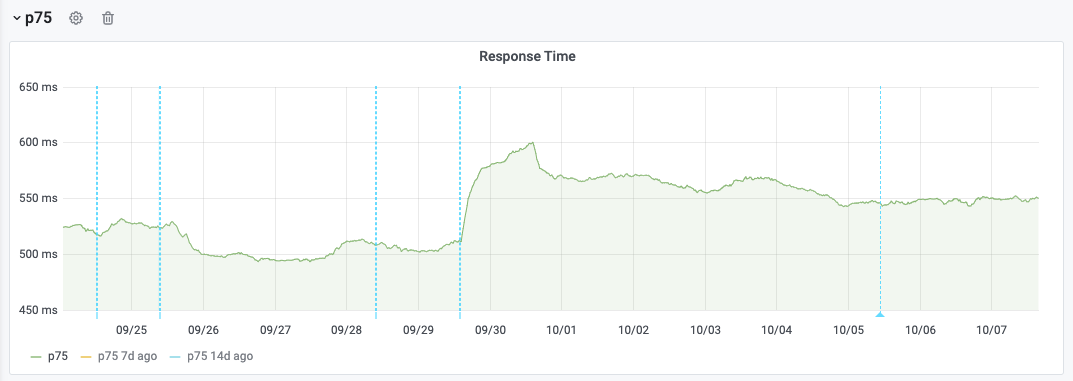
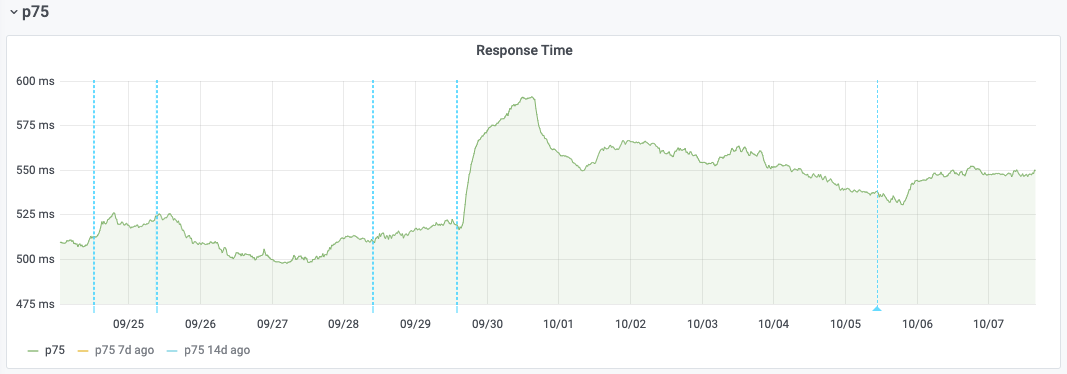
After seeing strong time-correlation between the response start regression and the rollout of Varnish 6 per DC for Eqsin on 2020-09-25:

Screenshot 2020-10-07 at 16.50.02.png (397×1 px, 75 KB)

And for Esams on 2020-09-29:

Screenshot 2020-10-07 at 16.49.32.png (394×1 px, 75 KB)

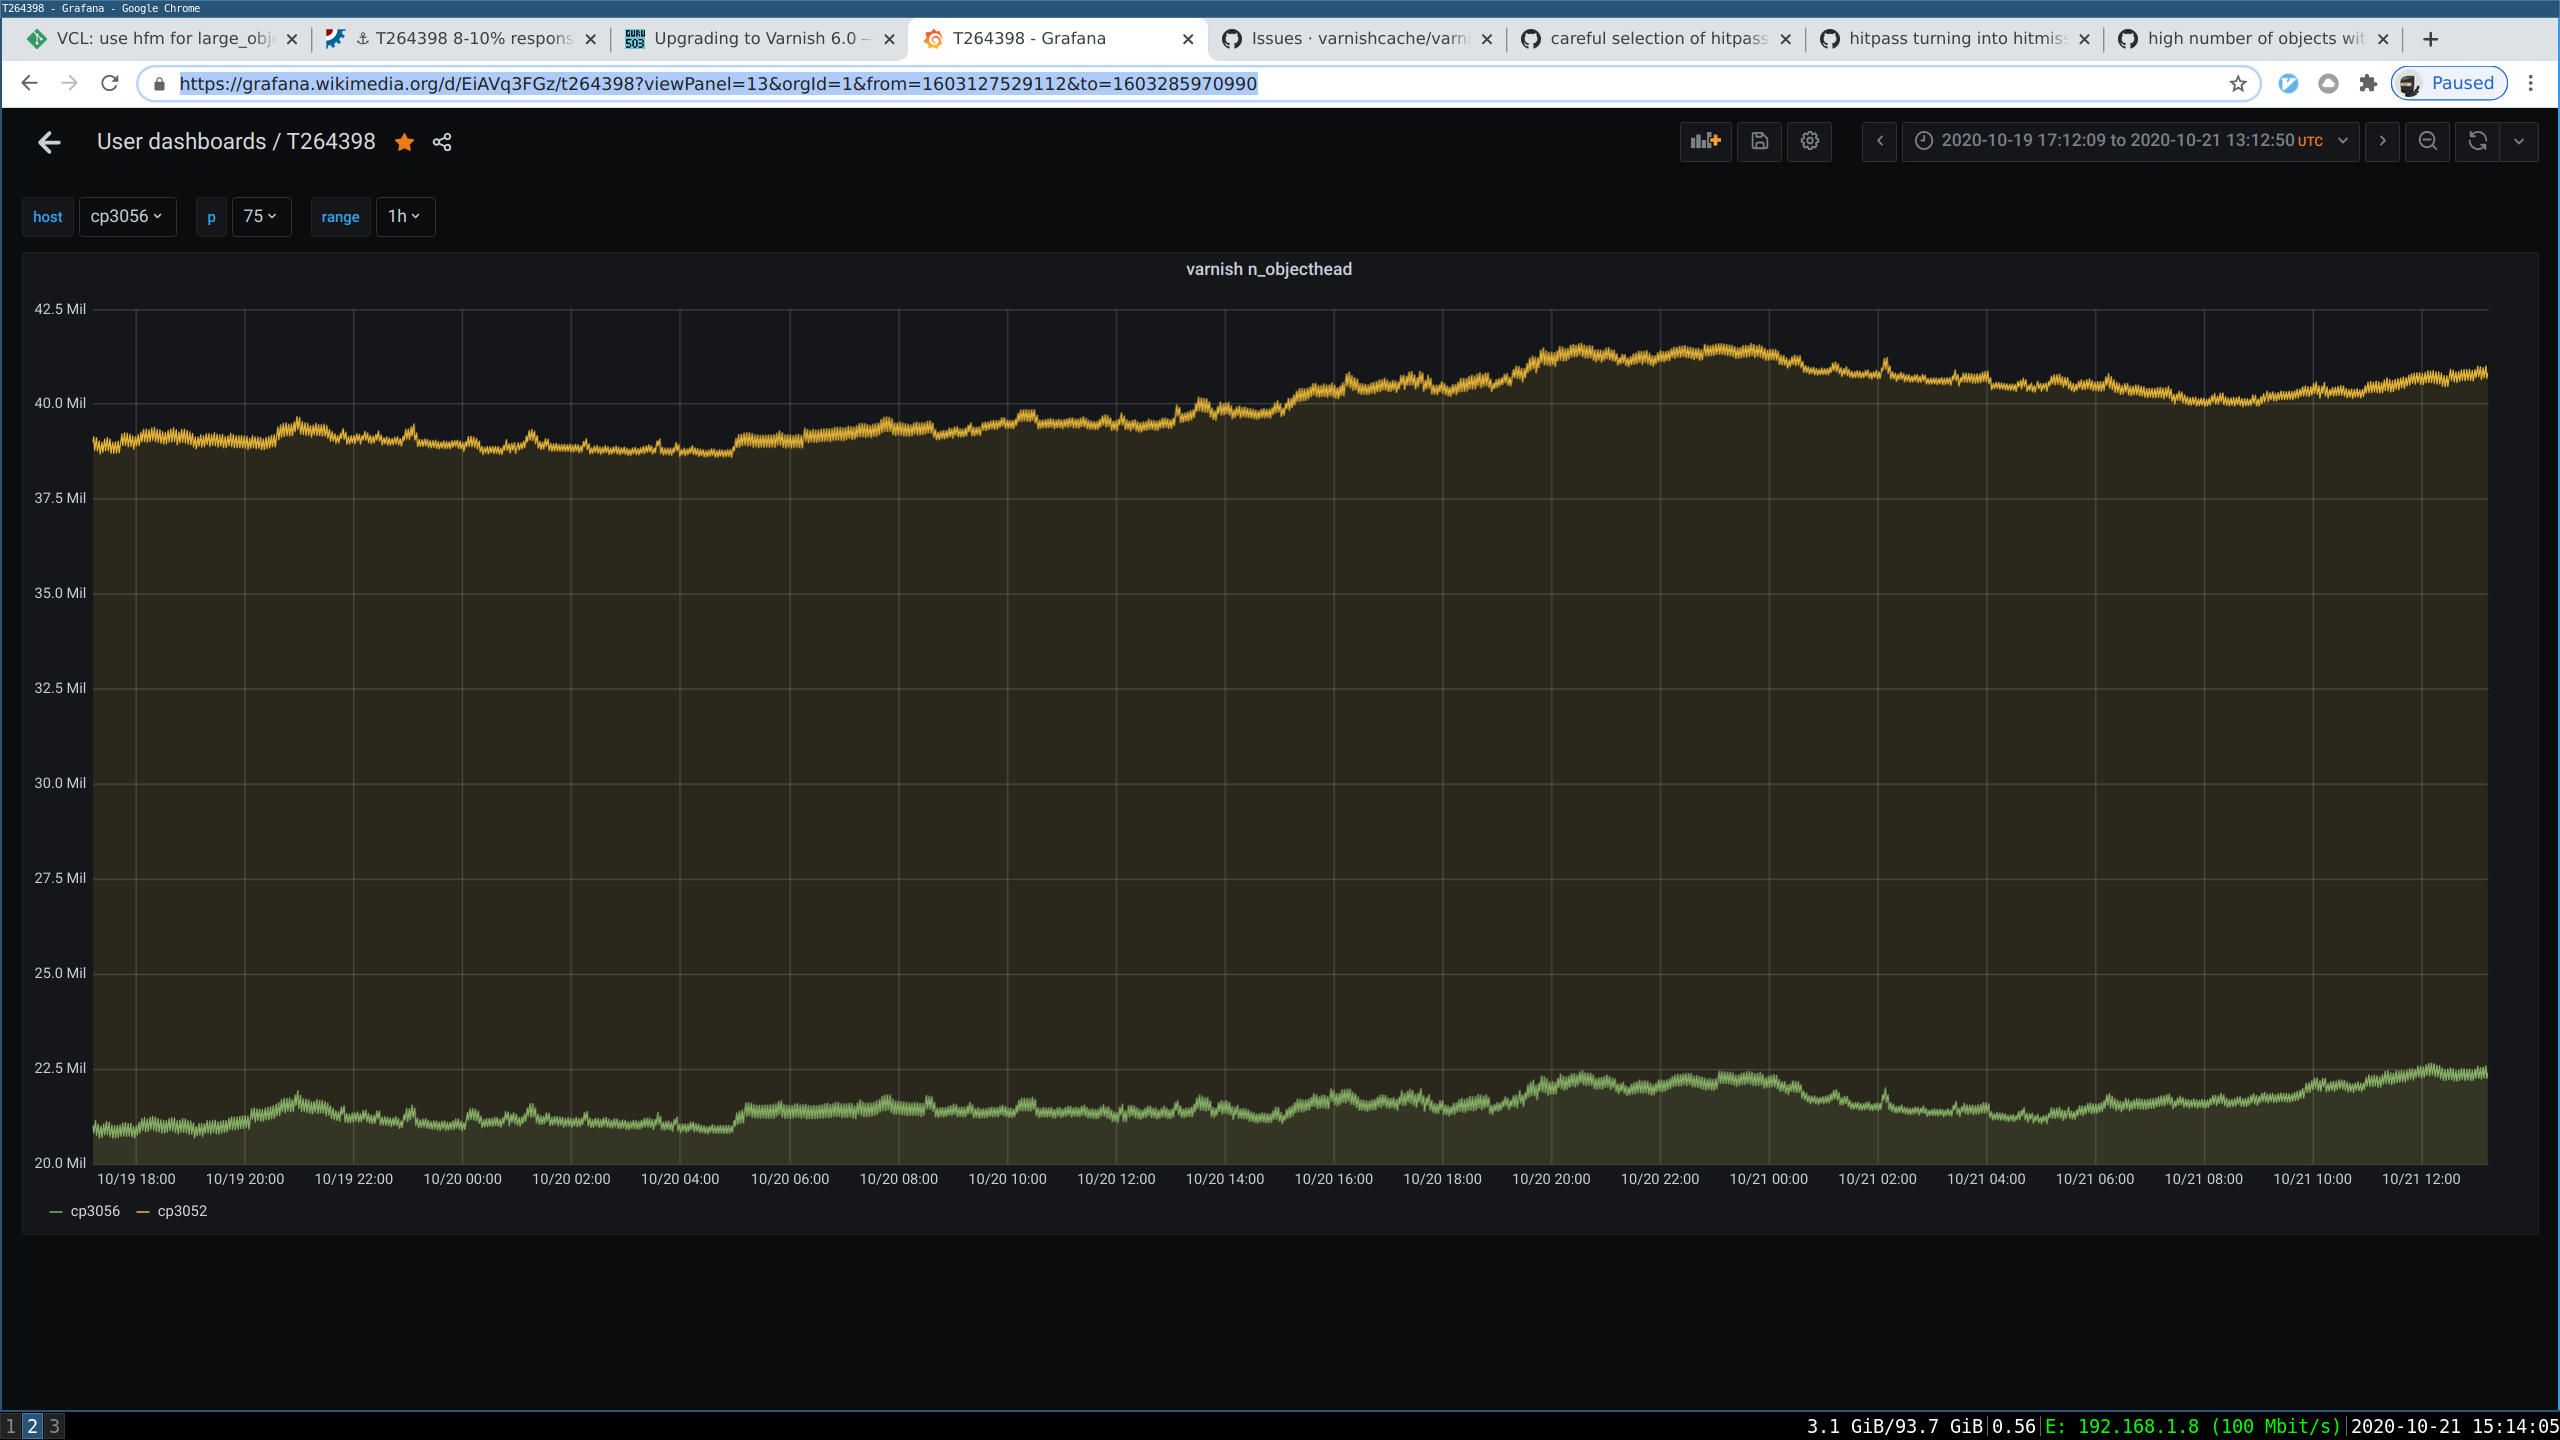
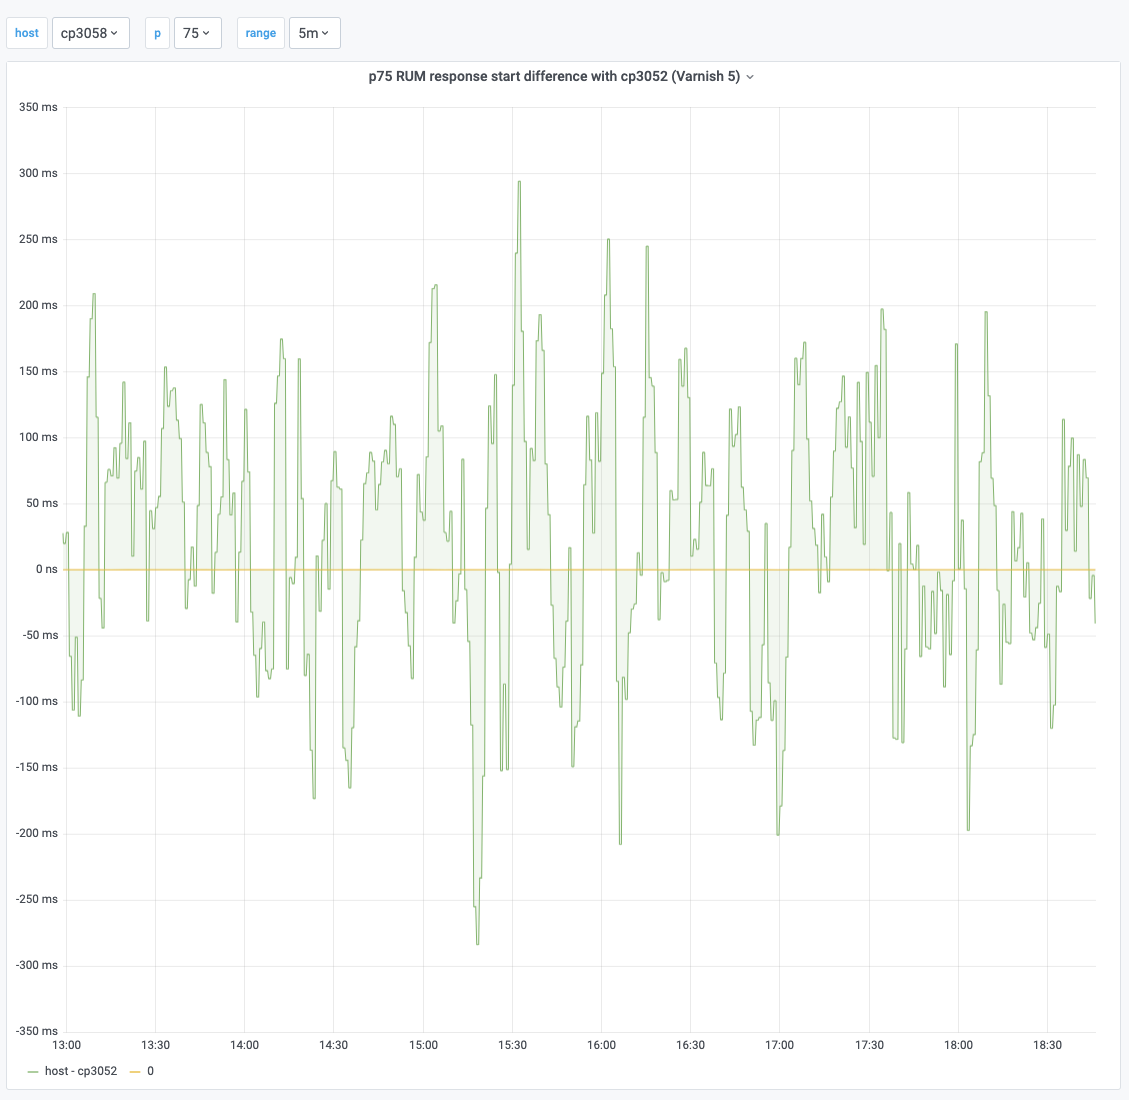
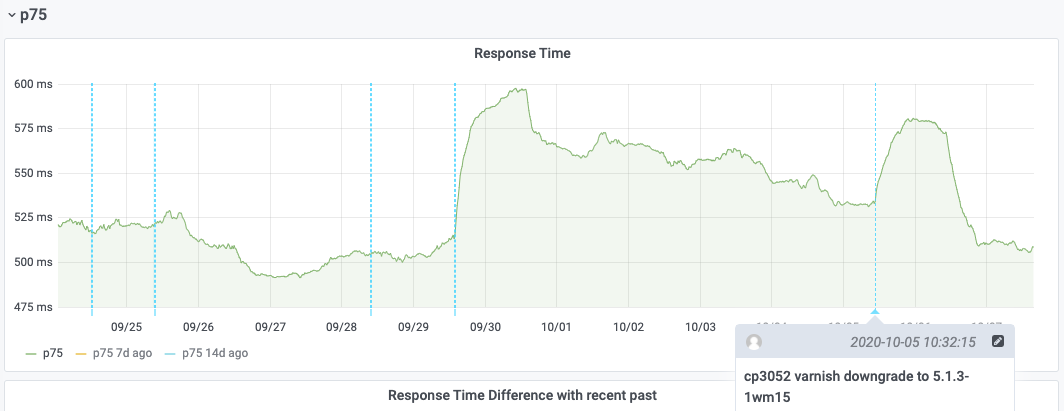
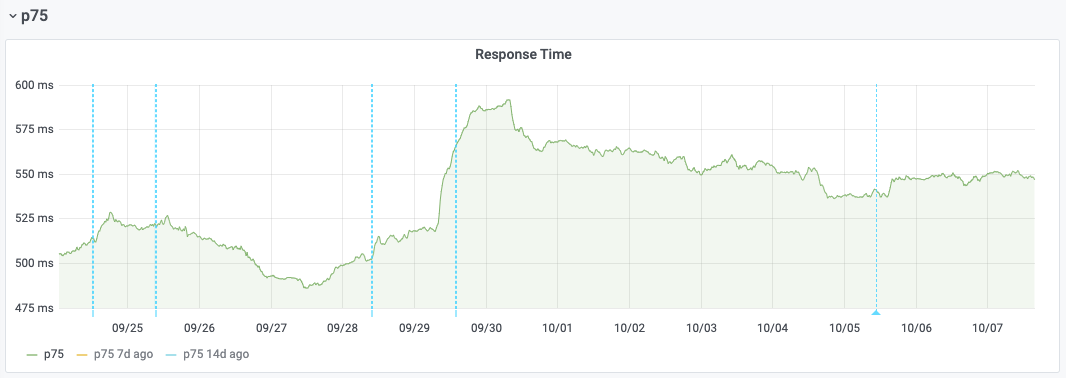
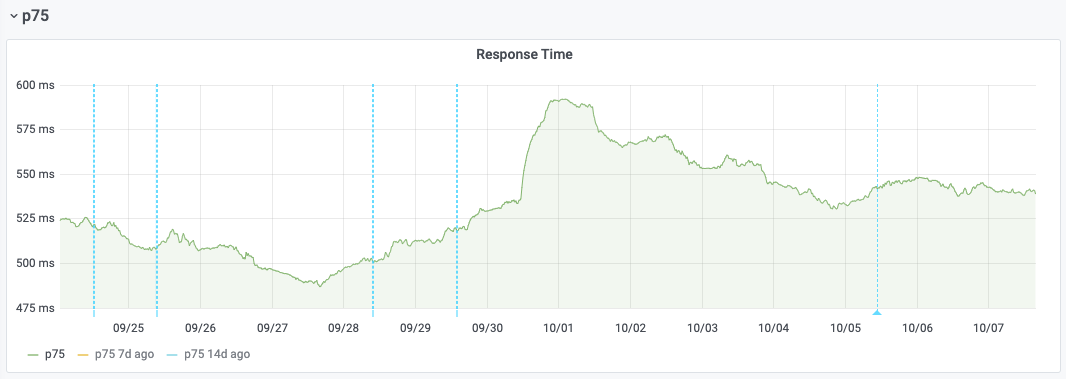
Varnish was rolled back to its previous version on 2020-10-05 on Esams host cp3052. Once the cache populated again, we can see that response start performance goes back to its pre-upgrade levels:

Screenshot 2020-10-07 at 17.55.29.png (411×1 px, 64 KB)

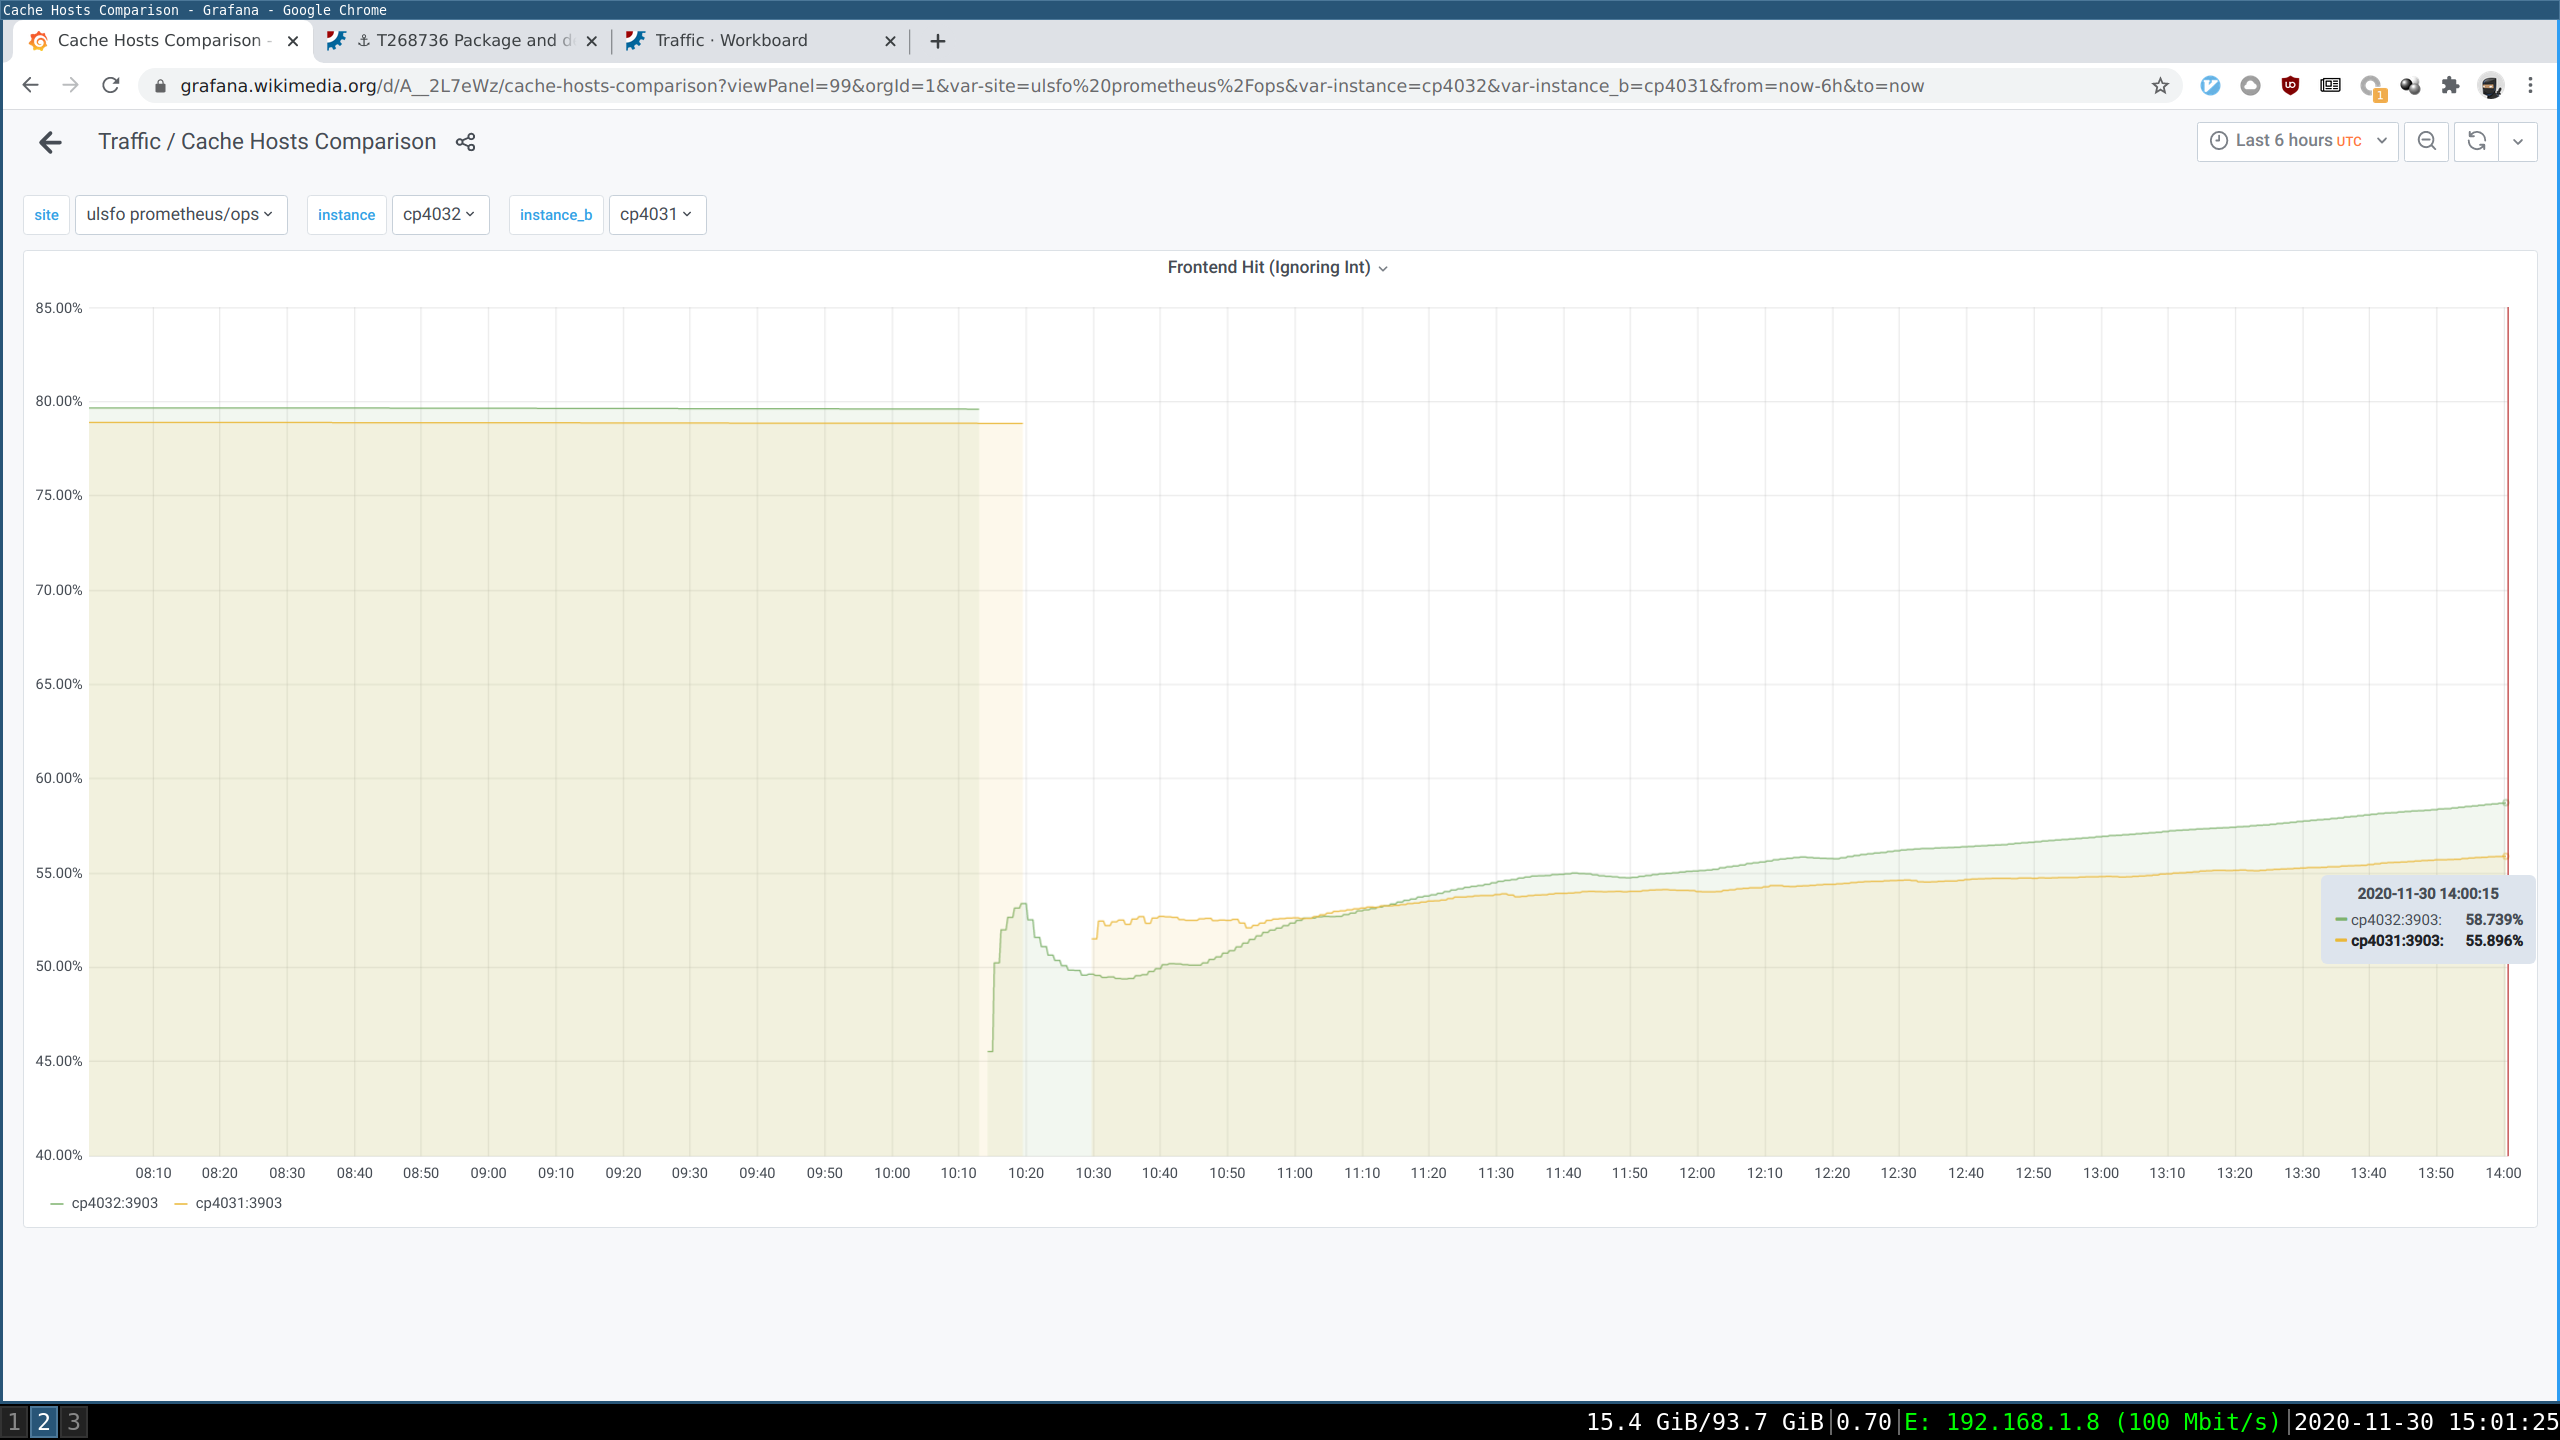
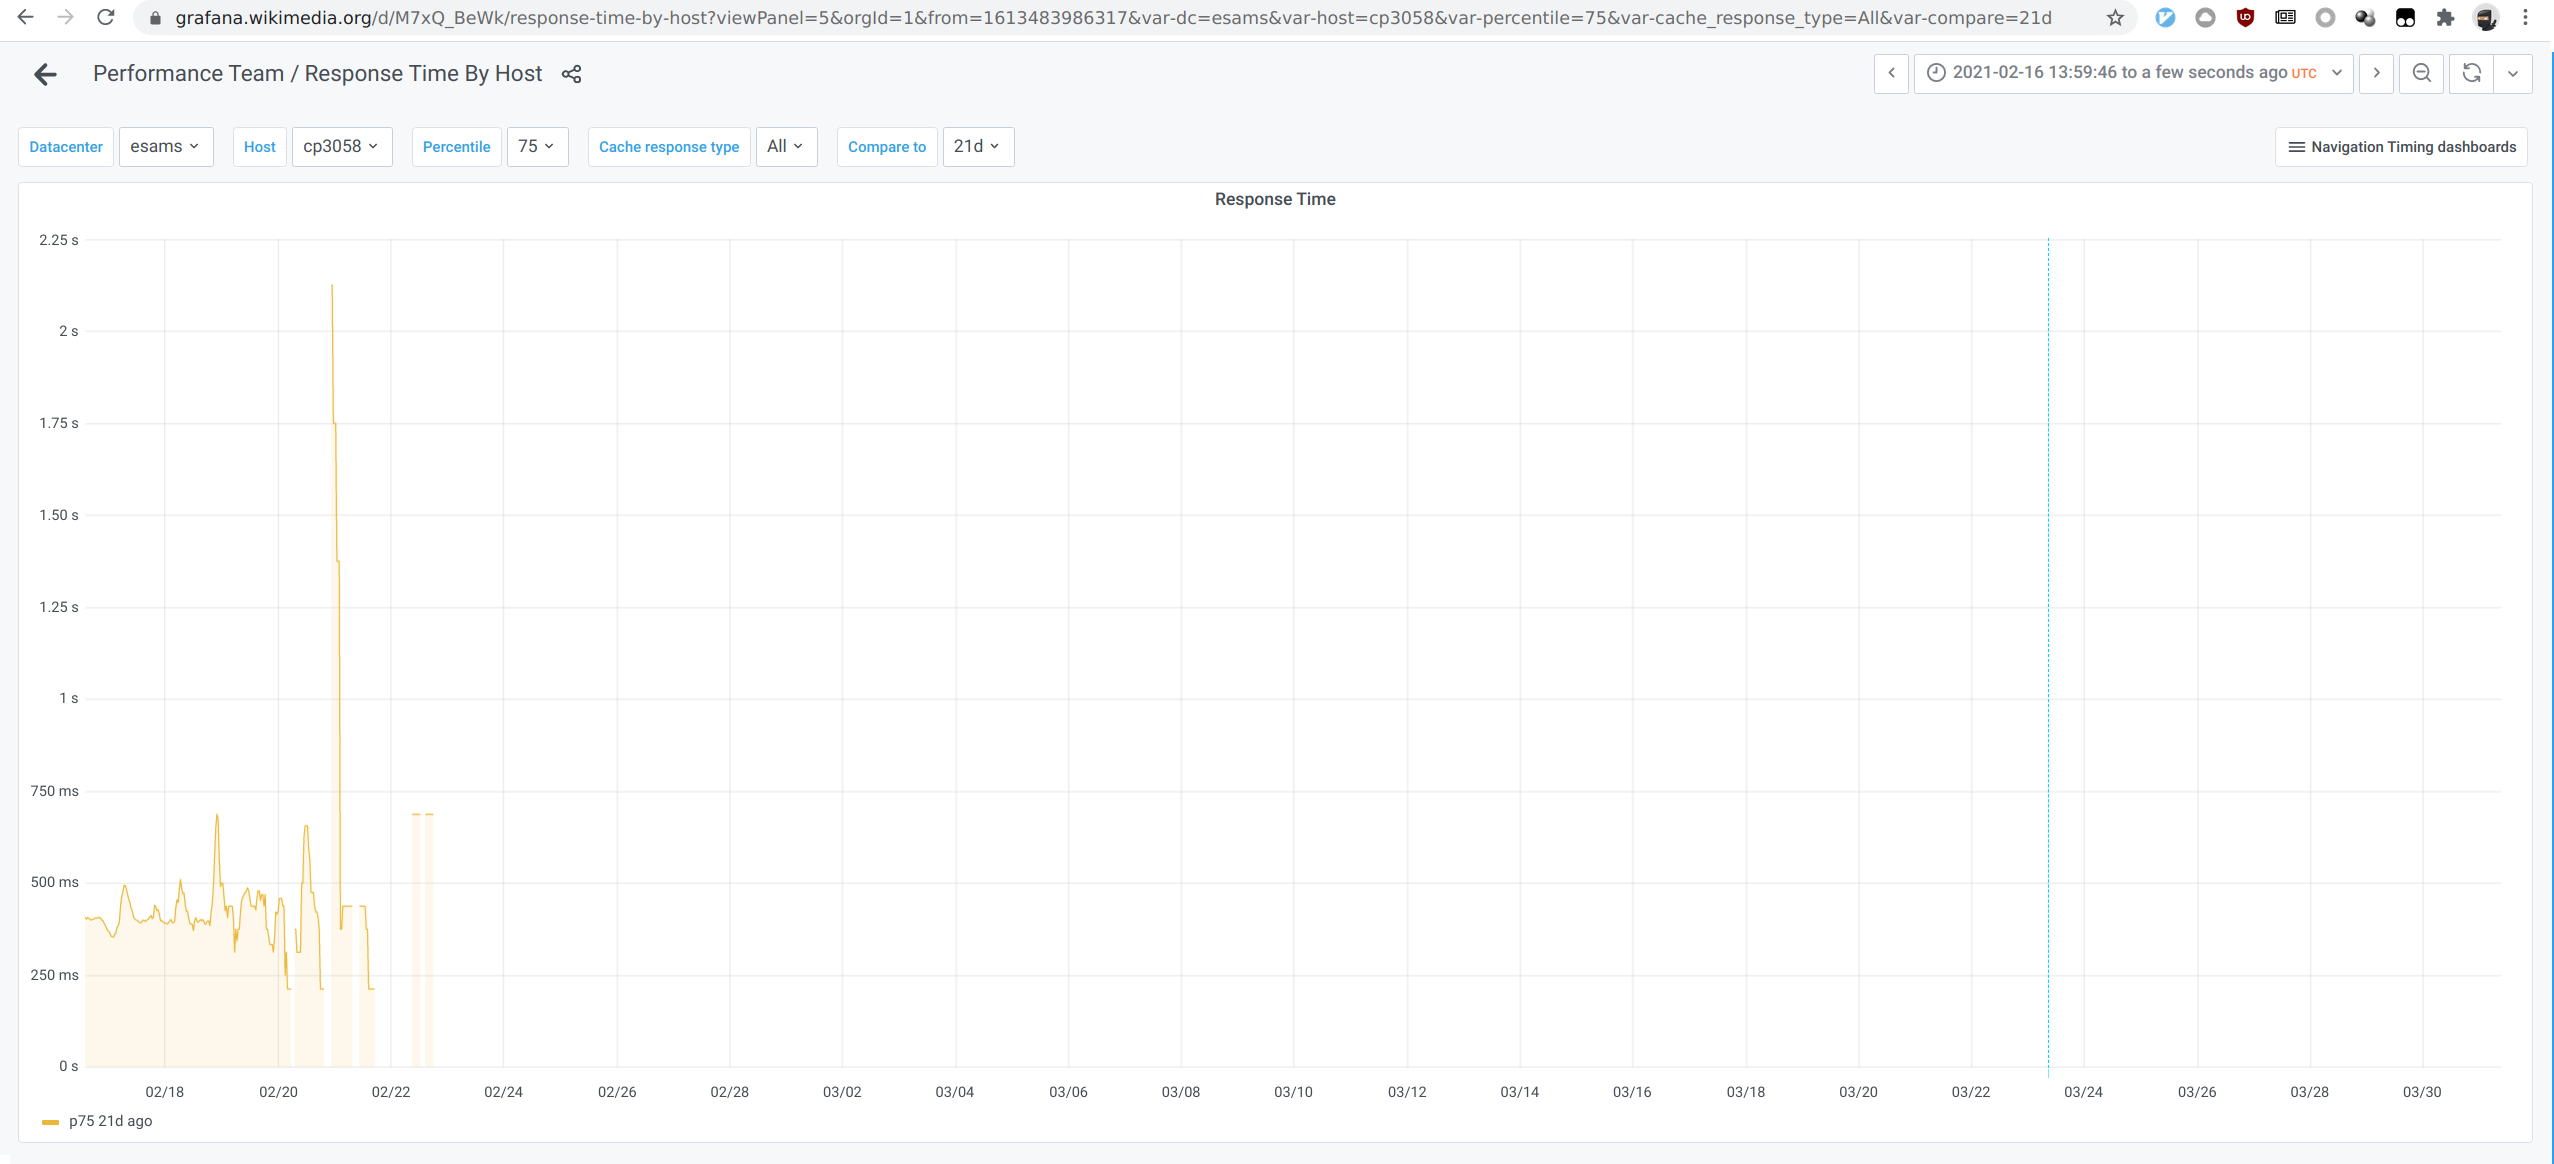
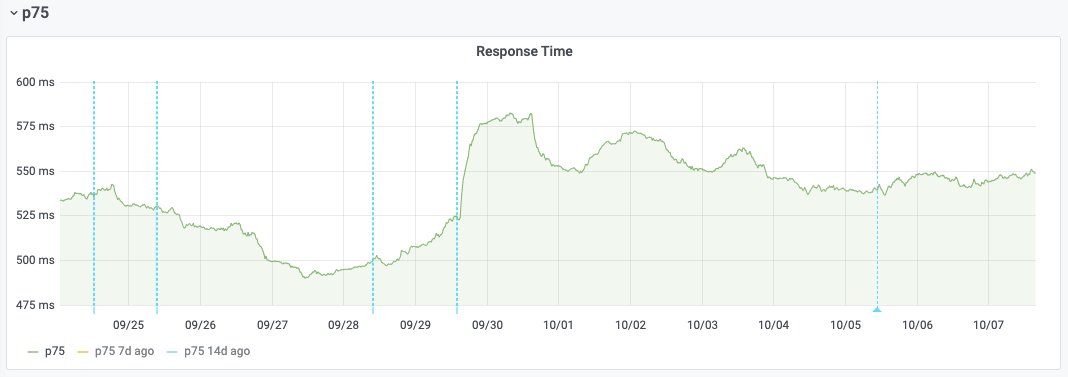
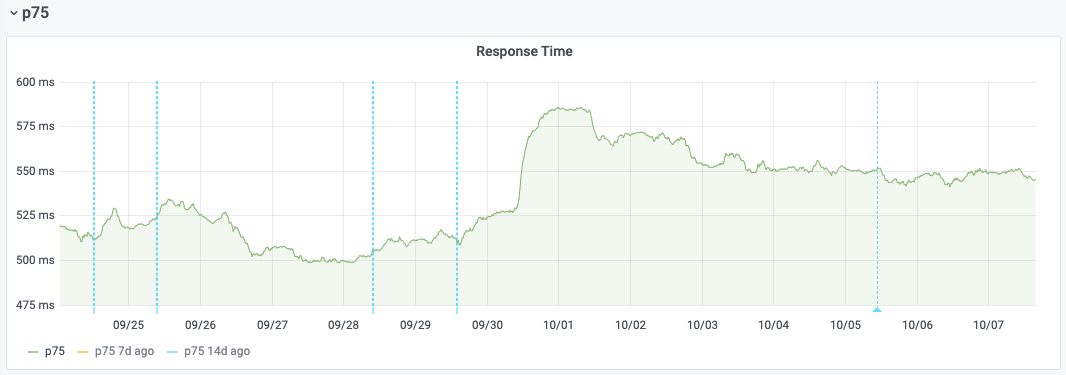
Which isn't the case for the rest of Esams hosts, which were not rolled back and whose response start stayed elevated:

Screenshot 2020-10-07 at 17.57.06.png (378×1 px, 49 KB)

Screenshot 2020-10-07 at 17.57.41.png (375×1 px, 49 KB)

Screenshot 2020-10-07 at 17.57.34.png (377×1 px, 49 KB)

Screenshot 2020-10-07 at 17.57.26.png (381×1 px, 46 KB)

Screenshot 2020-10-07 at 17.57.48.png (374×1 px, 49 KB)

Screenshot 2020-10-07 at 17.58.02.png (379×1 px, 49 KB)

Screenshot 2020-10-07 at 17.57.55.png (375×1 px, 49 KB)

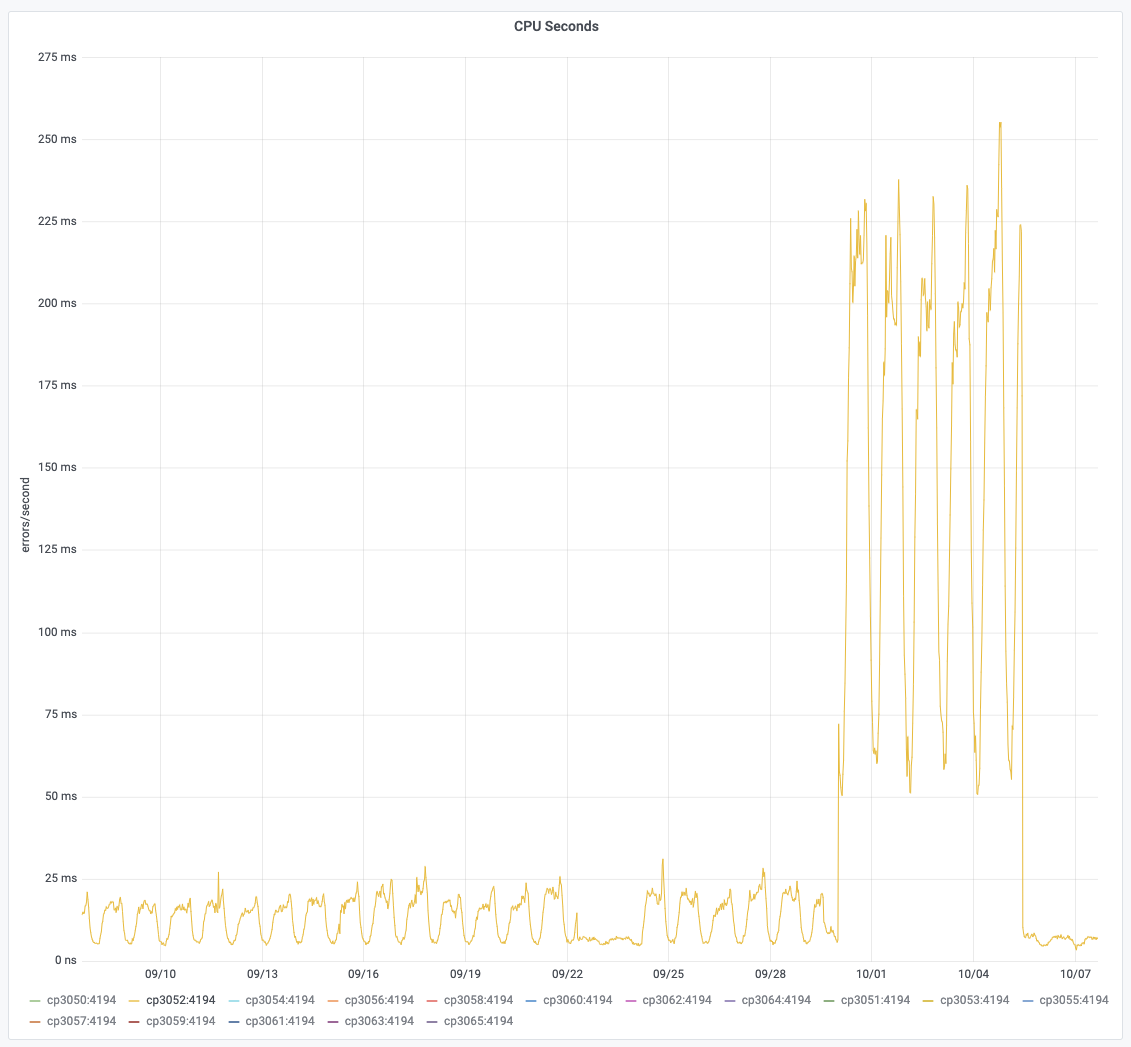
This regression could be a side-effect of T264074: varnishkafka 1.1.0 CPU usage increase, which happens alongside the upgrade. For that issue as well, we can see that the rollback gets rid of the CPU spikes on cp3052:

Screenshot 2020-10-07 at 18.17.49.png (1×1 px, 141 KB)

Related Objects

Event Timeline

There are a very large number of changes, so older changes are hidden. Show Older Changes

Comparing percentages for that 30-minute test, which was only looking at hit-front/hit-local/miss/pass for requests to /wiki/ URLs (approximation of wiki article URLs) since October 7:

hosthit-fronthit-localmisspass
cp305274.6%2.1%18%5.3%
cp305471.1%2.1%20.6%6.2%

I'm not sure how frontend servers are picked to serve requests (hashed by IP? URL?), but this seems like a noteworthy piece of data, which might be further confirmation of what seems to be a cluster-wide phenomenon in my previous comment.

This would suggest that while per response type our Varnish 6 deployment performs the same or better as Varnish 6, it might have more trouble keeping as many hot items in cache as previously? Do we have a dashboard/stats about how many objects Varnish frontends currently have in memory?

I've found the dashboard for total objects, and it seems like as many objects are stored now as there were before the Varnish 6 deployment. Maybe it could be an issue of objects that are stored but not found when access is attempted? I'm thinking of URL encoding issues, for example. Something we were doing in VCL that subtly stopped working in some edge cases in Varnish 6, for example.

It's a bit of a far-fetched argument, but if it is encoded-related, it might explain why eqsin is being affected more, as Asian traffic is more likely to be dealing with UTF-8 characters in URLs. Maybe this theory can be verified by looking at URL characters in wiki URLs at the Varnish level and checking whether the presence of some specific characters in the URL results in a higher rate of misses.

I'm not sure how frontend servers are picked to serve requests (hashed by IP? URL?), but this seems like a noteworthy piece of data, which might be further confirmation of what seems to be a cluster-wide phenomenon in my previous comment.

Frontend servers are hashed based on client source IP (so the same user should always land on the same frontend).

Backends are hashed based on content URL (mostly).

Change 635298 merged by Ema:
[operations/puppet@production] varnish: fix websockets on 6.x

https://gerrit.wikimedia.org/r/635298

Other than fixing websockets, this change deployed 2020-10-20 at 14:33 has improved things for the very worst requests (though they might not show up in RUM as they were mostly etherpad from what I could see). The absolute-worst time_firstbytes reported by ats-tls yesterday were around 26 seconds on Varnish 6 vs ~7 seconds on Varnish 5. Today there's no clear difference between v5 and v6.

Seeing that for some reason in my 30 minute test cp3054 was getting significantly more miss and pass requests than cp3052, I've just realised that I don't think I've looked at frontend hit rate before/after the Varnish 6 deployment.

Looking at the frontend hit rate, I think the change observed there might explain this regression.

I did notice the hitrate difference some weeks ago, but mentally dismissed it given that I could not find a correlation between time periods when the hitrate on v6 is higher than on v5 and the way the RUM graph looks like. For example, between 2020-10-20T12:58 and 2020-10-20T18:43, the hitrate on cp3058 was ~1% higher than on cp3052 and yet cp3052 seems to perform much better. It is however a very interesting angle to take in the investigation of course, I'll look into this next.

I found that there's a significant difference between the number of n_objecthead on v5 and v6:

Screenshot from 2020-10-21 15-14-05.png (1×2 px, 299 KB)

In particular, on v6 n_objecthead is roughly the same as n_objectcore (which is desirable). On v5 there's ~2x more objecthead. This is due to a bugfix, or various patches really, in v6 (see https://github.com/varnishcache/varnish-cache/issues/2754) but it seemed like a very clear change worth pointing out. Perhaps the fixes incidentally broke some Vary-related feature?

As @dpifke pointed out in our team meeting yesterday, there's also the possibility that v5 was returning hits on things that it shouldn't have, that are now correctly returned as misses. It would be really interesting to figure out if there's any pattern in what tends to be a hit on v5 vs v6. Understanding that delta might let us know if we're looking at a bug or a bugfix.

As @dpifke pointed out in our team meeting yesterday, there's also the possibility that v5 was returning hits on things that it shouldn't have, that are now correctly returned as misses. It would be really interesting to figure out if there's any pattern in what tends to be a hit on v5 vs v6. Understanding that delta might let us know if we're looking at a bug or a bugfix.

Yeah, following various rabbit holes we found for example that when an object is out of grace but in keep, starting with 6.0.1 that's considered a miss instead of a hit. This is visible in the varnish_main_cache_hit_grace difference between v5 and v6. It does not explain really the difference in frontend hits, but it's something.

cp3054 seems to be consistently a little faster for miss and pass, and overall a little slower for hit-front and hit-local. But I still can't see anything in the order of the extra tens of milliseconds seen on clients.

It is possible that the telemetry of both ats-tls and varnish-fe are actually accurate. However, they mostly capture the situation on the local node, while RUM data includes delays introduced over the WAN. Perhaps that is the area where v5 and v6 subtly differ. I'm gonna focus on trying to reproduce the issue from the perspective of a client, targeting specific nodes. See the instructions on Wikitech, but the general idea is:

sudo setcap 'cap_net_bind_service=+ep' /usr/bin/ssh
ssh -L 443:localhost:443 cp3052.esams.wmnet
curl --resolve en.wikipedia.org:443:127.0.0.1 https://en.wikipedia.org/wiki/Main_Page

The curl above is just for illustration purposes, it may or may not be useful to measure full connection establishments.

The telemetry of both ATS-TLS and Varnish is also blind to app-level, OS-level or hardware-level delays and buffering internal to our systems. They both report timestamps before writing to their client socket, but offer no visibility about when those bytes are actually received by the next layer.

That's why I suggested that we collect data about the ATS-TLS timestamps regarding its communication with Varnish, as it would allow us to see if there is a gap between the time Varnish is about to send data and when ATS-TLS has actually received it.

Before we dig into that, the "total time" we're going to collect from ATS-TLS should be enough to know whether it can contain the extra latency or not. If it can't possibly contain it, then there's no point investigating delays or buffering between ATS-TLS and Varnish or other parts of the "total" timeframe.

That being said, I still think that the drop of hit rate is a more likely explanation than individual request performance.

Before we dig into that, the "total time" we're going to collect from ATS-TLS should be enough to know whether it can contain the extra latency or not. If it can't possibly contain it, then there's no point investigating delays or buffering between ATS-TLS and Varnish or other parts of the "total" timeframe.

Fair enough.

That being said, I still think that the drop of hit rate is a more likely explanation than individual request performance.

Even if there seems to be no clear correlation between better v6 hitrate and RUM performance as mentioned in T264398#6567470?

I think that a major caveat with that 6-hour window counter-example is that it's looking at hit rate over everything and RUM data is only looking at wiki articles. The "live" 30-minute window experiment was filtering the URLs in varnishlog.

Also, looking at a 1 hour sampling size over a 6 hour period might be a bit extreme in terms of rounding. Switch to 5 minute sampling, and while the difference in hit rate stays consistent, the response start difference becomes very noisy and the reverse correlation to hit rate difference isn't there:

Screenshot 2020-10-22 at 11.55.57.png (1×1 px, 208 KB)

For reference, 5-minute window during that particular period contains an average of 244 samples per host for RUM data:

SELECT COUNT(*) FROM event.navigationtiming WHERE year = 2020 AND month = 10 AND UNIX_TIMESTAMP(dt, "yyyy-MM-dd'T'HH:mm:ss'Z'") >= 1603198731 AND UNIX_TIMESTAMP(dt, "yyyy-MM-dd'T'HH:mm:ss'Z'") <= 1603219577 AND recvfrom = 'cp3052.esams.wmnet'

44075

Since we do have hit/miss data in RUM Hive for browsers that support Server Timing, let's look at it in the pre-v6 period and more recent times:

SELECT COUNT(*), PERCENTILE(nt.event.responsestart, 0.5) AS median_responsestart, nt.recvfrom, st.event.description
FROM event.servertiming AS st
JOIN event.navigationtiming AS nt ON st.event.pageviewtoken = nt.event.pageviewtoken
WHERE nt.year = 2020 AND nt.month = 9 AND nt.day >= 10 AND nt.day <= 24
AND st.year = 2020 AND st.month = 9 AND st.day >= 10 AND st.day <= 24
AND nt.event.isoversample = false
AND nt.recvfrom LIKE '%.esams.wmnet'
GROUP BY nt.recvfrom, st.event.description
LIMIT 100;
Hosthit-front rate 2020-09-10-> 2020-09-24hit-front rate 2020-10-07 -> 2020-10-21
cp305072.8%68.4%
cp305272.6%72.8%
cp305472.8%68.4%
cp305672.3%68.4%
cp305872.8%68.4%
cp306072.5%68.3%
cp306272.8%68.4%
cp306472.6%68.6%

Now, as one would expect given how requests are load balanced to hosts by IP, the total amount of requests sampled by each host over a 2-week period is very consistent. Which means that we can see what those requests that used to be hit-front became. Looking at the 2020-10-07 -> 2020-10-21 period:

Hosthit-fronthit-localmisspass
cp305272.8%0.9%21.6%4.7%
cp305468.4%1.2%25.6%4.8%

In other words, a 4% increase of misses and a possible 0.3% increase of backend hits.

Furthermore, let's look at the median responseStart data for the different response types, still during the 2020-10-07 -> 2020-10-21 period:

Hosthit-fronthit-localmisspass
cp3052234316629753
cp3054234329629748

I think this is solid confirmation that the global RUM performance change that started this investigation isn't a performance change of individual Varnish response types, but a lowered frontend hit rate for wiki articles. Varnish 6 still serves frontend hits, backend hits, misses and passes as fast as it used to. It's just serving 4% less frontend hits, in favor of misses when dealing with wiki pages.

I've compared 1+ million miss requests on cp3052 and cp3054 and looking at the most frequent miss URLs, there's no distinguishable pattern. Miss URLs are mostly a very flat and long tail, though.

Given that the amount of changes between 5.1.3 and 6.0.6 is considerable, I was thinking of following this "bisect-like" apporach: package Varnish 6.0.2, try it out on a node, see if there's any difference. If 6.0.2 performs better, than the regression happened between 6.0.3 and 6.0.6, otherwise earlier than 6.0.2.

I tried installing 6.0.2 on cp4032, and to my surprise I found out that 6.0.6 and 6.0.2 are not binary compatible:

[...]
Oct 27 09:43:37 cp4032 varnish-frontend[41162]:         VMOD wants ABI version 7.1
Oct 27 09:43:37 cp4032 varnish-frontend[41162]:         varnishd provices ABI version 7.0
[...]

The ABI change is not documented anywhere in the changelog, other than with the following wording in 6.0.4:

* New VRT functions for handling STRANDS (split strings) in
  VMODs. `vmod_blob` now uses strands internally.

At this point we should rebuild the whole circus (varnish-modules and our VMODs) against a varnish version earlier than 6.0.4 if we want to follow the bisect approach.

I tried installing 6.0.2 on cp4032, and to my surprise I found out that 6.0.6 and 6.0.2 are not binary compatible:

Macro facepalm:

Mentioned in SAL (#wikimedia-operations) [2020-10-27T15:25:33Z] <ema> cp4032: downgrade varnish to 6.0.4 T264398

With T266567 out of the way, we can now try different Varnish 6 versions, at least as long as they're VRT-compatible.

Mentioned in SAL (#wikimedia-operations) [2020-10-28T10:25:00Z] <ema> A:cp (except cp3052, running varnish 5) upgrade libvmod-netmapper to 1.9-1 T266567 T264398

Mentioned in SAL (#wikimedia-operations) [2020-10-29T08:53:57Z] <vgutierrez> A:cp (except cp3052, running varnish 5) upgrade libvmod-netmapper to 1.9-1 T266567 T264398

Hosthit-front rate 2020-09-10 -> 2020-09-23hit-front rate 2020-10-29 -> 2020-11-02
cp402770.3%64.4%
cp402872.2%64.2%
cp402971.2%63.8%
cp403071.3%64.3%
cp403171.9%63.9%
cp403272.1%65.4%

We should probably wait to have at least a full week of post-warmup data for confirmation. This early result suggests that 6.0.4 might be doing a little better, but definitely not "5.1.3 better"...

We should probably wait to have at least a full week of post-warmup data for confirmation. This early result suggests that 6.0.4 might be doing a little better, but definitely not "5.1.3 better"...

At this point we should probably have enough data to draw some conclusions, though ulsfo might not be the best cluster given how relatively idle it is. Looking at the RUM data I don't see any shocking difference between cp4031 and cp4032. Tomorrow I'll revert the change on cp4032 so that we fix T268243. This is anyways a useful test in that it leads to two observations:

  1. when testing a different version of varnish, let's say 6.0.4, on a given host, it would be useful to also restart the service on a 6.0.6 host to compare behavior with roughly the same number of objects
  2. we should rebuild all packages every time we test a different Varnish version (T264398#6580942 and T268243)

Mentioned in SAL (#wikimedia-operations) [2020-11-24T09:13:19Z] <ema> cp4032: switch back to varnish 6.0.6-1wm2 after T264398 experiment, fix T268243

I pulled the November data for the experiment, for reference:

Hosthit-front rate 2020-11-01 -> 2020-11-23
cp402767.23%
cp402866.71%
cp402966.82%
cp403066.99%
cp403166.84%
cp403267.12%

Indeed, no notable difference between cp4032 and the other hosts.

Varnish 6.0.7 is behaving well in terms of functionality on cp4032 (T268736).

I've rebooted cp4031 shortly after the upgrade of cp4032 for unrelated reasons (T256467) , and that gives us the chance to compare the hitrate on both hosts. So far the frontend hitrate on 6.0.7 looks about 3% higher than on 6.0.6:

Screenshot from 2020-11-30 15-01-26.png (1×2 px, 165 KB)

Having confirmed that 6.0.7 at least does not seem to be worse than 6.0.6, later today I'll upgrade a text@esams node too.

Mentioned in SAL (#wikimedia-operations) [2020-11-30T15:34:13Z] <ema> cp3054: upgrade varnish to 6.0.7-1wm1 T268736 T264398

Mentioned in SAL (#wikimedia-operations) [2020-12-07T16:43:04Z] <ema> deployment-cache-text06: downgrade varnish to 5.2.1-1wm1 T264398

It took a while to package and rebuild libvmod-re2, libvmod-netmapper, varnish-modules, and varnishkafka against varnish 5.2.1. Long story short, we now have the following packages available on deneb and working with Varnish 5.2.1:

packageversion
libvmod-re21.4.5-1
libvmod-netmapper1.10-1
varnish-modules0.15.0-1+wmf2
varnishkafka1.1.0-2

I'm not going to upload them to apt.wikimedia.org as the plan is to test 5.2.1 on one single host. Instead, I've copied them to deployment-cache-text06, downgraded, and restarted varnish, so now https://en.wikipedia.beta.wmflabs.org/ is served by 5.2.1 and looks fine. Tomorrow I'll downgrade a text@esams host so we can see if the regression was introduced as early as 5.2.1 or if we have to look any further.

Change 646964 had a related patch set uploaded (by Ema; owner: Ema):
[operations/puppet@production] cache: downgrade Varnish on cp3054 to 5.2.1-1wm1

https://gerrit.wikimedia.org/r/646964

Change 646964 merged by Ema:
[operations/puppet@production] cache: downgrade Varnish on cp3054 to 5.2.1-1wm1

https://gerrit.wikimedia.org/r/646964

Mentioned in SAL (#wikimedia-operations) [2020-12-08T09:56:33Z] <ema> cp3054: downgrade varnish to 5.2.1-1wm1 T264398

Change 646776 had a related patch set uploaded (by Ema; owner: Ema):
[operations/puppet@production] Revert "cache: downgrade Varnish on cp3054 to 5.2.1-1wm1"

https://gerrit.wikimedia.org/r/646776

Change 646776 merged by Ema:
[operations/puppet@production] Revert "cache: downgrade Varnish on cp3054 to 5.2.1-1wm1"

https://gerrit.wikimedia.org/r/646776

Mentioned in SAL (#wikimedia-operations) [2020-12-08T10:13:51Z] <ema> cp3054: upgrade varnish back to 6.0.7-1wm1 T264398

I've downgraded Varnish to version 5.2.1-1wm1 on cp3054 and had to revert due to an issue with varnishlog. After the upgrade, I've noticed that systemd-journald was maxing-out a CPU and suppressing millions of messages.

Dec 08 10:10:12 cp3054 systemd-journald[24968]: Suppressed 2584898 messages from varnish-frontend-hospita
Dec 08 10:10:14 cp3054 systemd-journald[24968]: Forwarding to syslog missed 1967838 messages.
Dec 08 10:10:42 cp3054 systemd-journald[24968]: Suppressed 2491469 messages from varnish-frontend-hospita
Dec 08 10:10:44 cp3054 systemd-journald[24968]: Forwarding to syslog missed 2049042 messages.

In particular, the following command produced a flood of "Log overrun" messages:

/usr/bin/varnishlog -g raw -q 'Backend_health ~ "Back healthy|Went sick"' -n frontend

That's the command used by varnish-frontend-hospital.service.

It's likely that 5.2.1 is affected by T264074, we need to backport our fix to 5.2.x too. However I don't think that during the 6.0.x upgrades we ran into this specific varnishlog issue, there might be more work to do in that regard too.

It's likely that 5.2.1 is affected by T264074, we need to backport our fix to 5.2.x too. However I don't think that during the 6.0.x upgrades we ran into this specific varnishlog issue, there might be more work to do in that regard too.

It looks like 5.2.1 had a ton of VSL-related issues. The following issues look relevant, #2586 in particular:

The list of VSM-related issues affecting 5.2.1 according to upstream's changelog is: 2430, 2470, 2518, 2535, 2541, 2545, 2546. I suspect they forgot to list some important changes given that 2586 isn't mentioned in changes.rst at all though it looks precisely like the infinite "Log overrun" problem mentioned yesterday.

Anyhow, for now I've applied:

The patch supposedly fixing https://github.com/varnishcache/varnish-cache/issues/2518, instead, does not apply cleanly and requires porting work.

OK the amount of work needed to get 5.2.1 in a usable state really seems excessive. Let's give a try to 6.0.0, which is the version immediately after 5.2.1 and according to the changelog should address the VSM bugs introduced in 5.2.1. I've rebuilt all the dependencies, here the versions for reference:

packageversion
varnish6.0.0-1wm1
varnish-modules0.15.0-1+wmf2
varnishkafka1.1.0-2
libvmod-re21.5.3-1
libvmod-netmapper1.9-2

Mentioned in SAL (#wikimedia-operations) [2020-12-09T16:10:42Z] <ema> deployment-cache-text06: deploy varnish 6.0.0-1wm1 T264398

Change 647615 had a related patch set uploaded (by Ema; owner: Ema):
[operations/puppet@production] cache: downgrade Varnish on cp3054 to 6.0.0-1wm1

https://gerrit.wikimedia.org/r/647615

Change 647615 merged by Ema:
[operations/puppet@production] cache: downgrade Varnish on cp3054 to 6.0.0-1wm1

https://gerrit.wikimedia.org/r/647615

Mentioned in SAL (#wikimedia-operations) [2020-12-10T09:28:46Z] <ema> cp3054: downgrade varnish to 6.0.0-1wm1 T264398

Initial results of the 6.0.0 experiment on cp3054 are encouraging: for the past 12 hours performance has been in line with 5.1.3 on cp3052:

Screenshot from 2020-12-11 13-41-12.png (1×2 px, 267 KB)

Let's keep the experiment running during the weekend and re-evaluate on Monday.

Change 649278 had a related patch set uploaded (by Ema; owner: Ema):
[operations/puppet@production] ATS: change connect timeouts

https://gerrit.wikimedia.org/r/649278

Change 649278 merged by Ema:
[operations/puppet@production] ATS: change ats-be connect timeouts

https://gerrit.wikimedia.org/r/649278

Varnish 6.0.0 does not seem to be affected by the regression, here is the average webperf_navtiming_responsestart_by_host_seconds (p75) during the past 10 days:

hostversionp75
cp30546.0.0487ms
cp30525.1.3489ms
cp30606.0.7508ms
cp30566.0.7510ms

See the relevant dashboard. I will try 6.0.1 next.

Mentioned in SAL (#wikimedia-operations) [2021-01-04T12:52:04Z] <ema> deployment-cache-text06: try out varnish 6.0.1-1wm1 T264398

6.0.1-1wm1 has now been working fine for a day on the beta cluster, upgrading cp3054.

Mentioned in SAL (#wikimedia-operations) [2021-01-05T09:21:35Z] <ema> cp3054: upgrade varnish to 6.0.1-1wm1 T264398

Over the past 2 days, 6.0.1 has been performing worse than 5.1.3, and similarly to 6.0.7. This would seem to indicate that the regression was introduced between 6.0.0 and 6.0.1.

hostversionp75
cp30525.1.3504ms
cp30566.0.7523ms
cp30606.0.7526ms
cp30546.0.1526ms

Awesome, glad to see that the bisecting paid off! Still 361 commits between those 2 versions, though 😕

Awesome, glad to see that the bisecting paid off! Still 361 commits between those 2 versions, though 😕

Yeah, although most of those are, from a cursory look at the commit log, trivial and clearly not related (eg: h2, documentation, VTC tests). As previously noted in T264398#6568605 it seems possible that the fairly invasive changes introduced with PR 2705 might be involved in this regression. I've now built 6.0.1-1wm2 packages with P13928 applied to revert upstream PR 2705. We can give it a try next week on cp3054!

Mentioned in SAL (#wikimedia-operations) [2021-03-23T13:15:34Z] <ema> cp3054: install varnishkafka built explicitly against varnish 6.0.1-1wm2 to fix broken dpkg status T264398

The Response Time By Host dashboard shows no data, last bits of information on February 22. Is there anything we can do to fix it?

image.png (1×2 px, 246 KB)

T277769 needs to be completed for the dashboard to be restored. Essentially the host data has to go through a new pipeline. The EventGate collection part is ready to merge, next I'll write the changes to the navtiming daemon. Since the data overwhelmed Grafana when looking at a whole DC, I think I'll change it to be just broken down by host, with the ability to select multiple hosts.

T277769 needs to be completed for the dashboard to be restored. Essentially the host data has to go through a new pipeline. The EventGate collection part is ready to merge, next I'll write the changes to the navtiming daemon.

Ack, thanks!

Since the data overwhelmed Grafana when looking at a whole DC, I think I'll change it to be just broken down by host, with the ability to select multiple hosts.

Sounds good, I found dashboards using webperf_navtiming_responsestart_by_host_seconds_bucket such as this one particularly useful, so it would be great to be able again to perform comparisons like webperf_navtiming_responsestart_by_host_seconds_bucket{host=~"cp3050"} vs webperf_navtiming_responsestart_by_host_seconds_bucket{host=~"cp3054"}.

Vanilla 6.0.1 was performing worse than 5.1.3 and similarly to 6.0.7 when we tested it in January:

Over the past 2 days, 6.0.1 has been performing worse than 5.1.3, and similarly to 6.0.7. This would seem to indicate that the regression was introduced between 6.0.0 and 6.0.1.

hostversionp75
cp30525.1.3504ms
cp30566.0.7523ms
cp30606.0.7526ms
cp30546.0.1526ms

We have now been running for a long time with Varnish 6.0.1-1wm2 installed on cp3054, which is exactly like "vanilla" 6.0.1-1wm1 but with all commits in PR 2705 reverted. 6.0.1 without PR 2705 performs just like 5.1.3, and is ~25ms better than 6.0.7 at both p50 and p75. We can now state with confidence that a 25ms regression was introduced by PR 2705.

hostversionp75p50
cp30546.0.1 (w/o PR2705)580ms291ms
cp30525.1.3585ms299ms
cp30566.0.7607ms314ms
cp30606.0.7607ms319ms

To reiterate, the PR claims to be doing the following according to upstream:

When an object is out of grace but in keep, the client context goes straight to vcl_miss instead of vcl_hit.

All relevant code paths have changed between 6.0.1 and 6.0.7, so we can't just "revert 2705" on 6.0.7. We can however spend some time preparing a patch doing the equivalent (consider out of grace objects in keep as hit).

It's great that we narrowed this down and confirmed it, excellent work! The change's claimed behaviour is definitely consistant with the change we observed in hit/miss ratio. What's upstream's take on making this behaviour configurable?

Alternatively, can we get identical results just by incrementing grace by keep? (And possibly setting keep to 0 if it isn't doing anything for us w.r.t. If-Modified-Since?)

https://varnish-cache.org/docs/trunk/users-guide/vcl-grace.html

Alternatively, can we get identical results just by incrementing grace by keep? (And possibly setting keep to 0 if it isn't doing anything for us w.r.t. If-Modified-Since?)

Something along these lines may be plausible, but currently there's a big gap between these values in our config (grace is ~31s on text, and keep is a full day). Their purposes are very distinct: grace is meant to offer up a recently-expired object as a direct (non-conditional) hit just for long enough to ensure we have time to refresh a hot object just after it expires, while keep is for those conditional responses (in which case TTL expiry is less an issue, because we have a condition on which to know the expired object is ok to still use).

I think, if we set grace to a full day, this could have staleness issues even for less-hot objects, which may occasionally serve a very stale object unconditionally? We might be able to run some stats on varnishlog outputs and get a picture of how often grace/keep are currently generating useful results, and for what kinds of objects.

Continuing the thought above: varnishlog data may infer that most of the perf impact could be restored just by extending grace to something like 5 minutes.

The change's claimed behaviour is definitely consistant with the change we observed in hit/miss ratio.

I'm actually not sure it is. In the last 24 hours p75 response time RUM for cp3052 averaged 585ms vs 622ms on cp3056, and yet the hitrate of cp3056 has been consistently higher throughout the time frame.

What's upstream's take on making this behaviour configurable?

The change is relatively invasive code-wise, and it has been done to try and tackle bug 1799, which unfortunately is not described at all in the ticket on github. There's however a copy of the original bug report on archive.org and a detailed explanation in this commit. I think that making the behavior configurable or reverting the change is not something upstream would consider, but I guess asking does not cost anything. :)

What might be very important to note in all this, and I'm not sure if @BBlack and I ever noticed this, is that the builtin VCL (see sudo varnishd -x builtin) does this:

sub vcl_hit {
    if (obj.ttl >= 0s) {
        // A pure unadulterated hit, deliver it
        return (deliver);
    }
    if (obj.ttl + obj.grace > 0s) {
        // Object is in grace, deliver it
        // Automatically triggers a background fetch
        return (deliver);
    }
    // fetch & deliver once we get the result
    return (miss);
}

Our VCL, instead, does this:

sub vcl_hit {
        set req.http.X-CDIS = "hit";
        call cluster_fe_hit;
        // no default VCL.
        return (deliver);
}

And for cache_text:

sub cluster_fe_hit { }

Does that mean that before PR 2705 there was no distinction for us between grace and keep?

An important thing to keep in mind when it comes to Varnish docs, is that the first google result will often be about the "trunk" version (ie: git master branch), like the one you found about grace and keep. The "trunk" documents describe a reality which may be different from the latest (6.6.x as we speak) release: https://varnish-cache.org/docs/6.6/users-guide/vcl-grace.html. The latest version in turn may be, and indeed in this case is, very different from the LTS version 6.0.x that we are currently using at WMF: compare https://varnish-cache.org/docs/6.0/users-guide/vcl-grace.html with the document you found to see what I mean. Additionally we also had to patch Varnish ourselves significantly in the past so there's no guarantee that the 6.0.x docs reflect what "our" Varnish does either, but that's another story.

At any rate, the specific change we have singled out as the cause for at least some portion of this regression has been introduced between 6.0.0 and 6.0.1, while https://varnish-cache.org/docs/6.0/users-guide/vcl-grace.html describes 6.0.7. It can be very confusing to read the 6.0.x version of the docs and assume this is what we are seeing in prod, given that we currently have a mix of 5.1.3, 6.0.1 without PR 2705, 6.0.1 with PR 2705, and 6.0.7 serving live traffic just to find out more about this issue. Indeed, if you look at PR 2705, you'll find that one of the commits extensively changes vcl-grace.rst, which is the source of the "Grace mode and keep" section of the docs.

To sum it up, the description of what we have in prod may be one of the following depending on which server you're looking at, with the additional caveat that our VCL is different from the builtin too:

Change 683571 had a related patch set uploaded (by Ema; author: Ema):

[operations/puppet@production] vcl: remove cluster_fe_hit hooks

https://gerrit.wikimedia.org/r/683571

Change 683572 had a related patch set uploaded (by Ema; author: Ema):

[operations/puppet@production] vcl: make vcl_hit invoke default VCL

https://gerrit.wikimedia.org/r/683572

Change 683571 merged by Ema:

[operations/puppet@production] vcl: remove cluster_fe_hit hooks

https://gerrit.wikimedia.org/r/683571

Change 683572 merged by Ema:

[operations/puppet@production] vcl: make vcl_hit invoke default VCL

https://gerrit.wikimedia.org/r/683572

Change 683572 merged by Ema:

[operations/puppet@production] vcl: make vcl_hit invoke default VCL

https://gerrit.wikimedia.org/r/683572

With this change all hosts should now distinguish correctly between grace and keep, including cp3052 (5.1.3-1wm15) and cp3054 (6.0.1-1wm2 with PR 2705 reverted). Nothing should change for all other hosts. I would expect TTFB on both cp3052 and cp3054 to align with the rest of text@esams, will check tomorrow.

Thank you for the excellent commit message on the vcl_hit change! It makes the issue very clear. (Future readers of this task should go there if they haven't already.)

p75 averages for the past 12 hours:

hostversionp75
cp30606.0.7618ms
cp30525.1.3628ms
cp30566.0.7635ms
cp30546.0.1 w/o PR2705649ms

While the difference between the best and the worst host is still significant (~30ms), it's now not the case anymore that 5.1.3 and 6.0.1 without PR2705 perform better than 6.0.7.

The performance difference on cp3052 is also fairly visible, looking at the graph.

Screenshot from 2021-04-30 09-50-48.png (1×2 px, 309 KB)

For reference, the change was applied on cp3052 at Apr 29 13:56:17, and on cp3054 at Apr 29 13:59:29.

Looking at average p75 over the last two days, all varnish versions in text@esams now perform very similarly:

hostversionp75
cp30606.0.7584
cp30525.1.3591
cp30566.0.7591
cp30546.0.1 w/o PR2705595

Incidentally, I noticed that cp3054 is now performing ~50ms better than last month when I was looking at the same data (595 vs 649ms) due to unrelated improvements elsewhere in the stack, which was nice to see.

Back to this ticket, I think it is safe to conclude that the performance regression described here is not intrinsic to any specific upstream code change. Instead, the difference can be explained with the VCL bug described in https://gerrit.wikimedia.org/r/c/operations/puppet/+/683572/, which effectively resulted in a much longer grace time compared to what we really wanted to enforce. We do know of course that increasing TTLs can result in improved performance, but it must be a conscious decision weighted against the potential drawbacks (eg: serving stale articles in case of purge issues) rather than a by-product of grace/keep confusion. From my side I think we can now revert all experiments (which is to say: upgrade all nodes to the latest Varnish LTS) and close this ticket given that we finally do have a rational explanation for the regression, possibly opening a new task focused on revisiting our object lifetime settings for future improvements, but I'll pass the ball back to @Gilles first.

Thank you very much for the thorough investigation and explanations, I agree that now the issue is well understood and the experiments can be removed.

Change 693440 had a related patch set uploaded (by Ema; author: Ema):

[operations/puppet@production] Revert "cache: downgrade Varnish on cp3052 to 5.1.3-1wm15"

https://gerrit.wikimedia.org/r/693440

Change 693441 had a related patch set uploaded (by Ema; author: Ema):

[operations/puppet@production] Revert "cache: downgrade Varnish on cp3054 to 6.0.0-1wm1"

https://gerrit.wikimedia.org/r/693441

Change 693440 merged by Ema:

[operations/puppet@production] Revert "cache: downgrade Varnish on cp3052 to 5.1.3-1wm15"

https://gerrit.wikimedia.org/r/693440

Change 693441 merged by Ema:

[operations/puppet@production] Revert "cache: downgrade Varnish on cp3054 to 6.0.0-1wm1"

https://gerrit.wikimedia.org/r/693441

Mentioned in SAL (#wikimedia-operations) [2021-05-25T09:58:56Z] <ema> cp3054: upgrade varnish to latest LTS (6.0.7-1wm1) T264398