Lets convert the performance dashboards that uses Graphite to use Prometheus instead.
Description
Details
- Other Assignee
- Krinkle
| Status | Subtype | Assigned | Task | ||
|---|---|---|---|---|---|
| Open | None | T228380 Tech debt: sunsetting of Graphite | |||
| Open | None | T205870 Fully migrate producers off statsd | |||
| Open | None | T319329 Expand navigation timing metrics to include user experience metrics and modernise navigation timing | |||
| Resolved | Krinkle | T175087 Create a navtiming processor for Prometheus | |||
| Open | None | T321398 Move performance metrics from Graphite to Prometheus | |||
| Open | None | T325283 Update navtiming dashboards to use Prometheus metrics |
Event Timeline
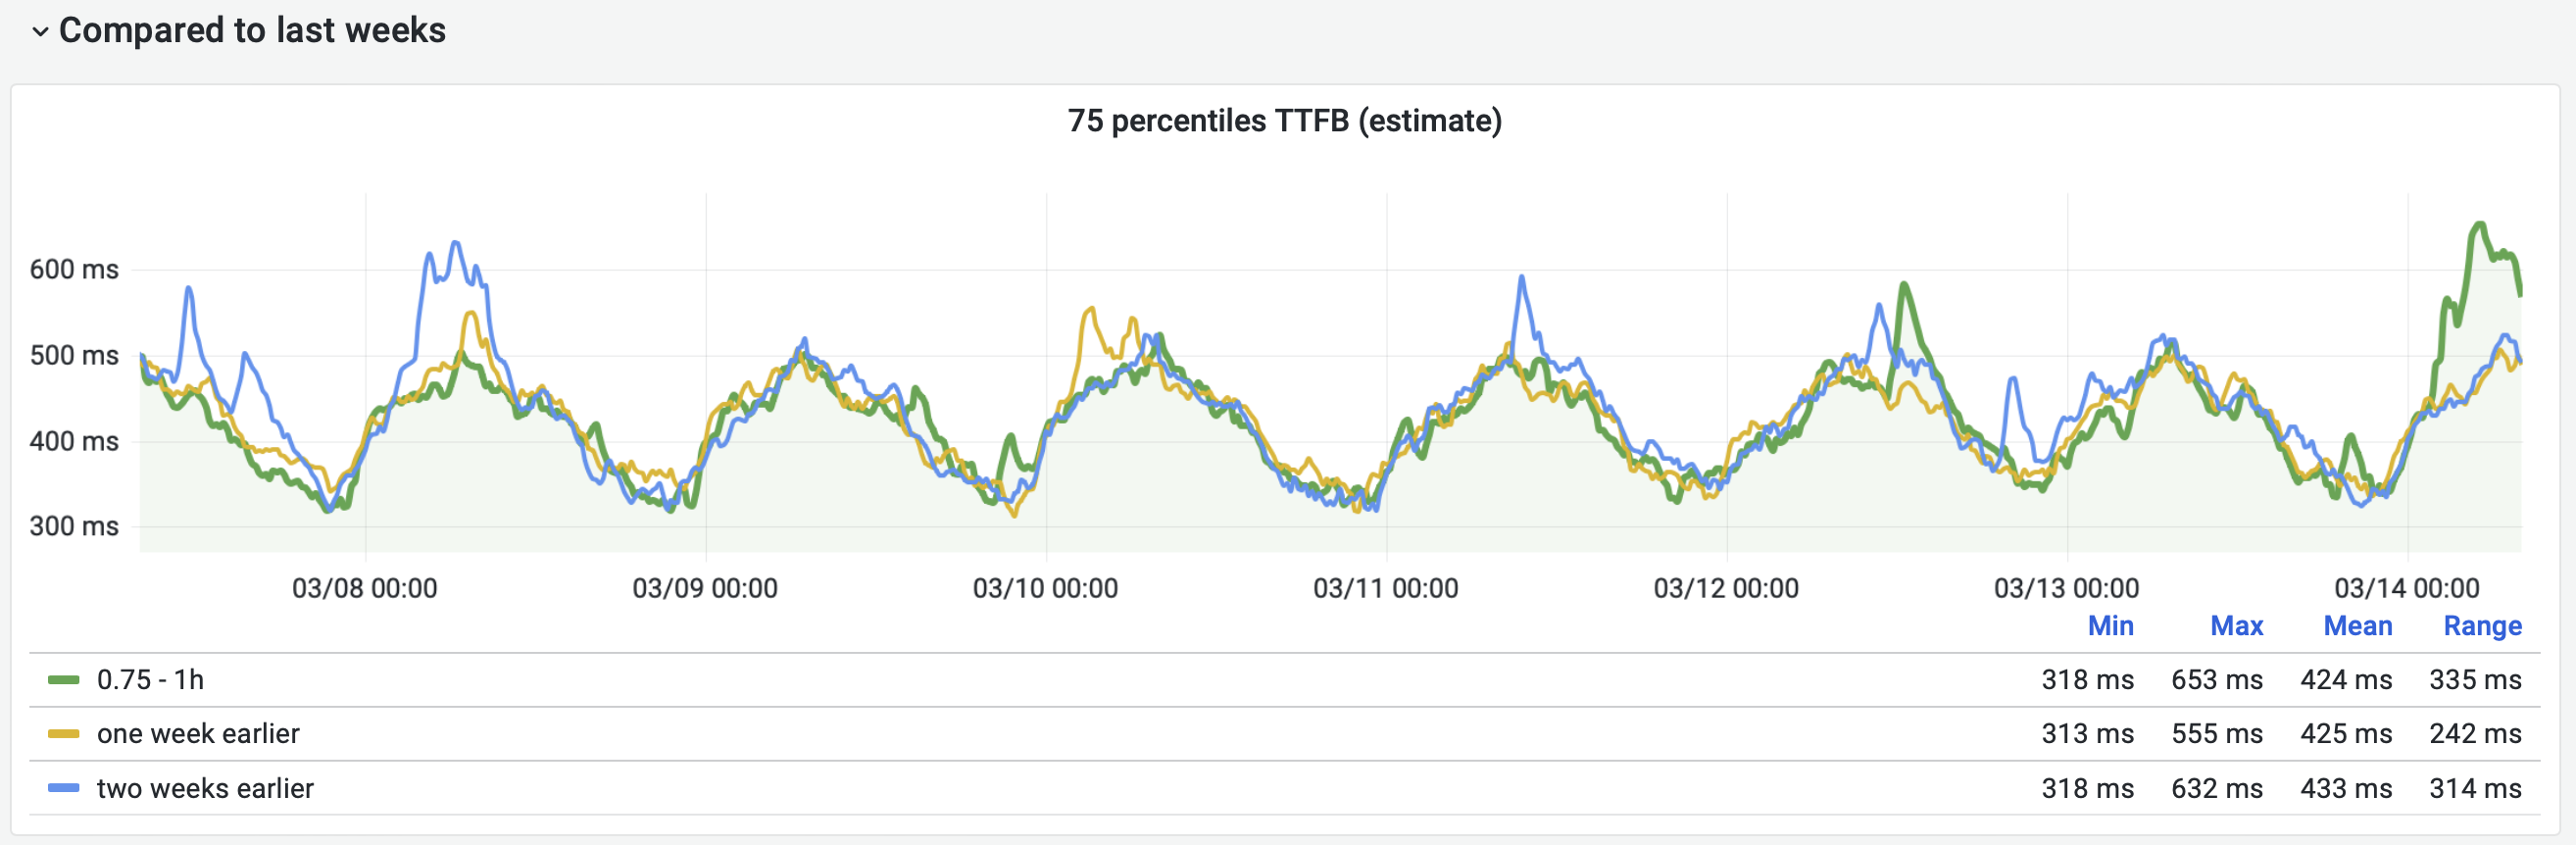
Today we have an issue for users with TTFB and I just verified that we can see the same thing with our Prometheus metrics. Looking at TTFB 75p and compare with one/two weeks back:
And also in the dashboard where we calculate how many users gets a faster experience than X
We can see here that across the board we don't reach the same level as one week ago.
Navtiming is not quite fully migrated:
- https://grafana-rw.wikimedia.org/d/000000326/navigation-timing-alerts
- https://grafana-rw.wikimedia.org/d/000000218/navtiming-by-browser-history?orgId=1
- https://grafana-rw.wikimedia.org/d/000000230/navtiming-by-continent-history?orgId=1
- https://grafana-rw.wikimedia.org/d/000000038/navtiming-by-platform-history?orgId=1
- https://grafana-rw.wikimedia.org/d/000000143/navtiming-overall-history?orgId=1
- https://grafana-rw.wikimedia.org/d/000000050/navtiming-stacked-history?orgId=1&refresh=5m
I don't think all dashboards need to be migrated and there's no team that is responsible for that data right now. I added T389321 for removing them. We will miss out of some data (it's not a 1:1 match with the data we have in Prometheus) but that is ok for now then I guess.
For the Prometheus dashboards I think there's some work that needs to be done: Where we use "estimations" on p75 for metrics we need to make sure our alerts use percentage of users. I think the one we have today do, but that needs to be verified. The other thing is that the graphs using Prometheus is slow. Right not most graph do not work if you go back in time more than 30 days, it will just time out.
Change #1133152 had a related patch set uploaded (by Tiziano Fogli; author: Tiziano Fogli):
[operations/alerts@master] perf/navtiming: migrate alerts from grafana to alertmanager
Change #1133152 merged by jenkins-bot:
[operations/alerts@master] perf/navtiming: migrate alerts from grafana to alertmanager
Change #1135326 had a related patch set uploaded (by Phedenskog; author: Phedenskog):
[operations/alerts@master] perf/navtiming: migrate alerts from grafana to alertmanager
Change #1135393 had a related patch set uploaded (by Phedenskog; author: Phedenskog):
[operations/alerts@master] perf/navtiming: Add LoadEventEnd alert to alertmanager
Change #1135408 had a related patch set uploaded (by Phedenskog; author: Phedenskog):
[operations/alerts@master] perf/navtiming: Add CPU long task alert to alertmanager
Change #1135326 merged by jenkins-bot:
[operations/alerts@master] perf/navtiming: Add FCP alert to alertmanager
Change #1135393 merged by jenkins-bot:
[operations/alerts@master] perf/navtiming: Add LoadEventEnd alert to alertmanager
Change #1135408 merged by jenkins-bot:
[operations/alerts@master] perf/navtiming: Add CPU long task alert to alertmanager


