Page MenuHomePhabricator

Prometheus @ k8s OOM loop
Closed, ResolvedPublic

Description

Memory usage graph

Prometheus consumes a ton of memory replaying the wal, then later gets reaped by the oom-killer. As a mitigation, I backed up the wal to 2024-01-05_wal and restarted prometheus@k8s. It's unclear at the moment whether prometheus@k8s is the cause or the victim.

Jan  5 00:44:19 prometheus1006 kernel: [11682403.939219] oom-kill:constraint=CONSTRAINT_NONE,nodemask=(null),cpuset=/,mems_allowed=0-1,global_oom,task_memcg=/system.slice/system-prometheus.slice/prometheus@k8s.service,task=prometheus,pid=3833619,uid=110
Jan  5 00:44:19 prometheus1006 kernel: [11682403.939321] Out of memory: Killed process 3833619 (prometheus) total-vm:854719612kB, anon-rss:62292952kB, file-rss:3912kB, shmem-rss:0kB, UID:110 pgtables:136472kB oom_score_adj:0
Jan  5 00:44:22 prometheus1006 kernel: [11682407.168165] oom_reaper: reaped process 3833619 (prometheus), now anon-rss:0kB, file-rss:0kB, shmem-rss:0kB
Jan  5 00:44:22 prometheus1006 systemd[1]: prometheus@k8s.service: Main process exited, code=killed, status=9/KILL
Jan  5 00:44:22 prometheus1006 systemd[1]: prometheus@k8s.service: Failed with result 'signal'.
Jan  5 00:44:22 prometheus1006 systemd[1]: prometheus@k8s.service: Consumed 1h 2min 15.057s CPU time.
Jan  5 00:44:24 prometheus1006 systemd[1]: prometheus@k8s.service: Scheduled restart job, restart counter is at 13.
Jan  5 00:44:24 prometheus1006 systemd[1]: Stopped Prometheus server (instance k8s).
Jan  5 00:44:24 prometheus1006 systemd[1]: prometheus@k8s.service: Consumed 1h 2min 15.057s CPU time.

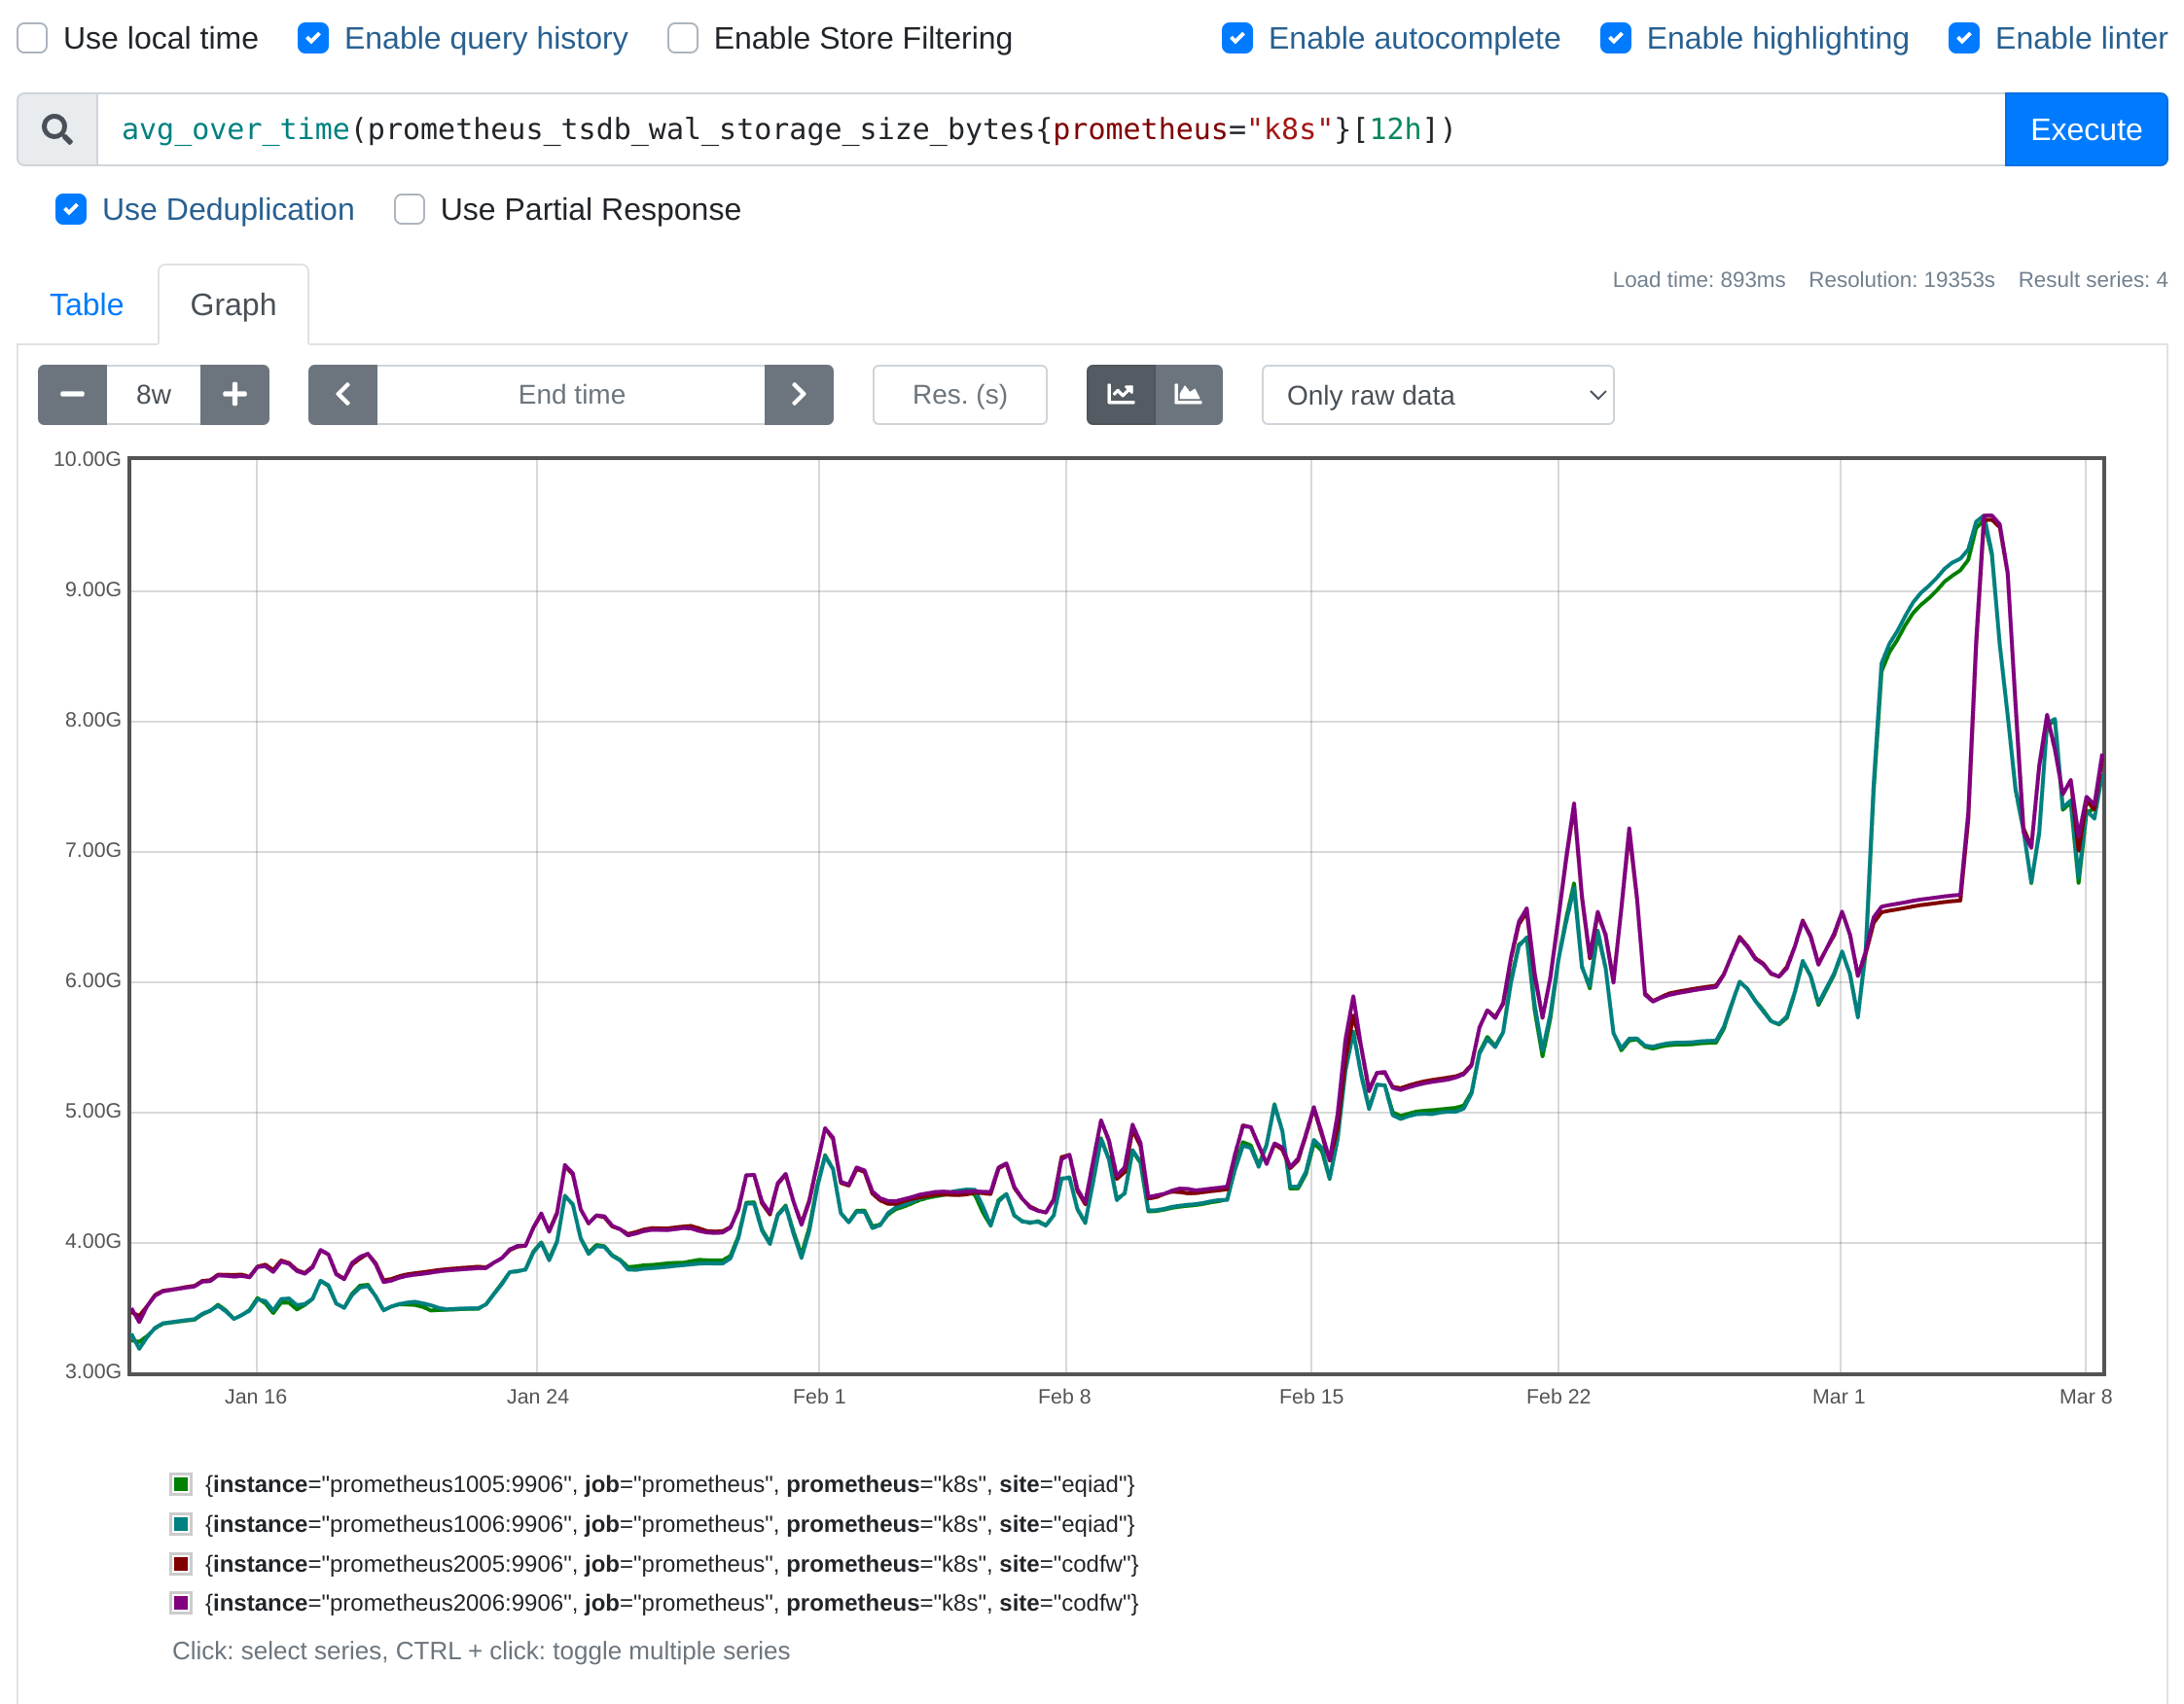
Thanos may still have a copy of the data? eqiad prometheus/k8s definitely has a gap since the OOMs started.

remediation

Nuking the WAL is enough to let prometheus start back up (with loss of data that was in the WAL):

# might take up to 1-2 minutes
systemctl stop prometheus@k8s
mv /srv/prometheus/k8s/metrics/wal /srv/prometheus/k8s/metrics/wal-$(date -Im)
systemctl start prometheus@k8s

Event Timeline

colewhite updated the task description. (Show Details)

I've looked at the per-unit memory usage and prometheus@k8s does appear to be the cause, i.e. sudden memory spike and then crashloop as per dashboard

Things are not as busy in codfw (mostly because prometheus@ops is not taking as much memory as eqiad), and there was a small memory spike, though not enough to cause troubles: dashboard

In terms of next steps, at least in the short term we should certainly keep an eye on things (we did get alerted for this by way of ThanosSidecarNoConnectionToStartedPrometheus). This quarter we'll definitely be working on upgrading Prometheus since we're three years behind upstream/debian versions

Happened again just now around 15:44, the ops prometheus instance in eqiad got OOM killed. Lines up with a k8s deploy, which I believe is what causes the memory usage spike (a whole bunch of new labels / metrics for prometheus to pick up)

Mentioned in SAL (#wikimedia-operations) [2024-01-08T17:18:58Z] <godog> wipe prometheus@k8s eqiad WAL and restart - T354399

@fgiunchedi I think we are seeing this in codfw now as well

Jan 09 08:12:22 prometheus2005 kernel: oom-kill:constraint=CONSTRAINT_NONE,nodemask=(null),cpuset=/,mems_allowed=0-1,global_oom,task_memcg=/system.slice/system-prometheus.slice/prometheus@k8s.service,task=prometheus,pid=676738,uid=110

and on prometheus2006 too

Jan 09 08:12:36 prometheus2006 kernel: Out of memory: Killed process 512589 (prometheus) total-vm:863293384kB, anon-rss:70213808kB, file-rss:0kB, shmem-rss:0kB, UID:110 pgtables:150304kB oom_score_adj:0

I am not sure what are remediation steps here.

Mentioned in SAL (#wikimedia-operations) [2024-01-09T08:20:30Z] <godog> set aside WAL for prometheus@k8s in codfw and restart - T354399

After a bit of fiddling I was able to build a Debian package for Prometheus 2.48.1 from upstream sources, and I'll be testing that in eqiad tomorrow

Mentioned in SAL (#wikimedia-operations) [2024-01-10T13:15:35Z] <godog> test prometheus 2.48.1 on prometheus1005 - T354399

The upgrade on prometheus1005 looks promising so far, memory usage is down (not half but not far off) and CPU usage also slightly down! Will monitor the situation

Mentioned in SAL (#wikimedia-operations) [2024-01-10T16:36:57Z] <godog> upgrade prometheus on prometheus2006 - T354399

Mentioned in SAL (#wikimedia-operations) [2024-01-12T08:40:11Z] <godog> upload and finish upgrade of prometheus 2.48 on all sites - T354399

I've also taken this chance to move the Prometheus repo to gitlab: https://gitlab.wikimedia.org/repos/sre/prometheus and set the gerrit repo as hidden, can be removed at any time (cc @LSobanski)

fgiunchedi claimed this task.

Optimistically resolving this since we're in a better spot with the Prometheus upgrade, left to do is the RAM upgrade in eqiad at T354684

Mentioned in SAL (#wikimedia-operations) [2024-03-07T17:28:12Z] <cwhite> set aside WAL for prometheus@k8s in eqiad and restart - T354399

Mentioned in SAL (#wikimedia-operations) [2024-03-07T17:43:48Z] <cwhite> set aside WAL for prometheus@k8s in codfw and restart - T354399

I think this happened again when prometheus@k8s was restarted to mitigate T343529: Prometheus doesn't reload or alert on expired client certificates

Interestingly, the WAL has more than doubled in size since we increased resources:

prometheus1006:~# du -sh /srv/prometheus/k8s/metrics/wal-*
5.0G	/srv/prometheus/k8s/metrics/wal-2024-01-08
11G	/srv/prometheus/k8s/metrics/wal-2024-03-07T17:36+00:00

Indeed the WAL grew quite fast (faster than I expected anyways) as the mw-on-k8s migration progressed (we're at ~50% now)

https://w.wiki/9QNk

2024-03-08-143227_2245x1752_scrot.png (1×2 px, 318 KB)

And similarly samples ingested increased ~2.5x

2024-03-08-143412_1499x1767_scrot.png (1×1 px, 95 KB)

Mentioned in SAL (#wikimedia-operations) [2024-03-20T19:22:18Z] <denisse> stopping the Prometheus service on all Prometheus instances to remediate Thanos Sidecar issues - T354399

Mentioned in SAL (#wikimedia-operations) [2024-03-20T19:26:30Z] <denisse> Moving the WAL directory to start with a fresh WAL - T354399

Mentioned in SAL (#wikimedia-operations) [2024-03-20T19:26:46Z] <denisse> Starting the Prometheus service - T354399

Thank you @andrea.denisse for taking a look!

I have spent some time today looking into this problem, for the wal replay issue we'll need to attempt dumping memory information from /debug/pprof while prometheus is replaying the WAL.

A likely related issue is the memory explosion which causes the OOM in the first place; below is the last two days of ingestion-related metrics for prometheus@k8s on prometheus1006, AFAICT the increase in sample ingested is related to new mw hosts coming online/being reimaged

2024-03-21-123845_2392x660_scrot.png (660×2 px, 99 KB)

Also related below is (aggregated across both prometheus100[56]) RSS of prometheus@k8s, notice the significant drop in RSS after the restart

2024-03-21-124020_2395x696_scrot.png (696×2 px, 204 KB)

To get a better idea of what's going on I've put a periodic (every 15m) dump of allocs goroutine and heap pprof profiles on prometheus1005 (a screen under my user)

Thank you for the investigation and for sharing these findings, @fgiunchedi.
The memory dumps from /debug/pprof during WAL replay seem like a promising lead. I can adjust our runbooks accordingly to add this step.

The correlation between the new mw hosts and the increase in sample ingestion could indeed be a significant contributor to the memory pressure we're observing. I wonder if we could implement deployment strategies like a Ramped Deployment gradually change the old instances to new instances on at a time.

On another note, have we considered setting up alerting based on specific memory usage thresholds or unusual increases in sample ingestion rates? Such alerts could serve as early warnings before reaching an OOM state.

I also think we could take a look at enabling swap on the Prometheus hosts. For ex. Prometheus1005 has 188G of RAM but only 976M of swap allocated. The persistent storage drive only has 31% of usage so allocating more disk space for swap usage seems reasonable and could allow the instances to handle the OOM.

Let's discuss further steps and any additional data we might need to gather. I'm particularly interested in your thoughts on potential memory optimization strategies to mitigate this issues.

Thank you @andrea.denisse for the suggestions! Let's indeed discuss further what are the best options going forward

Mentioned in SAL (#wikimedia-operations) [2024-03-25T13:17:15Z] <godog> bounce prometheus@k8s on prometheus2005 to diagnose OOM - T354399

Mentioned in SAL (#wikimedia-operations) [2024-03-25T13:28:19Z] <godog> bounce prometheus@k8s on prometheus2006 to diagnose OOM - T354399

Good news and bad news, in the sense that I can't reproduce the OOM in prometheus k8s in codfw, I suspect my fix at https://gerrit.wikimedia.org/r/1013515 to fetch less Envoy metrics significantly reduced load and thus replaying the WAL doesn't pose a memory problem anymore.

We need to do a run of prometheus restarts in light of https://phabricator.wikimedia.org/T360537 anyways, a good occasion to look out for more OOMs

I haven't observed OOMs related to WAL when doing a Prometheus rolling restart today, I'm optimistically resolving the task, though to be reopened if things change