Page MenuHomePhabricator

Collect HTTP statistics about load.php requests
Closed, ResolvedPublic

Description

In order to better understand how well ResourceLoader is performing, and to measure the impact of deployments and trends over time, I'd like to request we continuously aggregate metrics for load.php requests.

Specifically, requests and responses from Varnish to /w/load.php on all wiki domains (e.g. en.wikipedia.org/w/load.php?...).

  • Total count of load.php requests per minute.
  • Broken down by label(s):
    • Response http status code (e.g. HTTP 200, 304, or 500).
    • Whether request had a If-None-Match header.
  • Response byte size of HTTP 200 responses (Content-Length).

Use case is to be able to continuously answer the below questions. (e.g. in Grafana or elsewhere, showing trends and correlation to deployment events.)

  • How many (absolute number) requests were there to load.php globally per minute at any given time? (req.all.count)
  • How is the average response size per request changing? (resp.content-length)
  • What percentage of clients actually had a local cache for the request? (req.if-none-match.count)
  • What was the ratio between responses being cache hits and cache misses? (resp.http-200.count, resp.http-304.count)
Event Timeline

Krinkle raised the priority of this task from to Needs Triage.
Krinkle updated the task description. (Show Details)
Krinkle subscribed.
kevinator moved this task from Incoming to Medium on the Analytics-Backlog board.
kevinator set Security to None.

Change 222371 had a related patch set uploaded (by Ori.livneh):
Add varnish stats reporter for ResourceLoader requests

https://gerrit.wikimedia.org/r/222371

Change 222371 merged by Ori.livneh:
Add varnish stats reporter for ResourceLoader requests

https://gerrit.wikimedia.org/r/222371

ori claimed this task.
ori subscribed.

This is in the process of rolling out to all Varnishes. It should propagate everywhere within the next 20 minutes. The Graphite metric hierarchy has the prefix ResourceLoader.*; the rest should be self-explanatory.

We ran into some issues with the metrics. Re-opening as reminder to investigate and address.

We ran into some issues with the metrics. Re-opening as reminder to investigate and address.

What issues?

This comment was removed by Krinkle.
Krinkle added a subscriber: Catrope.

What issues?

Mainly two things observed:

  • A (high) presence of HTTP 204 responses. Several million, peaking throughout the day. I don't see how these can come from ResourceLoader.
  • (H/T @Catrope) There are more 304 responses than If-None-Match requests. Something doesn't add up.

This should be fixed now by @ori's patch:

Fix request-matching logic in varnishrls
https://gerrit.wikimedia.org/r/223522

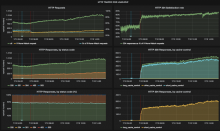
https://grafana.wikimedia.org/#/dashboard/db/resourceloader

Before:

Screen Shot 2015-07-08 at 10.16.36.png (1×2 px, 381 KB)

After:

Screen Shot 2015-07-08 at 12.13.57.png (1×2 px, 274 KB)

As requested by @ori and @Krinkle, here's my wishlist of statistics to collect:

  1. Collect # of requests/responses for each value of the Cache-Control (CC) header
  2. Graph INM rates and 304 rates separately for short/long CC expiries
  3. Collect request data (total # and INM %) and response data (total # and 304%) for traffic between the backend Varnishes and the Apaches

#1: We expect only two different values to occur for the Cache-Control header (for 2XX/304 responses): Cache-Control: public, max-age=300, s-maxage=300 ("short") and Cache-Control: public, max-age=2592000, s-maxage=2592000 ("long"). It would be interesting to see how many requests/responses are cacheable for a short vs long period of time, and it would also be interesting to validate whether these two values are indeed the only ones that occur in the wild (barring error/redirect responses). For requests, the value of the Cache-Control header in the corresponding response might not be available; in that case the presence/absence of the &version= parameter could be used as a proxy (long if present, short if absent). As an extension to this, we could also consider separating startup and non-startup requests (&modules=startup).

#2: It stands to reason that the traffic graphs we've built so far (total # of reqs, INM %, total # of responses, 304 %, INM satisfaction %) should be significantly different between short-cache and long-cache requests/responses. Graphing these rates separately for each category would let us identify whether this is true and what these differences look like. If our beliefs are correct and the two categories are very different, then the pattern that we're currently seeing is really the sum of two unknown patterns with unknown weights, and so our current graphs might not even be that meaningful. (Again, if CC response headers aren't available for requests, then we can use &version= as a proxy.)

#3: Our current request/response graphs are only about the traffic between clients and the frontend Varnishes. This tells us about the clients' perspective, which is ultimately what matters. So this tells us a lot about how the system performs but not as much about why it performs that way. If we collect and graph the same data for the traffic between the backend Varnishes and the Apaches, we'll be able to see how well Varnish is performing (the shape of backend traffic should be different from frontend traffic, and there are particular patterns I expect to see there). We'll also be able to graph cache hit rates without relying on X-Cache or other unreliable things in Varnish.

Things I would expect/hope to see:

  • I expect only two CC values to occur
  • I don't know what I should expect for short vs long in terms of relative volume; my gut says short will have greater volume, but I'm not sure
  • I expect most of the INM/304 traffic to be for short-expiry requests
  • If @Krinkle's theory about cache churn (T102578) is correct, we should see close to zero INM/304 traffic for long-expiry requests
  • I expect more INM/304 traffic and a higher satisfaction rate on the backend
  • I hope for relatively low request volume on the backend, and very very low volume for long-expiry requests
  • In other words, I expect most of the backend traffic to be 304s for startup and other unversioned things
  • I expect to see differences in patterns for long and short expiries on the frontend but little difference on the backend

For @Catrope's #1 wishlist item I'd recommend we fragment the existing metrics by an additional layer. I don't think we need separately kept metrics. We can maintain the current higher-level overviews by using a wildcard to skip/sum this intermediate level.

ResourceLoader.reqs.{all,if_none_match} becomes ResourceLoader.reqs.{version,noversion}.*.
ResourceLoader.resps.{httpStatus} becomes ResourceLoader.resps.{maxage,other}.*

Where "version"/"noversion" is based on the load.php url containing &version=.

And "maxage" is the max-age value of a header matching Cache-Control: public, max-age=X, s-maxage=X. And "other" for private stuff like "Cache-Control: private" (used by debug mode) and in theory any fringe responses using additional options like "no-store", or if max-age values don't match.

For flexibility and to easily discover different max-ages, I'd recommend we set those as properties directly (as long the above pattern matches). These can only be set by MediaWiki anyway (ResourceLoader doesn't support reflected [s]maxage query parameters).

Ok. Can you formulate a plan for how you'd act on this data? i.e., if the data showed X, we'd do Y; if it instead showed P, we'd do T, etc.

(And also: can you say what the goals are, in terms of cache hit rates, or some other metric? Identify what ought to be possible and set that as a goal.)

On the backend, we should see zero INM/304 traffic for versioned (long cache) requests, and very little 200 traffic and only right after a deployment. For unversioned (short cache) requests, the backend traffic should be low-ish consistent volume and overwhelmingly INM/304.

The cache hit rate (which we can compute by dividing backend numbers by frontend numbers) should be extremely high (>95%) for unversioned requests, and high (>85%) for versioned requests.

If these things (or other expectations in my original post) turn out not to be true, that's likely to indicate a problem that deserves more investigation.

But really, it's tough to say what the plan or expectations should be when we can't even see what's going on yet.

Change 224016 had a related patch set uploaded (by Ori.livneh):
varnishrls: segment responses by cache-control max-age

https://gerrit.wikimedia.org/r/224016

Change 224016 merged by Ori.livneh:
varnishrls: segment responses by cache-control max-age

https://gerrit.wikimedia.org/r/224016

Change 224016 merged by @ori:
varnishrls: segment responses by cache-control max-age

https://gerrit.wikimedia.org/r/224016

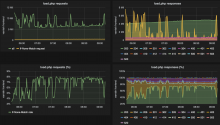
Awesome! I've updated the dashboard https://grafana.wikimedia.org/#/dashboard/db/resourceloader:

Screen Shot 2015-07-10 at 16.19.57.png (811×1 px, 223 KB)

The new cache_control values look realistic and already answer many of our questions. However I also see a 20% increase in the reported 304 satisfaction rate. The timeframe of that unexpected increase matches that of the cache_control metrics patch.

I don't see a similar traffic pattern in previous days so I assume this was caused by the patch. Did we unknowingly fix a bug, or is it a new bug?

Did we unknowingly fix a bug, or is it a new bug?

The former (fixed a bug). To validate, I ran:

$ varnishlog -c -C -mRxURL:^/w/load.php -mRxHeader:^if-none-match -iTxStatus -iRxURL -iRxHeader | grep TxStatus | python satisfied.py

where satisfied.py is:

import sys

satisfied = 0
for reqs, line in enumerate(sys.stdin):
    if 'c 304' in line:
        satisfied += 1
    if reqs % 1000 == 0:
        print('%.2f%%' % ((100.0 * satisfied) / reqs))

In the course of experimenting with this, I rolled out a buggy version that ran for four hours, between 2015-07-11 23:00 and 2015-07-12 03:00. Figures collected during this interval should be ignored.

I consider the current version stable and satisfactory. Before closing this as resolved, though, I'd like to have a short executive summary of what we learned so far. Assigning it to @Krinkle for that.

I consider the current version stable and satisfactory. Before closing this as resolved, though, I'd like to have a short executive summary of what we learned so far. Assigning it to @Krinkle for that.

Thanks. I'll try to be short.

Raw data

Ignoring data points we know to be inaccurate, the figures have been steady over the past 5 days.
From https://grafana.wikimedia.org/#/dashboard/db/resourceloader.

800K – 1.5 million load.php requests per minute. Daily low at 740K, peak at 1.53M.

  • ~35% of load.php requests carry an If-None-Match header.

The number of recorded requests matches the number of recorded responses within a margin of 0.0001%.

  • ~ 69% of load.php responses have HTTP status 200 OK.
  • ~ 31% of load.php responses have HTTP status 304 Not Modified.
  • ~ 0.018% of load.php responses were HTTP 301 redirects.

HTTP responses by cache-control:

  • ~ 35% of load.php responses have a long cache expiry.
  • ~ 65% of load.php responses have a short cache expiry.

HTTP 200 responses by cache-control:

  • ~ 49% of load.php HTTP 200 responses have a long cache expiry.
  • ~ 51% of load.php HTTP 200 responses have a short cache expiry.

HTTP 304 responses by cache-control:

  • ~ 3% of load.php HTTP 304 responses have a long cache expiry.
  • ~ 97% of load.php HTTP 304 responses have a short cache expiry.

HTTP 304 satisfaction rate: ~88% (304 responses as percentage of INM requests)

Conclusions

The 88% satisfaction rate isn't high. Long-expiry should have 100% satisfaction. Though these are not mutually exclusive because we don't fragment request stats by short/long expiry yet (based on version param). If we assume long-expiry satisfaction to be 100%, and 88% the average, we can infer the satisfaction rate of short-expiry responses through ((65*100)+(35*X))/100=88 where X = ~66%. A 66% satisfaction rate for the 5-minute short expiry resources isn't too bad.

Remember that clients should only make requests for resources that may be expired. So in the first 5 minutes or 30 days after receiving an HTTP response to a long- or short expiry resource respectively, no requests will be made. Not even a HTTP 304 roundtrip. We are therefore probably blind to a significant amount of local cache traffic that is very relevant to this picture. Perhaps we can instrument mw.loader.store for more details on this. I believe we already have some instrumentation of it, but it may not be collected yet or insufficiently detailed.

After the 5-minute expiry, browsers will still try an INM/304 trip. In most cases (implied 66%) they do still get 304 because we don't actually change the startup module and unversioned stylesheets that often. See also T96797.

Responses to clients without a primed cache (HTTP 200) are about 50-50 divided between long- and short expiry. I therefore assume that an average page view gets half its resources from long-expiry and half from short-expiry.

Responses to clients with a primed cache are very differently divided. Only 3% of their 304 responses are for long-expiry resources. I assume this means, clients with a cache never even touch the network for long-expiry resources. They go straight to local cache. This is good and preferred. The 3% is worth investigating. It should be 0% (for the same reason satisfaction should be 100%). I suspect this 3% might mean some clients have an outdated startup module. Or are otherwise making requests using 30-day old metadata (perhaps hardcoded somewhere; possibly third-party). After 30 days the local cache expires and they try a 304 roundtrip that fails because the server has a new version available. The server is guaranteed to have changed the version hash of everything after 1-2 weeks due to T102578.

The 301 redirects do not originate from ResourceLoader. They would've been intercepted by MediaWiki, Apache, or Varnish. All these layers enforce HTTPS. In this case I believe it's text-varnish.

The fact that only 35% of have INM headers is interesting. For the most part I don't think that figure is in under our control. It includes bots and headless spiders that may not have cache. Aside from bots, many users may've simply not visited that wiki before (load.php is fragmented by wiki; and the world population is growing), or they are using incognito/private browsing, or they're using a newly purchased device, or switched to a different browser, or they've recently purged their browser's overall cache for unrelated reasons, or their browser dropped the wiki domains' http cache per LRU (do any browsers do this?). It's hard to believe the aforementioned cases add up to 65% of our users. Worth investigating.

We do control this INM percentage for a small part. Namely that our long-expiry resources have unique urls, so they wouldn't show up as missed INM/200's but as non-INM 200s for a new url. Improving T102578 means long-expiry urls generated by the startup module live longer and should globally increase INM usage. It's possible that our tail of the cache invalidation each week takes more than a week to recover and that we actually never see its potential peak. Worth investigating by having a dummy resource with a 1-year expiry and seeing its INM/200/304 rate over the course of a month.

The 88% satisfaction rate isn't high. Long-expiry should have 100% satisfaction. Though these are not mutually exclusive because we don't fragment request stats by short/long expiry yet (based on version param). If we assume long-expiry satisfaction to be 100%, and 88% the average, we can infer the satisfaction rate of short-expiry responses through ((65*100)+(35*X))/100=88 where X = ~66%. A 66% satisfaction rate for the 5-minute short expiry resources isn't too bad.

Is it correct to say that the 304 satisfaction rate is the weighted average of the long and short rates, weighted by their proportion of total request volume? Wouldn't you have to weight by their proportion of INM request volume instead? We don't have that data, but I would guess it's more lopsided than 65-35, probably closer to the 97-3 split we see for 304s (though probably not quite that extreme), which would mean the short-expiry satisfaction rate would be much closer to 88%. Of course, if we collect data on whether INM requests are short or long (using &version= as a proxy), we can compute separate satisfaction rates directly as well, without reasoning about weighted averages.

Responses to clients without a primed cache (HTTP 200)

That's not what 200s are. 200 means that either the client had no cache, or that it had an out-of-date cache.

are about 50-50 divided between long- and short expiry. I therefore assume that an average page view gets half its resources from long-expiry and half from short-expiry.

...and for that reason I'm not sure that's a valid assumption.

Responses to clients with a primed cache are very differently divided. Only 3% of their 304 responses are for long-expiry resources. I assume this means, clients with a cache never even touch the network for long-expiry resources. They go straight to local cache. This is good and preferred. The 3% is worth investigating. It should be 0% (for the same reason satisfaction should be 100%). I suspect this 3% might mean some clients have an outdated startup module. Or are otherwise making requests using 30-day old metadata (perhaps hardcoded somewhere; possibly third-party). After 30 days the local cache expires and they try a 304 roundtrip that fails because the server has a new version available. The server is guaranteed to have changed the version hash of everything after 1-2 weeks due to T102578.

Yeah, it's good to see that 304 traffic for long-expiry resources is so low. I have a theory as to where this 3% comes from:

In Chrome, open an incognito window, open the inspector, make sure the "Disable cache while DevTools is open" setting is not set (i.e. cache is enabled), go to the Network pane, set the filter to Script, then load a Wikipedia page. You'll see 200 responses, and you'll see that the request headers do not contain an If-None-Match header, nor a Cache-Control header (the response headers do have CC, of course). This is a load with completely cold cache.

Then reload the page by pressing enter in the address bar. Depending on how long you waited, the startup module response will either be a 304 from the network or a 200 from cache, and the other requests will be 200 from cache. There will also be fewer requests overall, because of localStorage. If you saw 304s, their request headers had INM but no CC. So far so good.

Then reload the page by pressing F5 or clicking the reload arrow. You will see everything is a 304, with request headers containing both INM and Cache-Control: max-age=0. Varnish appears to ignore this header (doesn't go back to the backend), since I got X-Cache headers with frontend hit in them.

Now hard-refresh the page by pressing Ctrl+F5 (or holding Ctrl while clicking the reload arrow). You will see 200s, with request headers containing no INM headers and containing Cache-Control: no-cache. Again, Varnish ignores this (I saw frontend hit in X-Cache again), but it can't serve a 304 because the client did not supply an INM header.

So perhaps enough of our clients use F5 often enough that it amounts to 3% of our traffic? I wonder how many of those long-expiry 304s had Cache-Control: max-age=0 in their request headers, and if other browsers expose similar traces of user refreshes in their request headers.

As a side note, I found T105657: The 5min expiry for load.php/startup should be relative to request time instead of cache time while performing this experiment.

The 301 redirects do not originate from ResourceLoader. They would've been intercepted by MediaWiki, Apache, or Varnish. All these layers enforce HTTPS. In this case I believe it's text-varnish.

It's a vanishingly small percentage anyway. These are probably non-MW-originated load.php hits, since MW has used protocol-relative URLs for a long time. I wouldn't be surprised if gadgets or other 3rd party code was abusing load.php for something, using hard-coded HTTP URLs.

The fact that only 35% of have INM headers is interesting. For the most part I don't think that figure is in under our control. It includes bots and headless spiders that may not have cache. Aside from bots, many users may've simply not visited that wiki before (load.php is fragmented by wiki; and the world population is growing), or they are using incognito/private browsing, or they're using a newly purchased device, or switched to a different browser, or they've recently purged their browser's overall cache for unrelated reasons, or their browser dropped the wiki domains' http cache per LRU (do any browsers do this?). It's hard to believe the aforementioned cases add up to 65% of our users. Worth investigating.

It's worth noting that these stats are for overall requests, and there are multiple (and a variable number of) requests per page view. If we want to reason about what proportion of clients has a hot cache, numbered focused solely on startup module requests may be more suitable.

We do control this INM percentage for a small part. Namely that our long-expiry resources have unique urls, so they wouldn't show up as missed INM/200's but as non-INM 200s for a new url. Improving T102578 means long-expiry urls generated by the startup module live longer and should globally increase INM usage. It's possible that our tail of the cache invalidation each week takes more than a week to recover and that we actually never see its potential peak. Worth investigating by having a dummy resource with a 1-year expiry and seeing its INM/200/304 rate over the course of a month.

That's a clever way to investigate this, as long as all the variables are controlled (guarantee that the resource's E-Tag / version hash is stable, guarantee it's never combined with other things).

This is all well and good, but I worry that digging any deeper into the caching behavior of ResourceLoader would be academic and impractical. The question we're answering seems to be: "is ResourceLoader doing what we expect it to do?". The question we ought to answer, in my opinion, is "what should ResourceLoader do?". Since about a month ago, some four-fifths of all client connections are using a protocol that barely existed when ResourceLoader was created, and which ResourceLoader was not designed to exploit. A lot of the work ResourceLoader is doing (like batching requests, generating combined CSS/JS payloads, inlining interface images) is now actively harmful to the majority of clients. I encourage you to think bigger and to resist the temptation to spend too much time squinting at minutiae.

[..] these are not mutually exclusive because we don't fragment request stats by short/long expiry yet (based on version param). If we assume [..]

Wouldn't you have to [..]. if we collect data on whether INM requests are short or long (using &version= as a proxy), we can compute separate satisfaction rates directly as well, without reasoning about weighted averages.

Yeah, I knew I was taking a risk trying to approximate. We're saying the same thing though about using "version" to divide incoming requests.

Responses to clients without a primed cache (HTTP 200)

That's not what 200s are. 200 means that either the client had no cache, or that it had an out-of-date cache.

Thanks. I mixed up INM requests and HTTP 200 responses.

This is all well and good, but I worry that digging any deeper into the caching behavior of ResourceLoader would be academic and impractical. The question we're answering seems to be: "is ResourceLoader doing what we expect it to do?". The question we ought to answer, in my opinion, is "what should ResourceLoader do?". Since about a month ago, some four-fifths of all client connections are using a protocol that barely existed when ResourceLoader was created, and which ResourceLoader was not designed to exploit. A lot of the work ResourceLoader is doing (like batching requests, generating combined CSS/JS payloads, inlining interface images) is now actively harmful to the majority of clients. I encourage you to think bigger and to resist the temptation to spend too much time squinting at minutiae.

HTTP2/SPDY does open new doors, but it's not that different in practice. I'd love to prove my feeling wrong. But we still have the same underlying primitives as before (INM/304). Batching seems to be the main difference here, which is relatively simple to disable in ResourceLoader.

It's the primitives that worry me. We've got low hanging fruit in our cache handling which is hurting SPDY and non-SPDY alike. Resources have a short expiry, roll over quickly (lack of versioning; T96797), long expiry rolls over too (due to trashing; T104950; T102578), both cause resources to be frequently rebuild.

The MobileFrontend less/css style module, for example, is built 50x every minute. That's all wiki/lang combinations rolling over continuously at 5min intervals. Each mobile style takes 250ms to compile in Lessc. They're part of a user-facing request that contains other stuff too. That's a big synchronous hit for mobile page views.

SPDY already removes slow-start for each connection, and it puts text, static and load.php requests in a shared connection. The various load.php requests on a single page are also shared.

I'm skeptical about additional SPDY gains if we split up further. Server-side it will reduce cache fragmentation, but client-side it could make no difference. We already store modules separately in local cache (in localStorage by module-version, or soon in CacheStorage by url; T101732). This is superior to 304 roundtrips because local cache has no latency and isn't subject to intermittent connectivity issues.

So the area left is cache misses. I hope SPDY can help there. Is there a difference between loading 1 large request or 10 smaller ones in parallel? (assuming both are Varnish hits). In theory it may get more bandwidth using separate connections, except SPDY is about sharing the same connection. I agree batching seems redundant and disabling it would allow us to use native HTTP local cache; But is it harmful as-is?

Either way, these are mere guesses without data. I agree we must try disable batching, absolutely. Even if not harmful, it's redundant and we should let native handle it. But that feels more like technical debt than a current performance gain. We should prioritise and focus one thing at a time. I think it'd be more beneficial for everyone (incl. SPDY) to resolve T96797 and T104950 first.

I feel there's limited benefits waiting for us in SPDY– besides the obvious benefits of using it for our existing requests, which we already do. We saw the positive impact SPDY made in NavTiming metrics as result of enabling HTTPS everywhere. Around June 16th, median pageLoadTime went down from 2.0s to 1.6s. And p95 mean from 13s to 10s.

The browsers' pre-fetcher can do next to nothing right now because load requests are not inlined, they're not discoverable. That's an artefact of needing live versions, live dependency resolution, ordering, and de-duplication. I expect optimising for the pre-fetcher will give us a notable speed gain.

Perhaps we can brainstorm in Mexico and SF coming weeks about a radically different design for ResourceLoader with the explicit goal to support inlining of requests as proper script tags. Let's find a way to make that work. We'd also un-batch them, and use async on the elements.

However this will require fundamentally changing the underlying OutputPage interface and registry model. I suspect it will also require ESI. (And a fallback for third-parties as post-processing step atop file cache.)