Thought: avoid the temptation to micro-optimize by setting an ambitious but realistic goal.
Description
Related Objects
Event Timeline
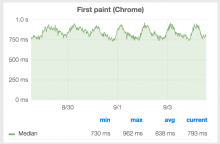
We're pretty close to achieving this now that rMWd7905627fdc3: resourceloader: Async all the way has rolled out. It's too early to say for sure, but it looks like the new norm will for the five-minute-window moving median to fluctuate between 850ms - 1050ms, depending on the time of day. Shaving another 150ms off of first paint time at peak hours should be doable.
It seems to have gotten even better lately. It only slightly goes over 900 during peak hours.
Following rMWd790562, median firstPaint was around 850ms low and 1050ms peak.
Following Ori's script/style order optimisations (e.g. 09537e83e7) median firstPaint is now around 730ms low and 930ms peak.
Last week we discussed in the performance team meeting that we need to better define this goal.
We've certainly achieved that our software can now render first paint in under 900ms (median) for all our traffic combined at a certain point in time (e.g. not just for some users). However daily traffic fluctuation does make it go above 900ms every day.
Considering it is a median (and not individual data points, which would be infeasible), I think it is within our reach to achieve persistent sub-900ms first paint (where the daily peak does not go over 900ms). So let's keep this open a little longer?
Having said that, we do need to decide which measure to track (coal vs statsd). So far in this task we've been referring to the coal metric (which is a median). However looking at the firstPaint.median from statsd in Graphite, it doesn't match exactly. You'd expect it to vary more (due it not being a 5-min moving median like coal), but it actually varies less. https://grafana.wikimedia.org/dashboard/db/navigation-timing
According this one, we've not exceeded 860ms at any point in the last 7 days:
Compared to the metric from Coal:


