Page MenuHomePhabricator

Investigate sample cube pageview_count vs unsampled log pageview count [13 pts] {hawk}
Closed, ResolvedPublic

Assigned To
Authored By
JAllemandou
Aug 13 2015, 9:34 AM
Referenced Files
F2645160: diff_percent_hive_cube_no_outliers.png
Sep 29 2015, 8:36 PM
F2645179: boxplot_by_hour.png
Sep 29 2015, 8:36 PM
F2624415: diff_percent_hive_cube_spider.png
Sep 21 2015, 7:55 PM
F2624243: diff_percent_hive_cube.png
Sep 21 2015, 7:55 PM
F2624241: diff_hive_cube.png
Sep 21 2015, 7:55 PM
F2624413: diff_hive_cube_no_spider.png
Sep 21 2015, 7:55 PM

Description

As per Tilman Bayer:

Hi Kevin and Dan,

thanks again for taking the time last week to explain how to retrieve pageview from Hive! It worked out well and I was able to publish the quarterly report on schedule on July 30. (And BTW I also got my access to Hue sorted out this week with the help of Andrew O.)

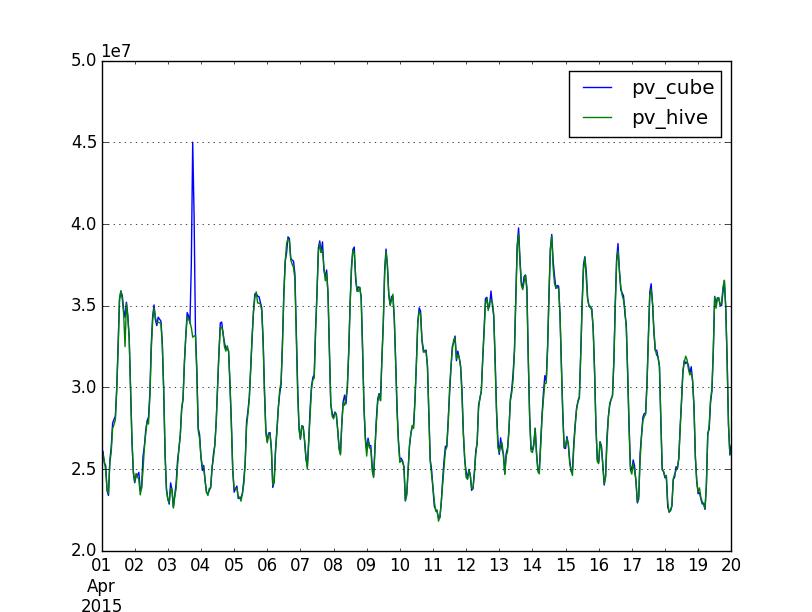
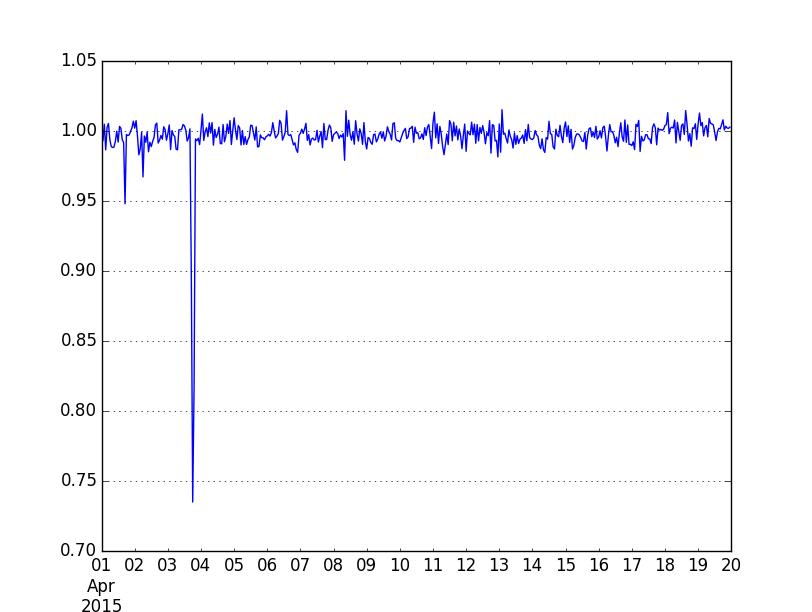
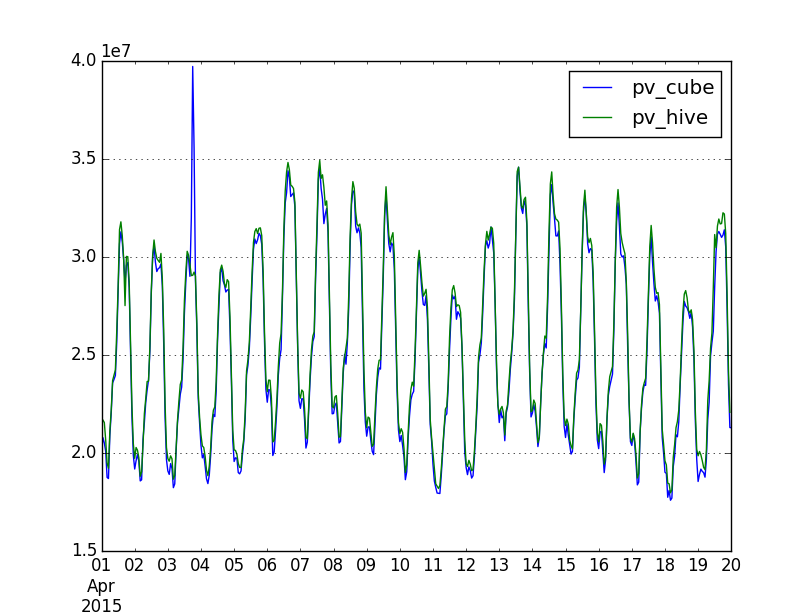
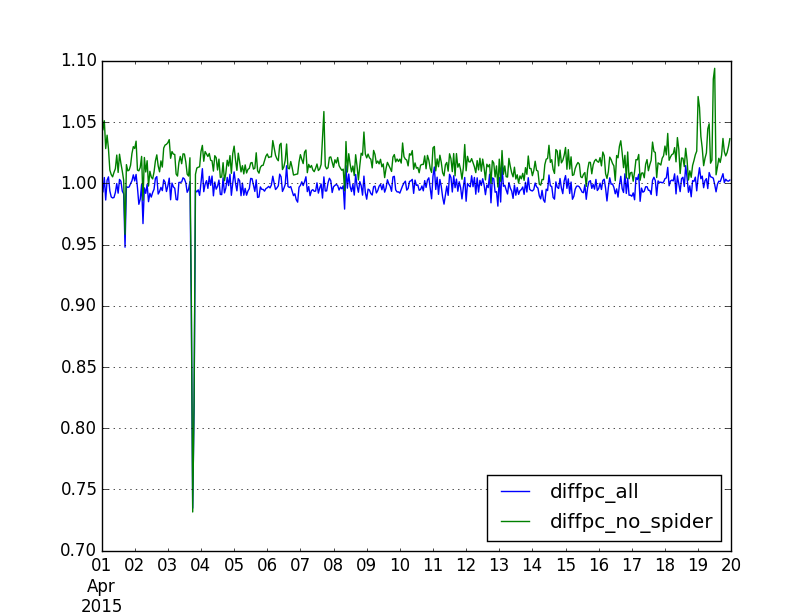
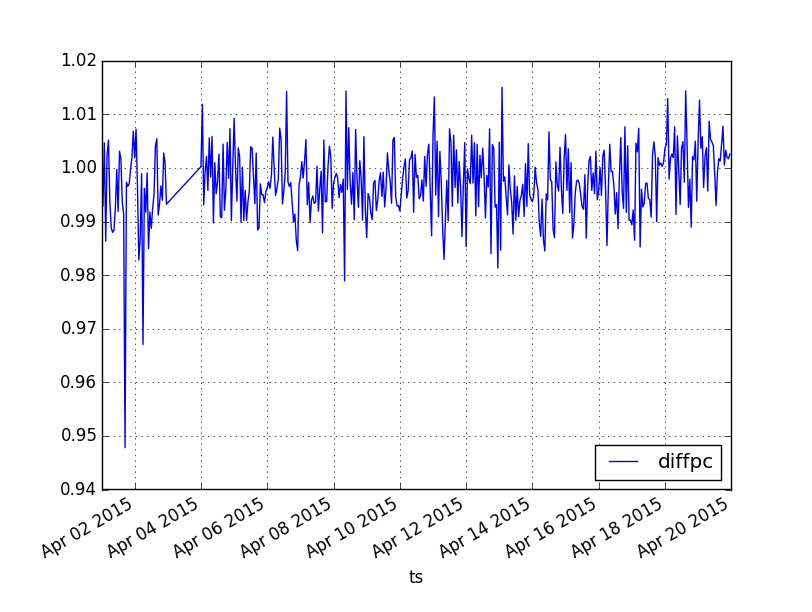
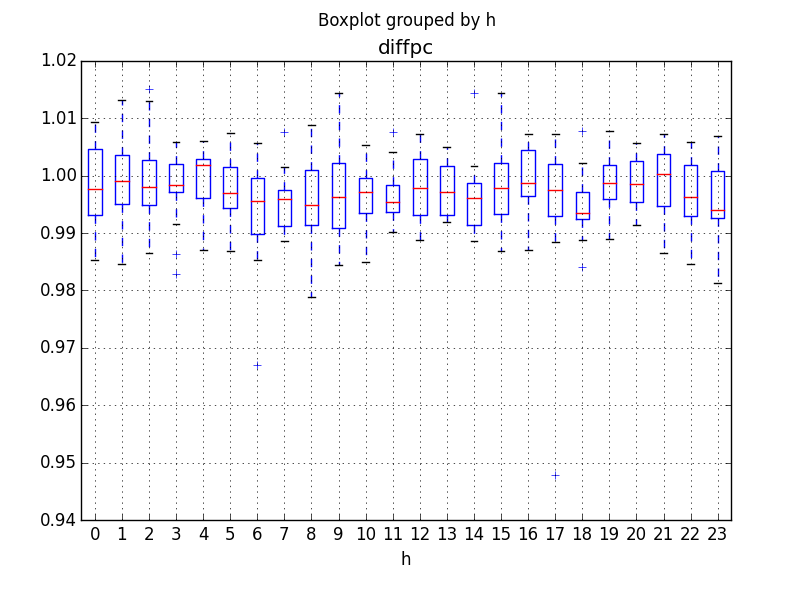
As envisaged, I did some spot checks to see if the new def sampled PV data I had used for the Q3 report (cube 0.5, back then via Pentaho) matches with the new def unsampled PV data on Hive. Picking two days during the overlap in April 2015:

Example #1:

mysql:research@analytics-store.eqiad.wmnet [staging]> select sum(pageviews) from pageviews05 where timestamp between '2015-04-15 00:00:00' and '2015-04-16 00:00:00' and is_spider = 0;
+----------------+

sum(pageviews)

+----------------+

634431000

+----------------+

BUT:

hive (wmf)> select sum(view_count) from projectview_hourly where agent_type <> 'spider' and year=2015 and month=04 and day=15;
622049519

Example #2:

mysql:research@analytics-store.eqiad.wmnet [staging]> select sum(pageviews) from pageviews05 where timestamp between '2015-04-16 00:00:00' and '2015-04-17 00:00:00' and is_spider = 0;
+----------------+

sum(pageviews)

+----------------+

626001000

+----------------+

BUT

hive (wmf)> select sum(view_count) from projectview_hourly where agent_type <> 'spider' and year=2015 and month=04 and day=16;
616117283

(I also added these examples to our Etherpad at https://etherpad.wikimedia.org/p/analytics-notes , but feel free to move it to a more appropriate place - not sure if it merits a Phabricator task.)

I didn't have time to look further into these discrepancies before the publication of the report, which is why the Q3 and y-o-y trend data in the quarterly scorecard is marked as "N/A" in the pageviews section.

But it would still be good to find out the reason. IIRC you said that these two databases are based on the same (iteration of the new) pageview definition. Are we certain that both use the same timezone? And what was the sampling method - was it realized via counters, or did it rely on random number generators?

Wikidata doesn't make the difference (200k view_count vs 10m missing) so it would be good to investigate in spider or projects differences.

Event Timeline

JAllemandou raised the priority of this task from to Needs Triage.
JAllemandou updated the task description. (Show Details)
JAllemandou added a project: Analytics-Backlog.
JAllemandou subscribed.
Milimetric moved this task from Incoming to Radar on the Analytics-Backlog board.
Milimetric set Security to None.

As suggested in the email thread, here are some comparisons to help narrowing down the source of the discrepancies.

First, to determine the overlap as April 1 to April 19 (if one only considers full days):

Sampled (old):

mysql:research@analytics-store.eqiad.wmnet [staging]> SELECT MAX(timestamp) FROM pageviews05;
+---------------------+
| MAX(timestamp)      |
+---------------------+
| 2015-04-20 06:00:00 |
+---------------------+

vs. unsampled (new):

hive (wmf)> SELECT MIN(concat(year,"-",LPAD(month,2,"0"),"-",LPAD(day,2,"0")," ",LPAD(hour,2,"0"))) FROM projectview_hourly WHERE year=2015;
...
2015-04-01 00

Daily differences

datesampled (pageviews05)unsampled (projectview_hourly)sampled/unsampled
4/1/2015707994000703754393100.60%
4/2/2015695838000691980785100.56%
4/3/2015710488000685283454103.68%
4/4/2015675997000675118881100.13%
4/5/2015701604000699149260100.35%
4/6/2015762081000759857386100.29%
4/7/2015766895000764488513100.31%
4/8/2015760840000758943357100.25%
4/9/2015739881000737156321100.37%
4/10/2015686692000685136394100.23%
4/11/2015657947000656584400100.21%
4/12/2015710316000708321238100.28%
4/13/2015751991000748829169100.42%
4/14/2015751630000747917929100.50%
4/15/2015734909000732286176100.36%
4/16/2015735386000733084619100.31%
4/17/2015693636000691541783100.30%
4/18/201564887000064961263299.89%
4/19/201571231900071411373499.75%
Sum (April 1-19)1360531400013543160424100.46%

Kind of weird how the sampled views are mostly overcounting and only undercounting in the last two days. One could do an hourly plot for say the last four days to see if there was a sudden drop of some kind. Then again, finding the reason for that drop would likely not resolve the differences entirely.

Data obtained via:

tbayer@stat1003:~$ mysql --defaults-file=/etc/mysql/conf.d/research-client.cnf -hanalytics-store.eqiad.wmnet --database staging --batch --execute "SELECT LEFT(timestamp, 10) AS date, SUM(pageviews) FROM pageviews05 WHERE timestamp>='2015-04' GROUP BY date;"

(sampled) and (unsampled:)

hive (wmf)> SELECT CONCAT(year,"-",LPAD(month,2,"0"),"-",LPAD(day,2,"0")) as date, SUM(view_count), year, month, day FROM wmf.projectview_hourly WHERE (year=2015 AND month=4 AND day<20) GROUP BY year, month, day;

Desktop/mobile web/apps
Sampled:

mysql:research@analytics-store.eqiad.wmnet [staging]> SELECT access_method, SUM(pageviews) AS views FROM pageviews05 WHERE timestamp BETWEEN '2015-04-01' AND '2015-04-20' GROUP BY access_method;
...
+---------------+------------+
| access_method | views      |
+---------------+------------+
| desktop       | 9000440000 |
| mobile app    |  110292000 |
| mobile web    | 4494582000 |
+---------------+------------+

Unsampled:

hive (wmf)> SELECT access_method, SUM(view_count) AS views FROM wmf.projectview_hourly WHERE year=2015 AND month=4 AND day<20 GROUP BY access_method;
access_methodviews
desktop8916696055
mobile app138151343
mobile web4488313026

So in this timespan the sampled and unsampled views differ for all three categories - but much more so for the apps than for desktop and mobile web. Again, it would be nice to know more about the sampling method before investigating further.

Wikidata

Sampled:

mysql:research@analytics-store.eqiad.wmnet [staging]> SELECT SUM(pageviews) FROM pageviews05 WHERE timestamp BETWEEN '2015-04-01' AND '2015-04-20' and project = 'wikidata';
+----------------+
| SUM(pageviews) |
+----------------+
|       34844000 |
+----------------+

Unsampled:

hive (wmf)> SELECT SUM(view_count) FROM wmf.projectview_hourly WHERE year=2015 AND month=4 And day<20 AND project = 'wikidata';

Result: 34762904

This was just for double-checking - as Joseph said above, we already ruled out the possibility that Wikidata views are missing entirely (as they were apparently from an earlier version of the cube data).

Interesting analysis !
It would also be nice to know if there are differences among projects (projects listed in only one of the dataset for instance, or big discrepencies between the two datasets in the same project).

Interesting analysis !
It would also be nice to know if there are differences among projects (projects listed in only one of the dataset for instance, or big discrepencies between the two datasets in the same project).

Yes, there are - I already did a cursory check on that last week, and some smaller projects with only a few hundred or thousand pageviews were missing. That's not terribly surprising though with an 1:1000 sample. I'm now going to check which are the biggest missing ones.

In the meantime, Dario mentioned https://trello.com/c/Xvp93j8p/446-high-data-qa-of-legacy-vs-new-pv-via-udf to me, where @Ironholds had examined sampled vs. unsampled discrepancies in January (the cyan/purple lines in the graph). Oliver, was that the up to 6% difference example you had mentioned last week?

On the other hand, I noticed that Oliver's recent report for T108895 (figure 1) compared sampled and unsampled total pageviews from May to August 2015, and judged the differences not substantial for the purposes of that report. From eyeballing the graph there, it seems that the differences reached up to about half a percent, too, but perhaps less often than here in April.
In any case, I understand that the sampled and unsampled numbers there come from two other databases, namely pageview_hourly (unsampled, since May) and another one that's not on Hive (for the sampled data covering a longer timespan, I guess that comes directly from Kafka). pageview_hourly seems to agree exactly with projectview_hourly which was used here (I spot-checked for some days). So it might be interesting to know if there are differences between the two sampled ones (pageviews05 and the one that's not on Hive).

OK, it seems we have two first culprits: mediawiki.org and wikimediafoundation.org didn't make it into the sample very often...:

projectsampled (pageviews05)unsampled (projectview_hourly)
mediawiki10007459727
wikimediafoundation05771280

Data obtained via:

hive (wmf)> SELECT project, SUM(view_count) AS views FROM wmf.projectview_hourly WHERE year=2015 AND month=4 And day<20 AND (project = 'wikimediafoundation' OR project = 'mediawiki') GROUP BY project ORDER BY views DESC LIMIT 1000;
tbayer@stat1003:~$ mysql --defaults-file=/etc/mysql/conf.d/research-client.cnf -hanalytics-store.eqiad.wmnet --database staging --batch --execute "SELECT project, SUM(pageviews) AS views FROM pageviews05 WHERE timestamp BETWEEN '2015-04-01' AND '2015-04-20' AND (project = 'wikimediafoundation' OR project = 'mediawiki') GROUP BY project ORDER BY views DESC"

And outreach.wikimedia is another project that is missing in the sampled views (pageviews05) but present in the unsampled projectview_hourly.
There was an discussion on the Analytics mailing list earlier this week about the fact that this domain was added to the pageview definition, which appears to have happened on April 17, 2015. I first thought that this corresponds to the observation above (T108925#1542170 ) that the sampled views were overcounting from April1-17 and only undercounting on April 18-19. But actually outreach.wikimedia is present earlier too; I guess because the data was regenerated retroactively after the change.

dateunsampled views (projectview_hourly) for outreach
4/1/201512672
4/2/201511152
4/3/201512985
4/4/20158837
4/5/20157464
4/6/201512942
4/7/201513947
4/8/201512884
4/9/201514027
4/10/201517783
4/11/201511245
4/12/201512465
4/13/20159400
4/14/201510767
4/15/201516051
4/16/201515265
4/17/201511982
4/18/201511056
4/19/20159762

Data obtained via

hive (wmf)> SELECT CONCAT(year,"-",LPAD(month,2,"0"),"-",LPAD(day,2,"0")) as date, SUM(view_count), year, month, day FROM wmf.projectview_hourly WHERE (year=2015 AND month=4 AND day<20)  AND project='outreach.wikimedia' GROUP BY year, month, day;

and

tbayer@stat1003:~$ mysql --defaults-file=/etc/mysql/conf.d/research-client.cnf -hanalytics-store.eqiad.wmnet --database staging --batch --execute "SELECT SUM(pageviews) FROM pageviews05 WHERE project LIKE 'outreach%'"

SUM(pageviews)
NULL

Unfortunately, the discovery of these three differing domains does not resolve the sampled/unsampled discrepancy - on the contrary, it is now even a bit larger than assumed (recall that the sampled number was already higher in that timespan). It's quite a mess ...

OK, it seems we have two first culprits: mediawiki.org and wikimediafoundation.org didn't make it into the sample very often...:

projectsampled (pageviews05)unsampled (projectview_hourly)
mediawiki10007459727
wikimediafoundation05771280

Data obtained via:

hive (wmf)> SELECT project, SUM(view_count) AS views FROM wmf.projectview_hourly WHERE year=2015 AND month=4 And day<20 AND (project = 'wikimediafoundation' OR project = 'mediawiki') GROUP BY project ORDER BY views DESC LIMIT 1000;
tbayer@stat1003:~$ mysql --defaults-file=/etc/mysql/conf.d/research-client.cnf -hanalytics-store.eqiad.wmnet --database staging --batch --execute "SELECT project, SUM(pageviews) AS views FROM pageviews05 WHERE timestamp BETWEEN '2015-04-01' AND '2015-04-20' AND (project = 'wikimediafoundation' OR project = 'mediawiki') GROUP BY project ORDER BY views DESC"

PS: On the other hand, in the previous iteration (0.4) of the Cube data, wikimediafoundation.org was present, albeit with implausibly low numbers: T51266#1045802 . FWIW.

Also, it seems the difference on mediawiki.org and wikimediadoundation.org doesn't account for the total of missing data: it sums up to ~12M for the 2015-04-01->2015-04-20 period, while the original discrepency is ~10M a day.
I still wonder :(

Also, it seems the difference on mediawiki.org and wikimediadoundation.org doesn't account for the total of missing data: it sums up to ~12M for the 2015-04-01->2015-04-20 period, while the original discrepency is ~10M a day.
I still wonder :(

As I said, the sign is wrong too, i.e. including the pageviews from these two domains during this timespan would increase rather than decrease the discrepancies anyway.

Have you considered looking at the codebase used to retrieve this,
identifying discrepancies, and, in the absence of discrepancies, just
rerunning a sample and comparing agianst /that/?

@Ironholds that seems like a good idea. From a product perspective, I am okay with <5% random discrepancy, but if its non-random that presents more of a problem. @JAllemandou can you help us move forward so that we can send out weekly and monthly trend reports that include ~ accurate historical data?

@Tbayer, what projects are missing? mediawiki.org and wikimediafoundation.org don't fit into Reading objectives enough that I think their absence should be a blocker.

@Ironholds that seems like a good idea. From a product perspective, I am okay with <5% random discrepancy, but if its non-random that presents more of a problem. @JAllemandou can you help us move forward so that we can send out weekly and monthly trend reports that include ~ accurate historical data?

Yes, if the discrepancies could be explained by the randomness of the sampling method, that wouldn't be an issue. However, since asking about that method above, I've been told that sampling is implemented by a counter on the Varnish servers (correct?). And in that case, the difference between sampled and unsampled numbers for total pageviews during a certain period (like for the "Daily differences" table above) should never exceed the number of servers times the sampling factor, and would be much smaller in most cases. Here, this theoretical limit would be less than a million (1000 servers x counting every 1000th view). But the discrepancies in the "Daily differences" table are considerable larger than that.

If that's not true and the sampling is done via a random number generator instead (i.e. every pageview has the same a priori probability to be counted in the sample), the expected sampling inaccuracy can be estimated as a binomial proportion confidence interval - I could calculate that for the example discrepancies above, but they already seem way too large in that case too.

@Tbayer, what projects are missing? mediawiki.org and wikimediafoundation.org don't fit into Reading objectives enough that I think their absence should be a blocker.

Certainly, but the problem is rather that they are present in one dataset (projectview_hourly, the new unsampled one) but not the other (pageviews05, which we would like to use for historical comparison). I'm fine working with or without these smaller non-content wikis, but it should be consistent.

Well if the goal is perfect consistency you're never getting it; the pageview definition changes over time and some of those changes control what projects are included.

@JKatzWMF I can try to help :)
I am currently computing the daily pageview / webrequest rate for august, to see if there could be big differences daily (I think it could, actually).
Please let's discuss around the path to follow, and how I could help.

I am currently computing the daily pageview / webrequest rate for august, to see if there could be big differences daily (I think it could, actually).

Please let's discuss around the path to follow, and how I could help.

@JAllemandou, @Tbayer is running this analysis. Can the two of you figure out what is necessary to resolve any meaningful, directional/biased discrepancies. In the short-term the previous year is required, but I believe the longer term goal is that at any given time we should be able to generate (or append to an existing) table of pageviews by project, by country and by platform since at least 2010.

Regarding the addition or subtraction of a property, I suggest that @Tbayer remove the projects that are not in the historical analysis from your current analysis (provided they are small projects).

As mentioned above, adding or removing these small projects does not resolve the discrepancies.

We still have not understood the reason for these differences at all, and while we may find out that perfect consistency can't be achieved, I don't think that we should use the pageviews05 table for historical comparisons without a better understanding, one that goes beyond a vague conjecture that maybe the pageview definition changed.

@JAllemandou: thanks, let us know what you find out!
Alternatively, some days ago @Milimetric kindly shared sampled UDP pageviews on Hive in the milimetric.webrequest_sampled table, which goes back to June 30, 2014. If that's compatible, we could investigate using it instead, for y-o-y comparisons if not longer term ones.

@Tbayer: nothing great from the pageview / webrequest ratio. It is pretty stable, with bumps every now and then, but nothing big enough to explain a difference in sampling I think.
@Tbayer: Please ping me today when you're online, to have a chat around the issue. Thanks !

@Tbayer: that table was just loaded to answer some answers from legal. I won't be keeping it updated and will probably delete it after you're done with it. But I think we should indeed find whatever data we have that reaches the furthest back in history, and load it into a table that will be updated going forward. That seems like a good approach to the worse but still valuable historical data.

I've been told that sampling is implemented by a counter on the Varnish servers (correct?).

Nope! Not correct.

If that's not true and the sampling is done via a random number generator instead (i.e. every pageview has the same a priori probability to be counted in the sample),

Currently, Hive is sampling across all webrequest via:

TABLESAMPLE(BUCKET 1 OUT OF 1000 ON rand())

This means that every webrequest in a given hour has the same likely hood of being sampled, since this works across all webrequest. Sampling is not done on varnish hosts.

...

Currently, Hive is sampling across all webrequest via:

TABLESAMPLE(BUCKET 1 OUT OF 1000 ON rand())

This means that every webrequest in a given hour has the same likely hood of being sampled, since this works across all webrequest. Sampling is not done on varnish hosts.

(As I just said on IRC too:)

If sampling is done hourly, that also means that the sampling errors will be larger. Above I had estimated that this effect can't explain the discrepancies, but I was looking at the daily numbers as one sample, which now turns out not to be true. Will check again for hourly.

@JKatzWMF, @Tbayer : Please let me know if this explains enough :)

Some data on differences from hive vs pageview05 (I call it cube) data on April month (1st to 20th because pageview05 doesn't contain data after the 20th).

First plots of hourly datasets, counts and percent differences:

diff_hive_cube.png (612×812 px, 86 KB)

diff_percent_hive_cube.png (612×812 px, 38 KB)

It shows almost no difference between hive and cube, except for three hours (2015-04-03, hours 17/18/19) where the cube data diverges strongly.

From a project perspective, the differences concur with what @Tbayer has found

    • mediawiki project is really more represented in hive than in cube
  • some miss-transformation in cube, like m.wikisource or m.wikidata not transformed into [wikisource + access_method = mobile]

Now some more interesting thing: spiders tagging.

diff_hive_cube_no_spider.png (612×812 px, 92 KB)

Here we can see a difference between hive and cube when we only consider no-spiders.
The chart below show the ratio (hive/cube) considering all agent types and no-spider only agent types.

diff_percent_hive_cube_spider.png (612×812 px, 68 KB)

We can see a clear difference between hive and cube: hive removes less spiders.

An update in code should reduce this difference starting September 17th see (here).

@Tbayer, @JKatzWMF : I move this task to done since you have not commented in negative ways :)

Milimetric renamed this task from Investigate sample cube pageview_count vs unsampled log pageview count to Investigate sample cube pageview_count vs unsampled log pageview count [5 pts].Sep 24 2015, 3:39 PM
Milimetric added a subscriber: ggellerman.

@JKatzWMF, @Tbayer : Please let me know if this explains enough :)

Thanks Joseph! I spent some time looking into this, and to be honest, I am a still bit confused about what exactly you found and changed, so I appreciate your offer to explain it a bit further. Remarks inline.

Some data on differences from hive vs pageview05 (I call it cube) data on April month (1st to 20th because pageview05 doesn't contain data after the 20th).

First plots of hourly datasets, counts and percent differences:

diff_hive_cube.png (612×812 px, 86 KB)

diff_percent_hive_cube.png (612×812 px, 38 KB)

It shows almost no difference between hive and cube, except for three hours (2015-04-03, hours 17/18/19) where the cube data diverges strongly.

But that's the same information as in the "daily differences" table posted above on Aug 15, just presented in graphical form - correct?

Even disregarding the 3.7% outlier on April 3, for which we still have no explanation (or do we?), I would not characterize a 0.5% difference on other days as "almost nothing". Sure, if we could establish that the difference is at most 0.5% and understand its reasons fairly well, that would be tolerable for some of the analyses we want to do. But that doesn't seem to be the case now - rather, these observed differences from a small overlap window should be seen as indicators of a potentially larger problem, especially since they don't seem to follow a consistent pattern (e.g. Cube suddenly turning from over- to undercounting after April 17).

From a project perspective, the differences concur with what @Tbayer has found

  • mediawiki project is really more represented in hive than in cube

As discussed, including mediawiki.org in cube would have increased rather than decreased the discrepancy.

  • some miss-transformation in cube, like m.wikisource or m.wikidata not transformed into [wikisource + access_method = mobile]

That's interesting! But how does it translate into the observed differences in the total numbers, where all access methods are counted? It seems that a wrong access method classification for m.* domains would not have affected that (but would cause additional problems elsewhere).

Now some more interesting thing: spiders tagging.

diff_hive_cube_no_spider.png (612×812 px, 92 KB)

Here we can see a difference between hive and cube when we only consider no-spiders.
The chart below show the ratio (hive/cube) considering all agent types and no-spider only agent types.

diff_percent_hive_cube_spider.png (612×812 px, 68 KB)

We can see a clear difference between hive and cube: hive removes less spiders.

Again, great find, but: It seems that this has unearthed an additional problem rather than resolved the previously discussed problem, since the "daily differences" posted above concerned total pageviews regardless of spider/human classification.

An update in code should reduce this difference starting September 17th see (here).

That's great! Does this retroactively affect Hive data from before September 17, or not?

In any case I assume it does not chagne the total numbers (i.e. disregarding spider classification) on Hive whose discrepancies with the Cube data we discussed above.

PS: sorry about the late answer - getting reliable historical comparison data is very important for us in Reading, but Jon and I were prioritizing some more timely issues last week.

PPS: For the record, I noticed that these total numbers on Hive have been very slightly changing retroactively in any case, e.g. decreasing by less than 0.01% for each of the first four days of April (see below). While this increases the observed discrepancies a tiny bit, it doesn't seem relevant here. I assume it reflects the other modifications recorded in the change log, e.g. removing arbcom wikis.

dateCube (pageviews05)Hive (projectview_hourly) accessed Aug 15Hive accessed Sept 29
4/1/2015707994000703754393703740811
4/2/2015695838000691980785691968820
4/3/2015710488000685283454685269980
4/4/2015675997000675118881675109384

(queries: see above)

Hey Tilman :)
Thanks for your comments.

First, you are right, we have backfilled data removing arbcom wikis and outreach.wikimedia, this explains the change between now and last august.

About discrepancy, I think the relevant chart is

diff_percent_hive_cube.png (612×812 px, 38 KB)

It shows the ratio between cube and hive hourly. We see that discrepency moves randomly around 1.
Here is the same chart removing some outliers (2015-04-03), and then the same data plotted by hour of day.

diff_percent_hive_cube_no_outliers.png (612×812 px, 66 KB)

boxplot_by_hour.png (612×812 px, 39 KB)

While these charts show some good randomness, It is true that the median is more frenquently between 0.99 and 1 than between 1 and 1.01.

Just to be sure, I added a Kolmogorov-Smirnov test test on the hive and cube distributions, and obviously there is no stattstical difference between the two distributions (KS statistic = 0.027713625866050806, P-value = 0.99585181741233186)

If you think there is more to it, please let me know and let's discuss !

Joseph

Thanks Joseph - if you could also answer the other questions (in the comment before the PPS about backfilling data), that would be great.

I will spend some more time trying to understand this application of the Kolmogorov-Smirnov test (feel free to share the underlying spreadsheet or code), but right now I am a bit puzzled about how it relates to the question at hand. We already said above that we expect some random noise in the Cube data from the sampling method. But its size will obviously depend on the sampling rate (and also on the aggregation level - hourly vs. daily - as discussed above on Sept 18). If we were to sample 1:100000, say, we'd expect the Cube data to differ much more from the unsampled data on Hive than with 1:1000, and a 1:1 rate would mean that the Cube and Hive data have to be identical (and that any discrepancies mean that there have been errors).

However, unless I'm missing something about how you applied this test, your statement "obviously there is no stattstical [sic] difference" does not depend on the sampling rate. I.e. it would apply even to the situation where the pageviews recorded in Cube would need to correspond 1:1 to the pageviews recorded in Hive. This is of course absurd. Let me know if I'm misunderstanding something.

Hey Tilman,
About bots no backfill was done. It could have been possible to do it from July 17th (2 month of refined webrequest are kept), but we try to prevent backfilling when there is no critical issue in the data as with the arbcom.

About the statistical test, I just wanted to express that the difference we find between cube and hive data is not significant statistically. It certainly doesn't explain the difference that exists between both.
I am sorry for having aimed at the wrong target ...

I have reviewed again the pageview definition history, and nothing strikes me.

What I will do now is to recompute is_pageview for the sampled data for april. I expect the numbers to be closer to the hive ones (in the sampling-explainable interval).
That would then mean that there was a difference in the way pageviews were computed by @Ironholds using R and the way it has been implemented in Java.

Tilman: I confirm the discrepancy we observe comes from a difference in the computation of the pageview boolean, and not the sampling (see below).
Understanding the difference more precisely would involve @Ironholds, to provide his code for the computation of april month.

dayHive-unsampledCubeHive-sampledCube / H-unsampledH-sampled / H-unsampled
2015-04-017037408117079940007031600001.00604368670.9991746805
2015-04-026919688206958380006910900001.00559155250.9987299717
2015-04-036852699807104880006850800001.03680012370.9997227662
2015-04-046751093846759970006750200001.00131477360.9998676007
2015-04-056991413807016040006977140001.00352234910.9979583815
2015-04-067598437127620810007602360001.00294440551.0005162746
2015-04-077644735667668950007634930001.00316745290.9987173317
2015-04-087589296297608400007571120001.00251719120.9976050098
2015-04-097371416517398810007363180001.00371617720.9988826422
2015-04-106851178936866920006837860001.0022975710.9980559652
2015-04-116565725776579470006561890001.00209332990.9994157889
2015-04-127083079217103160007064480001.00283503680.997374135
2015-04-137488188287519910007485550001.00423623430.9996476745
2015-04-147479062457516300007468900001.00497890610.9986412134
2015-04-157322689407349090007321890001.00360531470.9998908325
2015-04-167330686577353860007312310001.00316115410.9974931993
2015-04-176915290836936360006907590001.00304675110.9988864055
2015-04-186496009486488700006496500000.99887477381.000075511
2015-04-197141030287123190007127900000.99750172180.9981612905

The sampling is done daily, and the version of pageview I have used for the Hive-sampled set is the most recent one (I have tested the previous ones as well, the difference is really really small).
Let's get in touch and decide how we move forward.

Tilman: I confirm the discrepancy we observe comes from a difference in the computation of the pageview boolean, and not the sampling (see below).

Knowing that means a big step forward; thanks for all the time you are putting into this!

Understanding the difference more precisely would involve @Ironholds, to provide his code for the computation of april month.

I think @Ironholds already recommended this approach himself on August 24 above, so I hope he will be happy to provide a pointer to that code.

dayHive-unsampledCubeHive-sampledCube / H-unsampledH-sampled / H-unsampled

[...]

The sampling is done daily,

OK, we need to be aware that per Andrew above the real sampling is done hourly instead of daily (and presumably was done this way for the Cube data until April 2015 too). Let's assume for now that this doesn't affect the conclusion from your simulation.

and the version of pageview I have used for the Hive-sampled set is the most recent one (I have tested the previous ones as well, the difference is really really small).
Let's get in touch and decide how we move forward.

Great - I may try to catch you on IRC early tomorrow morning PDT (from say 15h UTC); we actually have a quite timely need right now for comparable historical data because we are finalizing the slides for next week's quarterly review of the Reading team and want to include reliable YOY comparisons there. I'll follow up here on another issue regarding that.

...

Now some more interesting thing: spiders tagging.

diff_hive_cube_no_spider.png (612×812 px, 92 KB)

Here we can see a difference between hive and cube when we only consider no-spiders.
The chart below show the ratio (hive/cube) considering all agent types and no-spider only agent types.

diff_percent_hive_cube_spider.png (612×812 px, 68 KB)

We can see a clear difference between hive and cube: hive removes less spiders.

An update in code should reduce this difference starting September 17th see (here).

This is a new and quite important finding. I should say that for the purposes of the Reading team (such as the aforementioned quarterly review) we are mostly interested in human pageviews only. I.e. in that use case, the discrepancies with the historical data are now much larger than assumed. To check, I have re-generated the earlier "daily discrepancies" table for non-spider views below; I guess the percentages correspond to the green line in your second chart above.

datepageviews05 (Cube)projectview_hourly (Hive)Cube/Hive
4/1/201559267400060254628198.36%
4/2/201558389200059255995198.54%
4/3/2015599624000588147712101.95%
4/4/201556806700057742084598.38%
4/5/201560104700060999803598.53%
4/6/201565096800066269439998.23%
4/7/201564856700066061590898.18%
4/8/201563619500064639243798.42%
4/9/201561587700062627062998.34%
4/10/201557535200058526051798.31%
4/11/201554928500055815419598.41%
4/12/201559814800060584382298.73%
4/13/201564719400065324928599.07%
4/14/201563583900064564118598.48%
4/15/201561422100062204170298.74%
4/16/201560562900061611088798.30%
4/17/201557930800058827316198.48%
4/18/201554275500055366140398.03%
4/19/201560246200062249843696.78%
sum114471040001161738079098.53%

While this error is much larger than the one we are still investigating for the total pageviews, it is at least better understood, if we assume that the changes in the spider definition (your difflink) explain most of it.

Data via

mysql --defaults-file=/etc/mysql/conf.d/research-client.cnf -hanalytics-store.eqiad.wmnet --database staging --batch --execute "SELECT LEFT(timestamp, 10) AS date, SUM(pageviews) FROM pageviews05 WHERE timestamp>='2015-04' AND is_spider = FALSE AND is_automata = FALSE GROUP BY date;"

and

hive (default)> SELECT CONCAT(year,"-",LPAD(month,2,"0"),"-",LPAD(day,2,"0")) as date, SUM(view_count), year, month, day FROM wmf.projectview_hourly WHERE (year=2015 AND month=4 AND day<20) AND agent_type = 'user' GROUP BY year, month, day;

For the record, Oliver has shared the reference implementation of the pageview definition underlying pageviews05: https://github.com/wikimedia-research/pageviews ("you want (particularly) read_sampled_log and to_pageviews"), and Joseph is going to compare it with the Java code underlying projectview_hourly/pageview_hourly.

Tilman,
I found that the definitions matching issue is, while small, less simple than I expected.
I have not managed to get closer to the R definition than 0.07% in average, even with the closest fit I could get.
Also, while investigating, I found a bug in my previous analysis between hive-unsampled and hive-sampled --> they now reconciliate really well.

There are 3 impacting differences in the filtering logic between pageviews in R and in java, in addition to the projects (mediawiki and wikimediafoundation) already discussed.

  1. No filter of action=edit in R while present in java (~ + 3416000 / day)
  2. search pages not included in R while in java (~ +464000 / day)
  3. uri host are not converted to lowercase in R while they are in java (~ -614000 / day)
dayHive-unsampledHive-sampledH-sampled / h-unsampledCubeHive-sampled-modifiedCube / hive-sampled-modifed
2015-04-01703740811704571000100.118%70799400070816700099.98%
2015-04-02691968820692450000100.070%69583800069633900099.93%
2015-04-03685269980686220000100.139%710488000689739000103.01%
2015-04-04675109384676260000100.170%67599700067890500099.57%
2015-04-0569914138069893600099.971%70160400070202900099.94%
2015-04-06759843712761692000100.243%76208100076404500099.74%
2015-04-07764473566765310000100.109%76689500076904500099.72%
2015-04-0875892962975868500099.968%76084000076221900099.82%
2015-04-09737141651737644000100.068%73988100074153200099.78%
2015-04-10685117893685191000100.011%68669200068834600099.76%
2015-04-11656572577657446000100.133%65794700066000800099.69%
2015-04-1270830792170778900099.927%71031600071053700099.97%
2015-04-13748818828749873000100.141%75199100075367000099.78%
2015-04-14747906245748232000100.044%75163000075203200099.95%
2015-04-15732268940733471000100.164%73490900073709200099.70%
2015-04-1673306865773257500099.933%73538600073599900099.92%
2015-04-17691529083692118000100.085%69363600069530000099.76%
2015-04-18649600948650982000100.213%64887000065385500099.24%
2015-04-1971410302871402000099.988%71231900071707400099.34%

Have you checked when those four Java differences were added to the Java?

@Ironholds: I corrected my previous comment: three diffs, not four.

  1. No filter of action=edit in R while present in java (~ + 3416000 / day)

Commited the 27th of February 2015, change-id I0ec309ebf62eaeaec0d3e612ecf0d0af831b1e1d

  1. search pages not included in R while in java (~ +464000 / day)

Commited the 3rd of March 2015, change-id I9312cbfcc3987c6a70c3c95a288ce4cefc91dc31

  1. uri host are not converted to lowercase in R while they are in java (~ -614000 / day)

Commited the 5th of January 2015 (original commit for the file), change-id Idf32e1f94ee267d5cb0d90f15a9afbef32e669c2


I have found a (hopefully) last bug in my try for re-computation of R-like pageviews in hive (search for query parameters (curid, oldid, title) is done only if the query paramter is first (just after ?) in R. It makes the result fit less, but it's more correct.
The last two things I could image that create the difference are:

daycubeHive-sampled-modifiedcube/ hive-sampled-modifed
2015-04-01707994000708690000100.10%
2015-04-02695838000696815000100.14%
2015-04-0371048800068996800097.11%
2015-04-04675997000679124000100.46%
2015-04-05701604000702264000100.09%
2015-04-06762081000764555000100.32%
2015-04-07766895000769940000100.40%
2015-04-08760840000762926000100.27%
2015-04-09739881000742005000100.29%
2015-04-10686692000688846000100.31%
2015-04-11657947000660337000100.36%
2015-04-12710316000710869000100.08%
2015-04-13751991000754157000100.29%
2015-04-14751630000752552000100.12%
2015-04-15734909000737567000100.36%
2015-04-16735386000736446000100.14%
2015-04-17693636000695827000100.32%
2015-04-18648870000654245000100.83%
2015-04-19712319000717343000100.71%

@Ironholds: I have re-run the R code on stat1002 having installed github versions of the R packages--> Got quite different results from the ones in DB.
I did (sorry for the poor code, I am not a R person):

library(pageviews)
pvcount <-lapply(get_files(earliest="2015-04-01", latest="2015-04-19"), function(l) nrow(to_pageviews(read_sampled_log(l))))

And got that result:

721702
704113
689490
717606
669698
716917
766752
772423
751207
732034
672779
669549
720380
752698
750538
732099
728555
686288
648094

Any idea ?

Don't apologise, that looks like totally serviceable code (heck, it's
pretty much precisely how I'd do it). Tried multiplying the results by
1,000? ;p

Even there, there's variation - my hypothesis would be ts filtering.
So, some log lines are simultaneously screwy and invalidly formatted -
as a simple heuristic against that I used to filter out any row
without a valid timestamp field (since that's a standardised format
storing server-side information).

So try, for the anonymous function:

data <- read_sampled_log(l)
data$timestamp <- convert_timestamp(data$timestamp)
data <- data[!is.na(data$timestamp),]
nrow(to_pageviews(data))

Timestamp conversion tested on one day 2014-04-01 (heavy computation, so keep it small) --> still 721702.

I have another experiment on the go: files contains partial days starting at 06:25 in the morning --> data needs to be reaggregated instead of taken by file.

Will know more tomorrow.

kevinator renamed this task from Investigate sample cube pageview_count vs unsampled log pageview count [5 pts] to Investigate sample cube pageview_count vs unsampled log pageview count [5 pts] {hawk}.Oct 6 2015, 1:26 AM
JAllemandou renamed this task from Investigate sample cube pageview_count vs unsampled log pageview count [5 pts] {hawk} to Investigate sample cube pageview_count vs unsampled log pageview count [13 pts] {hawk}.Oct 6 2015, 10:13 AM

Confirmed: files don't contain days, so recombination among files is needed.
This done, I got back on the same numbers as the one in DB for the first few days.

This is a new and quite important finding. I should say that for the purposes of the Reading team (such as the aforementioned quarterly review) we are mostly interested in >human pageviews only. I.e. in that use case, the discrepancies with the historical data are now much larger than assumed. To check, I have re-generated the earlier "daily >discrepancies" table for non-spider views below; I guess the percentages correspond to the green line in your second chart above.

It will be more correct saying "pageviews not tagged as bots". We know there is a bunch of automated crawler traffic that we are not catching, thus you cannot assume that pageviews not tagged as spider are "human" pageviews. Side note but an important one.

Right, but what I said was that "for the purposes of the Reading team (such as the aforementioned quarterly review) we are mostly interested in human pageviews only" and that's still correct ;) Pageviews not tagged as bots/spiders are the metric we use for that because it's the best proxy we have. Good to keep its limitations in mind, of course.

@JAllemandou : I see you moved this task to "done" on the board, but left its status as open. In our October 6 IRC discussion (log) we had resolved to collect the various findings from this task into an overview table, ideally with an estimate/upper bound for the discrepancy caused by each (even just orders of magnitude are helpful too), and dates where the change was introduced (if applicable). Like this:

description of the differencepageviews05/Rpageview_hourly/Javasize estimateChange date, link
"action=edit counted?yesno~ + 3416000 / dayFebruary 27, 2015
...............

You suggested a wiki page for this, which makes great sense to me. Has this been started already? If you're still wondering about a suitable page name, how about something like https://meta.wikimedia.org/wiki/Research:Page_view/Dataset_discrepancies (to be linked from / to https://meta.wikimedia.org/wiki/Research:Page_view#Change_log )?

@Tbayer, our tasks just remain open as a matter of process, the product owner closes them as resolved to acknowledge that it's completed to everyone's satisfaction. As far as this task is concerned, it was going on for a long time so I suggested we wrap it up. If there's anything else to be done, please open separate tasks for each item of work. That makes it easier on us to track and stay predictable with our other work.

@Tbayer
Sorry but team does not agree that the differences between the old R code and the current pageviews need to be keep up to date in a wiki page. We feel we have put quite a bit of work in documenting something that should be obvious, namely that the R pageview code that was written more than 6 months ago is outdated, it is to be expected that results using that code will differ from pageview definition in Java, more so as time goes by. We understand for some time period you only have data from the R definition and that is unfortunate, should you feel you need to keep up to date a list of differences these are the resources you can use:

Changelog of pageview definition is kept here:
https://meta.wikimedia.org/wiki/Research:Page_view#Change_log

Changes to java code are here:
https://github.com/wikimedia/analytics-refinery-source/commits/master/refinery-core/src/main/java/org/wikimedia/analytics/refinery/core/PageviewDefinition.java

The authoritative source as to changes to the definition is the java code but we try our best to keep wikis up to date.

For what it's worth, as the author of both the R definition and the Java definition I absolutely agree with this approach - with the exception that the authoritative source should be the wikis. "the code documents itself!" has never and will never be true of absolutely anything. Teams at the Wikimedia Foundation have a duty of transparency and the wiki page should always be up to date, because that's where the transparency comes from. If the wiki page and code disagree, the code is wrong.

If the wiki page and code disagree, the code is wrong.

You are right, this should be the approach for a definition with such a high visibility. We have made an effort to keep those wikis shinny so they should be the primary reference.

English really needs a word for "yay, we agree!" but in the absence of that I'll just say this :P

Update: So @JAllemandou was in SF last week for the Dev Summit and All Hands, and he and I took the opportunity on Friday to sit down in person and carry out the above mentioned plan to summarize the findings from this task (and clarify some that had not been fully clear to me from the comments here). The result is this table on Meta-wiki. Feel free to edit, and of course to add possible future findings. It took us about 40 minutes to compile this.

@Tbayer, our tasks just remain open as a matter of process, the product owner closes them as resolved to acknowledge that it's completed to everyone's satisfaction. As far as this task is concerned, it was going on for a long time so I suggested we wrap it up. If there's anything else to be done, please open separate tasks for each item of work. That makes it easier on us to track and stay predictable with our other work.

In my understanding a task is done when the underlying objective has been achieved, not when it has stayed open for a certain amount of time. That said, I agree that the objective of "investigate ..." had not been spelled out very clearly in the original task description. From my perspective, it has been to understand the discrepancies between these two datasets well enough to be able to combine them for the purpose of doing historical comparisons beyond April 2015. That was not the case when the task was closed on October 15. With the new table we at least have a better grasp on what has been found so far, even though we may still not have explained every difference fully.

I was a bit surprised to see the importance of valid historical comparisons questioned a lot, so let me dwell on that a little. There is a lot of attention - internally at WMF, from our community, and in the general public - for how this metric (total pageviews) develops in the long term. E.g. just two days ago, the largest German weekly newspaper highlighted a supposed year-over-year drop in these total PVs while covering Wikipedia's 15th anniversary. The new Reading Product page, the WMF quarterly report and the Reading team's quarterly review all track its year-over-year changes (in each I had to link back to this bug as a caveat about the lack of reliable comparable data, but will now be able to refer to the new overview on Meta). For all these audiences, the difference between a +2% increase and a -2% decrease (say) year-over-year matters quite a bit. As another example, I recently resorted to the pageviews05 data to investigate a traffic drop in mid-December (to decide whether it could still be seasonal, or was worth ringing an alarm; will cover this in the upcoming readership metrics report).

It's true that work on this task drew out a bit, but consider that the most important finding here (accompanied by a bug fix) came only after several weeks, and that it was only after over a month that work began on Oliver's suggestion to compare the code directly, leading to further important findings - e.g. regarding action=edit - more than six weeks after the task had been opened. There were also various false starts in the investigation that I spent time helping to correct. I take some responsibility for not highlighting clearly that we would already have needed this resolved at the end of September for Q1 quarterly review/report - this was an oversight on my part, but in general I also wanted to be mindful of the Analytics team's workload at the time (pageview API etc.).

@Tbayer
Sorry but team does not agree that the differences between the old R code and the current pageviews need to be keep up to date in a wiki page.

That's a misrepresentation of what I asked for, and of what this task had been about. The investigation above was focused on the discrepancies caused by a one-time change (from the R implementation to the Java implementation of the same page view definition). IMHO these discrepancies should have been documented back then already, instead of being uncovered months later by an analyst from another team who had been advised by the Analytics department to use this data for comparison.

We feel we have put quite a bit of work in documenting something that should be obvious, namely that the R pageview code that was written more than 6 months ago is outdated, it is to be expected that results using that code will differ from pageview definition in Java, more so as time goes by. We understand for some time period you only have data from the R definition and that is unfortunate, should you feel you need to keep up to date a list of differences these are the resources you can use:

Changelog of pageview definition is kept here:
https://meta.wikimedia.org/wiki/Research:Page_view#Change_log

Changes to java code are here:
https://github.com/wikimedia/analytics-refinery-source/commits/master/refinery-core/src/main/java/org/wikimedia/analytics/refinery/core/PageviewDefinition.java

The authoritative source as to changes to the definition is the java code but we try our best to keep wikis up to date.

For the record, I fully agree with the outcome of the subsequent discussion stating that the definition as recorded on the wiki should be regarded as the authoritative specification. And ideally it should be specific enough to avoid differences between different implementations in the first place.