What it says on the tin, please.
Description
Description
Details
Details
| Status | Subtype | Assigned | Task | ||
|---|---|---|---|---|---|
| Resolved | mpopov | T110590 Add breakdown of zero results rate by language/project pair to dashboard | |||
| Resolved | • csteipp | T109384 Security review of apache/avro and nmred/kafka-php | |||
| Resolved | bd808 | T111851 Package the Avro PHP library for easier Composer usage | |||
| Resolved | Ironholds | T112295 Design and agree on an Avro schema for cirrus search request logging to hadoop | |||
| Resolved | mpopov | T126244 Add data collection for getting zero results rate by language/project |
Event Timeline
Comment Actions
This will be significantly easier when T109384 is complete, so I am marking this as being blocked by that.
Comment Actions
Moving this out of the sprint to reflect reality, as it's been bumped in priority several times. I've placed this card at the top of the backlog for now.
Comment Actions
Practically speaking:
- This is definitely something we want to work on after the Cirrus->Kafka work is done;
- We still have no idea how we're going to visualise that many pairings in a satisfactory way (other than infinitely long sets of dropdowns).
Comment Actions
This is done. We need to get UDF that marks a search request as concluding in zero or nonzero results. Then we can just aggregate by wikiid and zero_results
- We still have no idea how we're going to visualise that many pairings in a satisfactory way (other than infinitely long sets of dropdowns).
I was thinking of doing something similar to the "Tile by zoom level" (http://discovery.wmflabs.org/maps/#tiles_total_by_zoom) where the user can choose an arbitrary combination of zoom levels to visualize simultaneously. So we could have two of those and let the user select arbitrary pairs.
P.S. Extracting 'Language' and 'Project' from wikiid will be trivial after this PR is merged https://github.com/Ironholds/wmf/pull/5 :)
Comment Actions
Okay. So I've got a query that works and gets what we want. Problem: we have A LOT of wikis. Specifically, for 2015-11-10, the query returns nonzero/zero results counts for 840 wikis! That means the dataset containing these aggregates is going to grow by ~840 rows every day. That's...not good.
Do we want to limit this to specific wikis? Daily top 100? Daily top 10? Here are the top 20 wikis for 2015-11-10 by # of nonzero-result queries:
| wikiid | nonzero | zero |
| enwiki | 36098192 | 13447949 |
| dewiki | 7758329 | 3313155 |
| eswiki | 5458995 | 4478491 |
| ruwiki | 3731576 | 1997517 |
| frwiki | 3256820 | 1848667 |
| ptwiki | 2362003 | 1625427 |
| itwiki | 1863855 | 1555819 |
| jawiki | 1856930 | 1569374 |
| nlwiki | 1048732 | 666615 |
| plwiki | 887922 | 609215 |
| arwiki | 829061 | 631924 |
| zhwiki | 796523 | 1194192 |
| trwiki | 670233 | 361888 |
| cswiki | 646477 | 407798 |
| svwiki | 582628 | 312900 |
| commonswiki | 526404 | 1104818 |
| enwiktionary | 452353 | 357523 |
| idwiki | 436878 | 316690 |
| wikidatawiki | 414617 | 1001767 |
| fawiki | 390492 | 370154 |
Thoughts, @Ironholds & @Deskana?
Comment Actions
P.S. Query for posterity/future ref:
USE ebernhardson;
SELECT wikiid,
  SUM(results.outcome) AS nonzero,
  COUNT(*)-SUM(results.outcome) AS zero
FROM (
  SELECT wikiid, IF(requests.hitstotal[SIZE(requests.querytype)-1] > 0, 1, 0) AS outcome
  FROM cirrussearchrequestset
  WHERE year = 2015 AND month = 11 AND day = 10
) AS results
GROUP BY wikiid;
Comment Actions
To answer the actual question I was asked, it might be good to have the top n projects (for, say, n=3) on the dashboard somewhere, but the question is... where? Clutter is bad, so we need to be careful about throwing more data in because we can.
This would be a good topic of discussion for the Analysis meeting this afternoon.
Comment Actions
We've solved some of the questions about visualisations here, because we did something very similar with the portal dashboards in T123347: Include geolocation data in portal dashboards. So, given that, this can be reprioritised because there's not as many outstanding product questions.
This still represents a not-unsubstantial amount of engineering work, though.
Comment Actions
Change 270449 had a related patch set uploaded (by Bearloga):
Adds ZRR breakdown by language/project - Depends on Iad9600b11443d9bed6aafcc1dd0e11ce5eda0e8e - Dynamically populates list of languages and projects - Lets user select arbitrary combinations to visualize

Comment Actions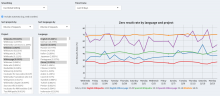
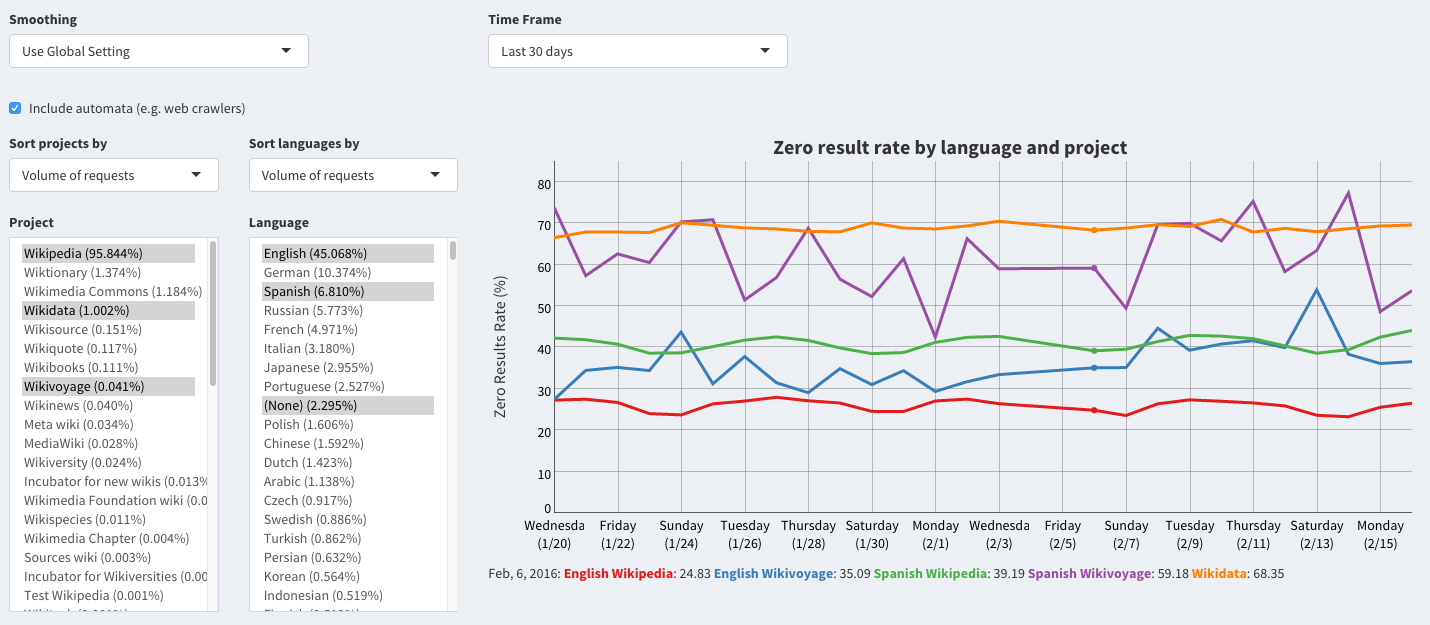
Now waiting for CR from @Ironholds before we deploy to the beta instance. Here's how it looks:
Comment Actions
Live on beta instance for testing: http://discovery-beta.wmflabs.org/metrics/#failure_langproj
@Deskana have fun and let us know if you run into any problems. If you're happy with it after a few days (or a week?) we'll push it out to production.
I'm personally not satisfied with the performance hit at startup (caused by reading in the 2 new datasets which are substantially larger than the others we have) but there's also not much we can do about that. It's just going to be a slow initial experience for whoever is the first person to open the dashboard on any given day. I wonder if we should move this out of the metrics dashboard and into its own "experimental" dashboard (where the forecasting dash lives). That way Dan and others can still use it but without it having an impact on the main dashboard. @Ironholds, thoughts?
Comment Actions
I'm not sure if moving is necessarily the solution. Like, this should eventually live in those dashboards.
Do we gain anything if we do all the processing server-side? Like, we could output both a flat TSV for transparency/reproducibility purposes, and a serialised .RData all the computations have happened on, and rely on the RData. It should be much faster to load.
Comment Actions
Change 271822 had a related patch set uploaded (by Bearloga):
Deploy all bunch of cool stuff